ABSTRACT
A myriad of factors have been shown to influence the morphology of freshwater fish. However, studies that parse out where variation is coming from (e.g. body size, sex, and habitat) as well as what potential these changes have to influence function (e.g. swimming performance) are understudied. Therefore, the objectives of this study were to describe morphological variation of Bluegill Lepomis macrochirus across the Grand Lake St Mary's watershed area (northwest OH, USA) and test for covariation of morphology with size, sex, and habitat as well as to assess swimming performance to discern whether any differences in habitat (and morphology) correspond with functional aspects related to critical swimming velocity. Geometric morphometric methods were used to assess shape variation among individuals and general linear models were used to test for covariation of morphology with size, sex, and habitat. Analyses indicated that body size was the strongest driver of morphological variation followed by sex, habitat, and interactions – indicating the presence of allometry, sexual dimorphism, and the potential for habitat induced plasticity. In general, more robust morphologies tended to correspond with larger individuals, males, and/or individuals from lentic habitats. Swimming performance trials supported functional differences as individuals from lotic habitats demonstrated significantly higher Ucrit swimming performance values (∼+20%) than lentic individuals. Broader applications of these findings can link to evolutionary ecology, management, and conservation.
Introduction
The relationship between organismal morphology and environment is a long standing topic of interest among ecologists and has been steadily gaining interest since the first ecomorphology studies began to relate form, function, and environment (Delacour & Mayr Citation1945; Verheyen Citation1953; Delacour Citation1959). Ecomorphology has helped facilitate understanding of what can potentially drive body shape and niche and has established templates for the study of morphological relationships with resource use, life history, and evolution. Specifically, the application of ecomorphology can provide valuable insight into ontogeny, phylogeny, and evolution. However, despite the obvious utility of ecomorphology and its growing literature base – there is still much room for improving our understanding of the various taxonomic groups and clades of North American fishes.
Morphological variation is driven by the influence of evolutionary (Felsenstein Citation1976; Fransen Citation2011) and environmental factors (Green & Côté Citation2014; Santos & Araújo Citation2014) which contribute to both intraspecific and interspecific variation. Such selective pressures are not mutually exclusive, however, as both couple together in driving morphological variation on an individual and population level (Dhuyvetter et al. Citation2007). While the comparison of morphological characters and molecular markers provide valuable insights into evolutionary and environmental processes that contribute to morphological variation, the relative contributions made by either factor is understudied. Furthermore, while morphological variation is expected in freshwater fishes (Alexander et al. Citation2006), how much or what proportion of variation is attributable to physiological changes in body size or sex or environmental changes in habitat is largely unknown for many taxa.
The development of morphological features as a function of body size is a major source of shape variation within fish species. Across a given species complete ontogeny the morphological variation exhibited is often the greatest contributor to shape change (Wainwright Citation1996). Ontogenic variation in growth-morphology trajectories are shaped by selective pressures relating to a variety of functional factors, including diet, maturity, predation pressures, and habitat type (Hjelm et al. Citation2001; Neves et al. Citation2015) that coincide with change during a lifetime of development. Morphological changes during ontogeny strongly influence performance and can provide implications for success of particular size classes dependent on diet, sex, and/or habitat. The effects of available food resources, sexual maturity or reproductive life history, as well as habitat differences on morphological variation in growth trajectories coinciding with body size between fishes have been identified and tied back to increased advantages for some individuals (Wainwright Citation1996). For example, the complex set of interrelationships that accompany ontogenic changes has been well documented in populations of Eurasian Perch (Perca fluviatilis) collected from different habitats where ontogenic trends in morphology have been shown to differ between littoral and pelagic microhabitats in the same ecosystem (Svanbäck & Ecklöv Citation2002).
Sexual dimorphism between male and female individuals provides an additional source of morphological variation. Although not necessarily independent of ontogenic changes, as many species do not diverge in morphology until reaching sexual maturity (Jacquemin & Pyron Citation2013), sexual dimorphism is widespread among many organisms and suggests that variation between sexes is a result of adaptation (Shine Citation1989). Describing shape variation between male and female individuals can provide valuable information on the mechanisms present in reproductive processes. Although not universal across species, numerous species which demonstrate sexual dimorphism in morphology (as well as size) have been linked back to a balance between fecundity constraints and success (Svensson et al. Citation1986). To further complicate this interpretation, recent studies have identified variation in size, age, and morphology of those individuals that become sexually mature that can be contingent on levels of intraspecific competition (Ehlinger Citation1997). Although differences in morphology between sexes can be nuanced as a result of habitat, diet, competitive interactions, etc. at a very fundamental physiological level, these differences are typically the result of females carrying ovaries (typically a larger organ) filled with eggs (a larger gamete) compared with males carrying testes filled with sperm (Parenti & Grier Citation2004).
Morphological variation can also be induced by environmental factors. This can occur as a result of phenotypic plasticity, selection, or a combination (Hollander et al Citation2006). The ability of a single genotype to produce more than one phenotype as a result of environmental heterogeneity (at multiple scales) is a response that is well documented in freshwater fishes (Franssen Citation2011). However, it is important to note, that environmentally induced differences are indirect measures, rather than direct, where other factors associated with the change in habitat play a larger role. Similar to other factors that relate to morphological variation, environmentally induced shape divergence in fish has been associated with a variety of parameters, including risk of predation (Reznick Citation1982; Brőnmark & Miner Citation1992; Godin & Briggs Citation1996), diet availability (Showalter et al. Citation2016), differences in flow regime (Hendry et al. Citation2006), and more. For example, studies on populations of Poeciliidae indicate that those experiencing increased levels of predation tend to exhibit larger caudal and smaller head regions than those without high levels of predation risks (Langerhans & Makowicz Citation2009) and that this relationship can be sex specific (Hendry et al. Citation2006). Moreover, these variations in shape as a result of habitat have been linked to swimming performance, a major driver of escape behavior and dispersal ability in moving water, where as a result of developing a deeper body one could be expected to reduce swimming efficiency due to drag (Law and Blake Citation1996; Zimmerman Citation2007). Variation in flow regimes contribute to many habitat differences and have been shown to have a profound effect on morphological characters in freshwater fishes (Langerhans et al. Citation2003; Langerhans et al. Citation2007). Populations which inhabit regions with increased flow (lotic) tend to develop streamlined bodies which correspond with reduced drag and increased abilities to maintain steady swimming speeds in flow. By contrast, individuals from habitats with no flow (lentic) tend to develop deeper bodies which elevate its ability to traverse structurally complex habitats (Langerhans Citation2008; Santos & Araújo Citation2014). Water flow is thought to drive predictable morphological variation, but comparative evidences have shown that fish can develop different environmental responses based on energetics and cost reduction strategies leaving many unanswered questions regarding phenotypic variation across flow regimes (Pakkasmaa & Piironen Citation2000; Langerhans Citation2008).
Overall, evidence coupling together size, sex, and environment indicates that a suite of factors – albeit individually or interacting – can potentially drive morphological variation among populations (Hendry et al. Citation2006; Langerhans & Markowicz Citation2009). These variations in morphology are important to quantify as they can facilitate a greater understanding of ecology by providing clear functional links that can then be used to better understand a host of issues associated with niche, adaptation, persistence, performance, and more. Despite the breadth of the aforementioned literature and clear applications, morphological responses are not fully understood for all taxonomic groups and clades, where many species are understudied or could benefit from additional inquiries pulling from other populations, methodologies, or functional approaches. The study organism associated with this research, the Bluegill (Lepomis macrochirus), represents a case where a growing literature base already describes a variety of aspects of biology but could benefit from additional morphological study. Bluegill is endemic to freshwater ecosystems in North America and is considered abundant across a wide variety of habitats. From a management perspective, Bluegill is a highly sought after sportfish and are heavily stocked in many lakes, reservoirs, and ponds (Jackson Citation2002; Yokogawa Citation2013; Taguchi et al. Citation2014). From a biological perspective, past works have described their general niche (Spotte Citation2007), diet (Werner & Hall Citation1988; Masagounder et al. Citation2014), behavior (Werner & Hall Citation1977; Partridge et al. Citation2015), and aspects of morphology ranging from variation between sizes, sexes, particular habitats (micro and macro), reproductive state, and life histories, to the role that museum preservation may play on shape (Layzer and Clady Citation1987; Ehlinger Citation1990; Ehlinger Citation1991; Ehlinger et al. Citation1997; Yokogawa Citation2009; Colborne et al. Citation2011; Gaston et al. Citation2013; Yokogawa Citation2013; Gaston and Lauer Citation2015). However, despite this growing literature base there is a lack of watershed level information on the relative influence of body size, sex, and habitat (particularly with regard to morphological responses to flow) that controls for covariates, accounts for interactions, and uses laboratory testing to directly verify and test any resulting hypothesized links with any functional application to the observed morphological variation in Bluegill. Therefore, the primary objectives of this study were to (1) describe variation in Bluegill body morphology across the Grand Lake St Mary's (GLSM's) watershed area by testing for morphological covariation with body size, sex, and local habitat using novel morphometric methodologies as well as (2) to review and establish potential functional mechanisms related to morphological variation that could be tied to diet, fecundity, and/or swimming performance using a combination of literature reviews and laboratory testing. We predicted that morphological variation would be exhibited in populations across the watershed consistent with body size, sex, and habitat type as a result of selection for ontogeny, sexual dimorphism, and environmental plasticity.
Methods
Study area
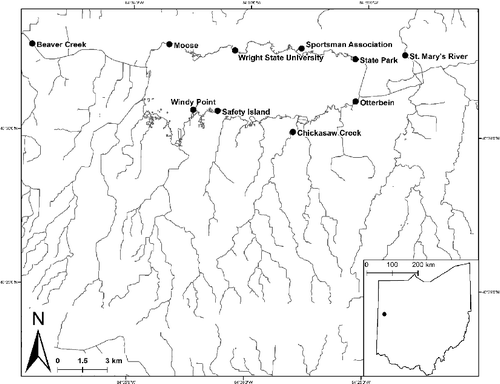
The GLSM watershed covers about 239 km2 in northwest Ohio and eventually empties into the Wabash River and ultimately contributes to the area of the Ohio River drainage basin (). However, one important peculiarity to note is that as a result of anthropogenic influences on the basin during widespread shipping canal use in the mid-1800s, Grand Lake is also connected to the St Mary's River, a major tributary of the Maumee River and ultimately Lake Erie drainage basin (). Past studies (Hoorman et al. Citation2008; Filbrun et al. Citation2013; Dumouchelle & Stelzer Citation2014) have documented highly variable water quality parameters within the GLSM watershed area consistent with seasonal variation in water temperature, dissolved oxygen, turbidity, nutrient loading (e.g. nitrates and phosphates), and specific conductance.
The aquatic habitat of the GLSM watershed area is composed mostly of low gradient streams of small to medium size with primarily sand and silt substrate resultant of glacial till depositions. These tributaries primarily drain in to the main body of water – GLSM, which is one of the largest manmade lakes in North America, covering about 54.4 km2 in Mercer and Auglaize counties (Ohio, USA). Hand dug in 1837, GLSM functioned as a supply reservoir for the Miami and Erie Canal (Clark Citation1960) but currently serves as a public water supply for the city of Celina and recreational outlet (Davenport & Drake Citation2011). The GLSM terrestrial and riparian area is primarily composed of row crop and animal based agriculture (82%), residential (5%), forest (4%), and animal feeding operations (1%) (GLSM, 2005). Specific to biota, Ohio EPA fisheries surveys have identified 27 fish species within the lake with as many as 49 species from connected inflow/outflow waterways outside the immediate basin as well as tributaries such as the St Mary's River, Chickasaw Creek, and Beaver Creek (; Ohio Environmental Protection Agency sampling efforts 1995–2015). Due to the high levels of natural and anthropogenic connectivity, movement of fishes is theoretically possible between the reservoir, major tributaries, and outflow locations although this phenomenon has not been formally studied.
Habitat characterization and specimen collection
Sites in this study were chosen to represent both lentic and lotic habitats across the GLSM basin and connected waterways (St Mary's River) based on site accessibility and continuity with long term GLSM ecological research (; ). Additionally, the potential to show variation in water quality parameters was among the criteria considered in site selection. Each lentic site covered around 100m of shoreline while each lotic site covered approximately 10–15 times the wetted stream width. Habitat at each site was described using dissolved oxygen, pH, temperature, conductivity, average depth, substrate type, turbidity, as well as discharge and fetch length for lotic and lentic sites, respectively. In situ water quality parameters (dissolved oxygen, pH, temperature, and conductivity) were taken using a Hach Multimeter (HQ40D Multi) while turbidity measurements (NTU) were gathered using a Hach Turbidimeter (2100P). Average depth and substrate type was determined at each site using a standardized probing approach. A series of 25 probes equally spaced throughout each site were used in characterizing substrate type and depth. Measurements gathered from the longest uninterrupted stretch observed at each lentic site accounted for the maximum fetch length, which was taken from a southwestern direction to coincide with prevailing winds. Specific to lotic sites, discharge rates were gathered from the USGS National Water Information System. Chemical and physical water quality and habitat data taken at each site were described using basic general descriptive statistics.
Table 1. Physiochemical parameters and habitat characterization for sites within the GLSM watershed. All sites were sampled between 1 June 2015 and 1 July 2015.
Bluegill utilized in this study were collected from GLSM as well as tributary (Chickasaw Creek) and outflow locations (St Mary's River, Beaver Creek; ) during June of 2015 and 2016. Sampling efforts included a barge electrofishing and beach seines as part of an ongoing project monitoring the biological integrity of GLSM watershed. Electrofishing surveys were conducted using an ETS Electrofishing Systems unit operating under standard duty cycles, pulse frequencies, amperage, and voltage (250 v). Beach seines (5 mm mesh size; 15 × 2 m) were also pulled at each site a total of 5–10 times. Individuals at all stages of maturity were collected where all specimens were enumerated. Total length (to the nearest millimeter) and weight (to the nearest gram) was measured for each individual. Sex was determined through visual inspection of milt or eggs and verified using microscope dissection of gonads using a subset of specimens vouchered for archive in the WSU Biological Collection (Lake Campus, Celina, OH, USA). Individuals not vouchered were released following measurements and data collection. All collection efforts were consistent with Wright State University Animal Care and Use Committee Protocol (IRB – IACUC: AUP 1063) and Ohio Department of Natural Resources Collecting Guidelines.
Morphological data analysis
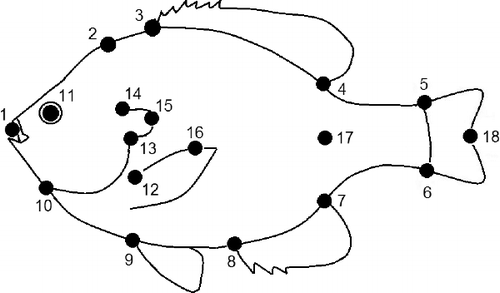
To characterize morphology of Bluegill, geometric morphometric methods were used. Geometric morphometrics is a contemporary approach to describing morphological variation using multivariate statistical analysis to evaluate the spatial arrangement of designated coordinates in reference to a common shape. Representing a series of manually set homologous landmarks, these coordinates provide effective visualizations of shape variation relative to all individuals (Klingenberg Citation2015). To describe shape configurations, each fish was first placed on a flat surface immediately upon collection and lateral images of the left hand side of each individual were captured using a digital camera (Nikon Coolpix 7620) adjacent to a reference scale. Images were digitized using the open-source Thin-Plate Splines (TPS) software tpsDIG (ver. 2.19; Rohlf Citation2001), according to a series of 15 manually set landmarks (). TPS software was also used to produce visualizations of shape and deformations relative to multiple individuals (Requieron et al. Citation2012; Mayer et al. Citation2014). Specimens were digitally unbent to account using a series of 4 landmarks placed at the tip of the snout and along the midline of each specimen (Rohlf Citation2004). Following digitization, geometric morphometric techniques were used to extract, visualize, and test for shape variation consistent with body size, sex, and habitat type.
Figure 2. Location of 18 manually set landmarks used for morphological analysis of Lepomis macrochirus: 1 tip of snout; 2 nuchal hump (follows angle of operculum to body); 3 anterior insertion of dorsal fin; 4 posterior insertion of dorsal fin; 5 insertion of last dorsal ray on caudal fin; 6 insertion of last ventral ray of caudal fin; 7 posterior insertion of anal fin; 8 anterior insertion of anal fin; 9 insertion of pelvic fin; 10 gill juncture; 11 midpoint of eye; 12 insertion of pectoral fin; 13 ventral insertion of opercular flap; 14 dorsal insertion of opercular flap; and 15 posterior edge of opercular flap. Landmarks numbered 1, 16, 17, and 18 were used to digitally unbend each specimen and thereby not included in the analyses.
Generalized Procrustes Analysis (least squares method) was used to align and transpose all individuals along a common scale (Cho et al. Citation2013). In doing so, comparisons in shape can be made between each specimen (Bartoli et al. Citation2013). Visualizations of shape variance were performed by TPS software by way of deformation grids produced by tpsRelw (Rohlf Citation2015) and tpsRegr (Rohlf Citation2016) software. Relative warp scores were used to summarize shape variation among individuals and were assigned to each specimen in relative warp analysis (RWA) as characterized by a single value which was then used to ordinate and assess differences in shape gradients among all individuals (Demayo et al. Citation2013). Extracted shape gradients accounting for at least 1% of variation were included in subsequent analyses.
Morphological differentiation as a function of habitat type, sex, and body size was tested for using a combination multivariate analysis of variance (MANOVA) and general linear modeling (GLM) techniques done in the R statistical environment (Shuker Citation2012). MANOVA using the Wilks’ statistic was used to test for morphological differentiation as a function of body size (length to the nearest millimeter), sex (M vs F), and habitat type (i.e. lentic or lotic) within the entire GLSM watershed. Visualizations of these overall trends elicited by MANOVA were done using the tpsRegr software (Rohlf Citation2016). In this analysis, RWA scores were designated as dependent response variables and body size, sex, habitat type, and interactions between body size × sex, body size × flow, and body size × sex × flow were designated as independent predictor variables. General linear models (GLM) were then used to further explore the significant effects and slope relationship of body size, sex, and habitat type on each of the primary RWA axes from morphology data of specimens within the GLSM watershed. RWA axes were designated as independent response variables and body size, sex, habitat type and interactions between body size × sex, body size × flow, and body size × sex × flow were designated as dependent variables. Reduced models were utilized where interaction terms or variables that were non-significant were excluded from subsequent model analysis (Ho et al. Citation2007). Coupling these individual models with the overall models facilitated conclusions regarding overall patterns, dominant morphological gradients, slope trajectories, and interaction points among grouping variables.
Functional mechanisms of morphology
To provide potential functional linkages between body shape and size, sex, and habitat, laboratory studies were undertaken to assess relationships between Bluegill body morphology and swimming performance. Since data in the literature is not available regarding swimming performance of Bluegill from different habitats, laboratory tests for swimming performance were conducted to fill in this gap. Swimming performance tests were undertaken using a Blazka style chamber (∼100 liter tank with 12 × 30 cm working section) and measured with a Ucrit protocol across a subset of similarly sized individuals comprising both male and female individuals from lentic (GLSM) and lotic sites (St Mary's River) within the watershed. Collected Bluegill were transported in aerated coolers back to 20 gallon lab aquaria at a maximum density of 4 fish per tank for approximately 7 days. During this time fish were exposed to 12:12 light cycles, climate controlled room temperatures, and fed a combination of brine shrimp and commercial flake meal twice daily. Physiochemical conditions were monitored every 3 days using standard Hach test kits to ensure appropriate water quality parameters were maintained. Individuals were deprived of food 12 hours before the start of testing so as to maintain a post-absorptive state. Prolonged swimming speed tests (critical swimming speed [5/5Ucrit]) were conducted following a 1 hour acclimatization time where flow remained at 0 cm/s for 30 min and was increased to 5 and 10 cm/s at the 45 and 60 min mark. Testing followed incremental increases in flow speeds of 5 cm/s at 5 min intervals. Swimming performance trials tested prolonged swimming speeds using the Ucrit calculation (see below) for Bluegill, where Vp is the final flow velocity achieved by the specimen before fatigue. Vi corresponds to the velocity increase per time, while Tf and Ti are the final velocity increase and incremental time, respectively (Brett Citation1964; Wolter & Arlinghaus Citation2003):
For this experiment, fatigue was defined as a state in which the specimen becomes unable to maintain its position within the chamber followed by impingement with the downstream screen. Swimming performance data will be analyzed using general descriptive statistics. General linear models (GLM) were used to explain significant effects of size, sex, and site on Ucrit swimming performance metrics for the subset of individuals tested from within the GLSM watershed. Specific Ucrit values (cm/s) were designated as independent response variables and body size, sex, and site were designated as dependent variables. All tests for significance corresponded with an alpha level of 0.05.
Results
A total of 336 individuals were collected from GLSM, as well as several tributaries and outflow locations (St Marys River, Beaver Creek, and Chickasaw Creek). Individuals ranged from 23 to 207 mm in total length and included a total of 189 females and 146 males. RWA retained 12 axes which explained a total of 95% of the morphological variability, weighed most heavily along the first 3 which explained 65% of morphological variation of Bluegill in the GLSM watershed area.
MANOVA (eta2) of RWA scores revealed significant differences in shape attributed to length (mm TL), sex (male vs female), and habitat (lentic vs lotic). Significant interactions between length × sex and length × habitat were also present in the MANOVA (; ). Among all individuals sampled, length was the primary variable explaining morphological variation while sex and interactions between length × sex and length × flow were secondary (; ).
Table 2. MANOVA results of relative warp analyses of all individuals collected from the GLSM watershed. Length is the primary predictor of morphology in Bluegill.
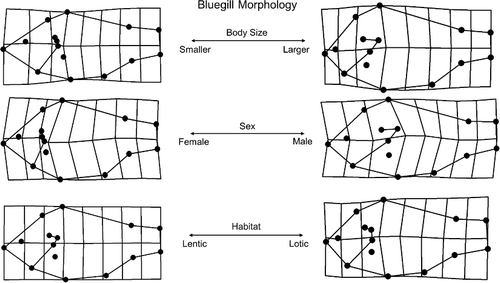
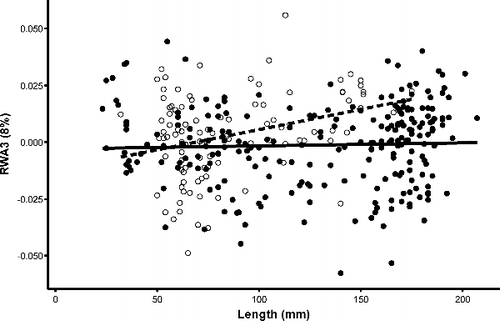
General linear mixed models (GLMM) were used to determine morphological variation and directionality attributed to length, sex, and habitat (i.e. flow) across the three primary axes (). In RWA1 (40%), gradients were consistent with shifts in body shape from more robust morphologies (i.e. pronounced nuchal humps and increased caudal-peduncle area; positive loading) to more streamlined counterparts (i.e. increased streamlining and decreased nuchal hump; negative loading; ). Among the variables tested in this model, length accounted for the largest amount of variation explained ( and ). More specifically, individuals developed a more robust morphology as body size increased. This relationship was also relevant relative to sex as an interaction between sex × length was also recovered. Morphological variation extracted from RWA2 (17%) evaluated length, sex, flow and interactions between length × flow using GLMM. Shifts from anterior (positive loading) to posterior (negative loading) placement and orientation of the operculum, pelvic, and pectoral fins were observed (). Such shifts were consistent with increasing size as larger individuals exhibited a more posterior placed operculum relative to smaller individuals. Among the variables tested, the interaction between length and sex as well as length × flow emerged as significant variables indicating differential responses between length and sex and habitat among individuals ( and –). Finally, shape variation retained in RWA3 (8%) evaluated length, sex, and flow (). Results therein indicated shifts in dorsal fin placement, body orientation, and reduction nuchal regions. More specifically, shifts were observed from increased nuchal regions (positive loading) to a posteriorly placed dorsal fin and upturned body orientation (negative loading; ). Along this third primary axis, flow, particularly the interaction with length emerged as the most significant predictors in morphological variation in RWA3 ().
Table 3. GLM results of relative warp analyses of all individuals collected from the GLSM watershed.
Figure 4. RWA for three primary axes which explained 65 percent of morphological variation in the GLSM watershed area, including significant relationships with parent terms as shown in general linear models.
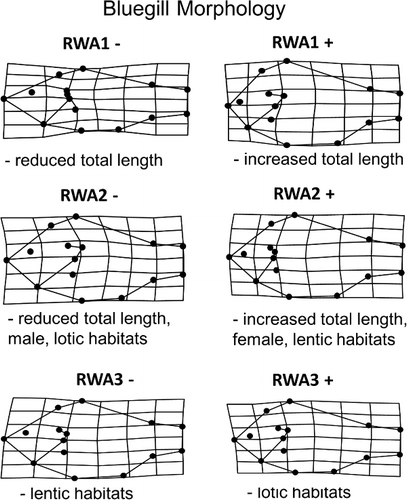
Figure 5. Scatterplot of RWA1 and RWA2 for both male and female individuals in the GLSM watershed. Closed circles indicate females and open circles indicate males.
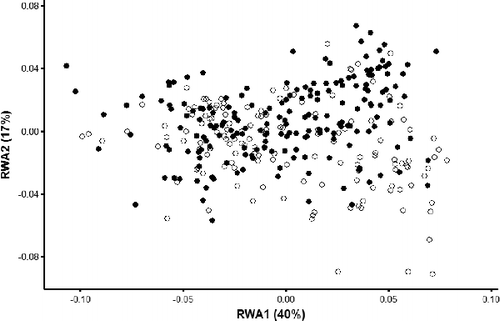
Figure 6. Scatterplot of RWA 1 and total length with regressions for Bluegill. Closed circles and solid regression line indicate females and open circles and dashed regression line indicate males.
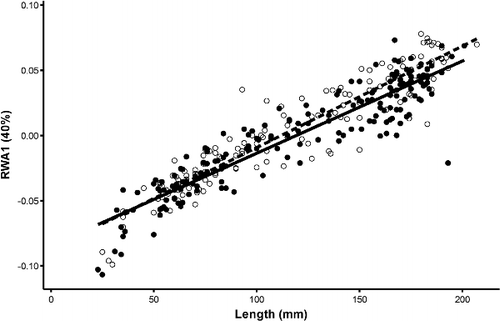
Figure 7. Scatterplot of RWA2 and total length (mm) with regressions for Bluegill individuals. Closed circles and solid regression line indicate females and open circles and dashed regression line indicate males.
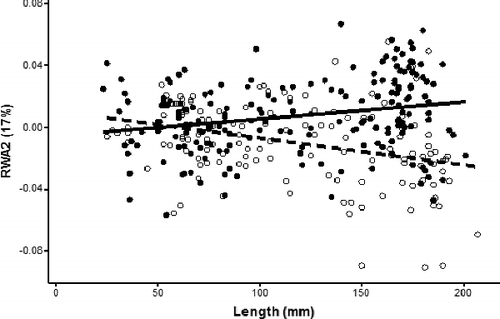
Figure 8. Scatterplot of RWA2 and total length (mm) with regressions for Bluegill individuals. Closed circles and solid regression line indicate individuals from lentic habitats and open circles and dashed regression line indicates individuals from lotic habitats.
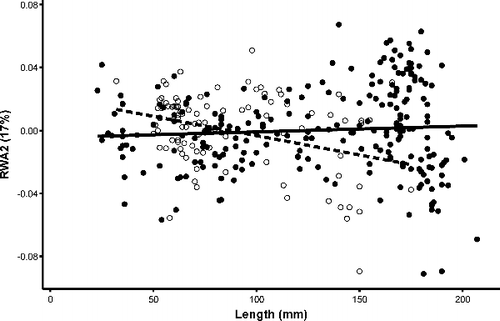
Figure 9. Scatterplot of RWA3 and total length (mm) with regressions for Bluegill individuals. Closed circles and solid regression line indicate individuals from lentic habitats and open circles and dashed regression line indicates individuals from lotic habitats.
To specifically quantify the potential effect of flow differences on swimming performance, a subset of 21 similarly sized individuals ranging from 95 to 164 cm total length were used to compare GLSM to St Marys River populations. One individual was found to be a non-performer (e.g. exhibited erratic or atypical behavior during swimming tests) and was excluded from subsequent analyses. GLMM were used to determine swimming performance variation attributed to size, sex, and habitat (GLSM; St Mary's River). Not surprisingly, given the specific size class used, fish size was found to be insignificant (p < 0.05). In addition to size, sex was also found to be an insignificant predictor of swimming performance (p < 0.05). However, habitat was found to be an overall indicator of swimming performance (Est = 5.9, SE = 2.4, t = 2.4, p = 0.03), where individuals from lotic sites (mean Ucrit 51.5 cm/s−1; SD Ucrit 9.7 cm/s−1) swam approximately 20% faster and exhibited less variation relative to those from the lentic site (mean Ucrit 39.6 cm/s−1; SD Ucrit 11.9 cm/s−1).
Discussion
This study provides strong support for morphological covariation with body size, sex, and habitat within a local area and contributes to existing ecomorphological research by using field collections to highlight these key corollaries and laboratory methods to identify functional effects and suggest mechanisms that may drive these patterns. By exploring the interactions between morphology, physiological, and environmental gradients, biologists can better predict mechanisms that influence both the morphology of organisms and their functional role in the ecosystem (Norton et al. Citation1995; Langerhans & Reznick Citation2010). Here, evidence is provided that body size is the primary contributing factor to morphological variation in Bluegill while sex and habitat are secondary. These results suggest that a combination of factors ranging from ontogeny, sex, and environment may drive variation in shape, likely as a result of selection for differences in diet, reproductive role, and flow regime of habitat.
Allometric growth is expected to covary with ontogenetic changes as few fish actually exhibit isometric patterns (Wainwright & Richard Citation1995). This is largely a reflection of resource use and physiological changes that coincide with life history (Wainwright Citation1996; Svanbäck & Ecklöv Citation2002). The analysis of body shape supports previous findings suggesting that Bluegill growth is not isometric and thus certain morphological characters do not grow proportionally to the rest of the body. Similar to other studies that have observed morphological allometry in Bluegill (Ehlinger Citation1991; Yokogawa Citation2013) individuals in this study were found to have developed a more robust morphology (i.e. pronounced nuchal hump, stouter/increased caudal peduncle area) coinciding with increasing size (i.e. age). Interestingly, several studies have identified key dietary shifts (zooplankton to benthic invertebrates) in Bluegill linked to trade-offs in prey selectivity between individuals of different age classes that occur at some point between 25 mm (Showalter et al. Citation2016) and 50 mm (Werner & Hall Citation1988). Other members of the genus Lepomis have also been shown to exhibit variation in body shape, including gill rakers and pharyngeal jaw morphology, in response to dietary variation (Hegrenes Citation2001). Linking the ontogenic variation in shape described in this study with past studies delving into dietary and morphological variation provides a unique explanation for mechanisms that can potentially explain shape variability among size classes. These functional variations likely extend to variation between male and female individuals or individuals from different microhabitats (Layzer & Clady Citation1987; Ehlinger Citation1990) as well. Building on this, one can also infer a degree of plasticity that may be present as Bluegill could potentially adjust or be selected for various morphologies. Thus, these ontogenic trends may be more broadly linked with aspects of optimal foraging theory, sexual selection, or phenotypic plasticity.
In addition to ontogenic variation, a high degree of sexual dimorphism was also detected among individuals. Variation in sexually dimorphic traits have been well documented in teleosts and have been related to feeding mechanism, color, mating system, behavior, and size traits (Newman Citation1907; Kodric-Brown Citation1990; Parker Citation1992; Kazancioğlu et al. Citation2009; Mcgee & Wainwright Citation2013). In this species, male bluegill exhibit increased growth rates and larger maximum size compared to females (Ehlinger Citation1997; Yokogawa Citation2013) which when coupled with ontogenic morphological variation, results in variation at particular age classes. Similar to other studies that have observed sexual variation in Bluegill morphology (Ehlinger Citation1991; Colborne et al. Citation2011; Yokogawa Citation2013), male individuals in this study (while controlling for body size) were found to have developed increased dorsal height and overall streamlining relative to the more ventrally deeper bodied females. This difference was found to be highly size dependent and divergence between male and female body shapes did not occur until approximately 100 mm in length. It seems probable that this major difference is a result of female biased sexual sized dimorphism where selection has targeted phenotypic traits that contribute to female body size and by relation correlate to increased fecundity. These trends may also suggest that alternative reproductive strategies could be functionally supported in Bluegill (Gross & Charnov Citation1980; Gross Citation1991; Ehlinger et al. Citation1997)). Alternative reproductive strategies (e.g. sneaker males) have likely evolved in competitive systems and as a result, given the smaller sizes and shape relationship present, a complete generalization of male and female Bluegill shape may be problematic (Colborne et al. Citation2011). Future work in this area should focus on the identification and inclusion of individuals exhibiting alternative life history strategies into morphological analyses at this scale.
Finally, this study indicated significant habitat-specific variations in Bluegill morphology where lotic ecosystems yielded shallow bodied individuals and lentic ecosystems yielded deeper bodied individuals. Past research in Bluegill has indicated microhabitat level variation that has been tied primarily to prey selection, predation avoidance, and/or competition (Werner & Hall Citation1977; Layzer & Clady Citation1987; Ehlinger Citation1990; Wilson et al. Citation1996). Beyond Bluegill, morphological variation attributed to habitat type often corresponds to resource use and has been well documented in freshwater fishes (Svanbäck & Ecklöv Citation2002; Langerhans et al. Citation2003; Franssen Citation2011; Santos & Araújo Citation2014). In this study, fish collected from lotic ecosystems experienced greater flow velocities and variation in both physical and chemical habitat parameters relative to the deeper bodied fish from lentic ecosystems. To further investigate potential mechanisms which could explain this pattern and given the paucity of swimming performance studies on Lepomis, laboratory swimming performance tests were conducted on individuals from lotic and lentic sites. Past works have investigated factors influencing swimming performance in other taxa and have centered on both fish morphology as well as aspects of locomotor ability (Videler Citation1993; Blake Citation2004). Both of which are intimately linked through a general morphology, swimming performance, and fitness paradigm. As part of this system, the evolution of swimming performance is investigated at the lower level (i.e. fish morphology), while also considering the potential impact of an organisms shape or abilities on higher levels (i.e. fitness; Arnold Citation1983). Our analysis of swimming performance support prior findings in other taxonomic groups which suggest that individuals with streamlined morphologies display increased locomotor abilities favoring steady swimming in flow (Langerhans et al. Citation2003). Notwithstanding the role of other selective agents, the evolution of swimming performance does not occur independently of other adaptations and other factors influencing locomotor abilities – albeit evolutionary or ecological – may interact with one another influencing responses to selection (Langerhans & Reznick Citation2010). Similar analyses posit that such mechanisms may serve as a priori predictors of morphological variation and, by extension, swimming performance in fishes, a task which becomes particularly important in the face of widespread landscape alterations (Langerhans et al. Citation2007; La Croix et al. Citation2011).
The environmental and genetic variation that underlie morphological variation between organisms at the individual and population level have been fundamentally linked to trade-offs in swimming performance (Gerry et al. Citation2012), predator –prey dynamics (Brőnmark & Miner Citation1992; Langerhans & Makowics Citation2009), and foraging efficiency (Svanbäck & Ecklöv Citation2002). Morphological variation observed in Bluegill within the GLSM watershed area can be attributed to a number of mechanisms. Here, it is shown that body size, and by relation ontogenetic growth, is a primary factor in driving morphological variation. Other mechanisms, namely genetic components, are known to contribute to morphological variation at the population level (Lee et al. Citation2015). While there is no genetic evidence included in this study, it seems likely that this mechanism would be secondary to plasticity given the lack of physical barriers to gene flow present between sites.
Ecomorphological research posits that morphological patterns reflect differences in functional mechanisms where variation is detected in physiology, environment, or diet composition and covaries with body size (Norton et al. Citation1995; Hüssy et al. Citation2012). Further work is necessary to investigate other mechanisms driving morphological variations described in the present study. While a growing base of ecomorphological literature provides evidence of other causal mechanisms, further work is needed to identify an underlying factor which accounts for between-habitat morphological variation. The current study as well as other studies moving to quantify such responses can prove useful to natural resource managers as well as conservation workers. More specifically, such experiments may serve as a priori predictors for morphological variation – a task which becomes particularly important in the face of widespread landscape alterations. Though landscape alterations, specifically those that alter flow regimes, are certain, modifications and restoration strategies which will better maintain the biological integrity should be implemented. Morphological analyses allow biologists to assess the implications associated with structures that impact our natural resources, and in doing so, provide a way to better predict ecological communities in the face of variation in habitat.
Acknowledgments
This research project was undertaken in the Spring of 2015 and 2016 as part of ongoing ecological research on the GLSM watershed. This research was completed in partial fulfillment of the requirements for the M.Sc. degree (A. Bell 2016) from Wright State University. Special thanks go to both undergraduate technicians and graduate students who assisted in the project, including Cara Schemmel, Austin Smith, Stephen Huelsman, and Mandy Salminen, as well as the following faculty members who assisted as graduate committee members, Yvonne Vadeboncoeur and Thomas Rooney. In addition, thank you to Robert Miltner (Ohio EPA) for providing long-term GLSM fish assemblage and chemical data.
Disclosure statement
No potential conflict of interest was reported by the authors.
Additional information
Funding
Notes on contributors
Anthony J. Bell
Anthony J. Bell Jr received his BA (Environmental Sciences) from Thomas Moore College (2013) and his MSc (Biology) from Wright State University (2016). His primary research interests include the study, management, and conservation of freshwater fishes.
Stephen J. Jacquemin
Stephen J. Jacquemin received his BSc (Biology and Environmental Studies) from Ohio Northern University (2008) and MSc and PhD (Biology and Environmental Sciences) from Ball State University (2013). He is currently an Associate Professor of Biology at Wright State University – Lake Campus. His research interests include the study of temporal and spatial patterns in North American fish assemblages, ecomorphology, environments, and conservation.
References
- Alexander HJ, Taylor JS, Wu SSÄ, Breden F. 2006. Parallel evolution and vicariance in the guppy (Poecilia reticulata) over multiple spatial and temporal scales. Evolution. 60:2352–2369.
- Arnold SJ. 1983. Morphology, performance and fitness. Am Zool. 23:347–361.
- Bartoli A, Pizarro D, Loog M. 2013. Stratified generalized procrustes analysis. Int J Comput Vis. 101:227–253.
- Blake RW. 2004. Fish functional design and swimming performance. J Fish Biol. 65:1193–1222.
- Brett JR. 1964. The respiratory metabolism and swimming performance of young sockeye salmon. J Fish Res Board Can. 21:1183–1226.
- Brőnmark C, Miner JG. 1992. Predator-induced phenotypical change in body morphology in crucian carp. Science. 258:1348–1350.
- Cho J, Lee M, Choi C, Oh S. 2013. Em-Gpa: generalized procrustes analysis with hidden variables for 3D shape modeling. Comput Vis Image Underst. 117:1549–1559.
- Clark CF. 1960. Lake St. Marys and its management. Columbus (OH): Ohio Department of Natural Resources. Division of Wildlife.
- Colborne SF, Bellemare MC, Peres-Neto PR, Neff BD. 2011. Morphological and swim performance variation among reproductive tactics of bluegill sunfish (Lepomis macrochirus). Can J Fish Aquat Sci. 68:1802–1810.
- Davenport T., Drake W. 2011. Grand Lake St. Marys, Ohio – The case for source water protection: nutrients and algae blooms. Lakeline Mag. 31:41–46.
- Delacour J. 1959. The waterfowl of the world. Vol. 3. London: Country Life Ltd.
- Delacour J, Mayr E. 1945. The family Anatidae. Wilson Bull. 57:3–55.
- Demayo CG, Rico MJ, Torres MJ. 2013. Relative warp analysis of variations in the fore-and hindwings of selected populations of male Neurothemis terminata terminata (ris, 1911). Sci Int. 25:277–284.
- Dhuyvetter H, Maelfait J, Desender K. 2007. Inter- and intraspecific genetic and morphological variation in a sibling pair of carabid species. Saline Syst. 3:4.
- Dumouchelle DH, Stelzer EA. 2014. Chemical and biological quality of water in Grand Lake St. Marys, Ohio, 2011-12, with emphasis on cyanobacteria. US Geological Survey Scientific Investigations Report 2014-5210.
- Ehlinger TJ. 1990. Habitat choice and phenotype-limited feeding efficiency in bluegill: individual differences and trophic polymorphism. Ecology. 71:886–896.
- Ehlinger TJ. 1991. Allometry and analysis of morphometric variation in the Bluegill, Lepomis macrochirus. Copeia. 1991:347–357.
- Ehlinger TJ. 1997. Male reproductive competition and sex-specific growth patterns in bluegill. N Am J Fish Manag. 17:508–515.
- Ehlinger TJ, Gross MR, Philipp DP. 1997. Morphological and growth rate differences between Bluegill males of alternative reproductive life histories. N Am J Fish Manag. 17:533–542.
- Felsenstein J. 1976. The theoretical population genetics of variable selection and migration. Ann Rev Genet. 10:253–280.
- Filbrun JE, Conroy JD, Culver DA. 2013. Understanding seasonal phosphorus dynamics to guide effective management of shallow, hypereutrophic Grand Lake St. Marys, Ohio. Lake Reserv Manag. 29:165–178.
- Franssen NR. 2011. Anthropogenic habitat alteration induces rapid morphological divergence in a native stream fish. Evol Appl. 4:791–804.
- Gaston KA, Jacquemin SJ, Lauer TE. 2013. The influence of preservation on fish morphology in museum collections based on two species of the genus Lepomis (Actinopterygii: Perciformes: Centrarchidae). Acta Ichtyol Pisc. 43:219–227.
- Gaston KA, Lauer TE. 2015. Morphometric variation in bluegill Lepomis macrochirus and green sunfish Lepomis cyanellus in lentic and lotic systems. J Fish Biol. 86:317–332.
- Gerry SP, Robbins A, Ellerby DJ. 2012. Variation in fast-start performance within a population of polyphenic bluegill (Lepomis macrochirus). Physiol Biochem Zool. 85:694–703.
- Godin JJ, Briggs SE. 1996. Female mate choice under predation risk in the guppy. Anim Behav. 51:117–130.
- Green SJ, Côté IM. 2014. Trait-based diet selection: prey behaviour and morphology predict vulnerability to predation in reef fish communities. J Anim Ecol. 83:1451–1460.
- Gross MR. 1991. Evolution of alternative reproductive strategies: Frequency-dependent sexual selection in male bluegill sunfish. Philos Trans R Soc Lond B. 1262:59–63.
- Gross MR, Charnov EL. 1980. Alternative male life histories in bluegill sunfish. Proc Natl Acad Sci USA. 77:6937–6940.
- Hegrenes S. 2001. Diet-induced phenotypic plasticity of feeding morphology in the orangespotted sunfish, Lepomis humilis. Ecol Freshw Fish. 10:35–42.
- Hendry AP, Kelly ML, Kinnison MT, Reznick DN. 2006. Parallel evolution of the sexes? Effects of predation and habitat features on the size and shape of wild guppies. J Evol Biol. 19:741–754.
- Hjelm J, Svanback R, Bystrom P, Persson L, Wahlstrom E. 2001. Diet-dependent body morphology and ontogenetic reaction norms in Eurasian perch. Oikos. 95:311–323.
- Ho DE, Imai K, King G, Stuart EA. 2007. Matching as nonparametric preprocessing for reducing model dependence in parametric causal inference. Political Anal. 15:199–236.
- Hollander J, Collyer ML, Adams DC, Johannesson K. 2006. Phenotypic plasticity in two marine snails: constraints superseding life-history. J Evol Biol. 19:1861–1872.
- Hoorman J, Iles J, Islam KR, Dirksen T, Hone T, Sudman TJ. 2008. Agricultural impacts on lake and stream water quality in Grand Lake St. Marys, western Ohio. Water Air Soil Pollut. 193:309–322.
- Hüssy K, Coad JO, Farrell ED, Clausen LW, Clarke MW. 2012. Sexual dimorphism in size, age, maturation, and growth characteristics of boarfish (Capros aper) in the Northeast Atlantic. ICES J Mar Sci. 69:1729–1735.
- Jackson DA. 2002. Ecological effects of Micropterus introductions: the dark side of black bass. In: Phillip DP, Ridgway MS, editors. Black bass: ecology, conservation, and management. Bethesda (MD): American Fisheries Society; p. 221–232.
- Jacquemin S, Pyron M. 2013. Effects of allometry, sex, and river location on morphological variation of freshwater drum Aplodinotus grunniens in the Wabash River, USA. Copeia. 740–749.
- Kazancioğlu E, Near TJ, Hanel R, Wainwright PC. 2009. Influence of sexual selection and feeding functional morphology on diversification rate of parrotfishes (Scaridae). Proc Biol Sci. 276:3439–3446.
- Klingenberg CP. 2015. Analyzing fluctuating asymmetry with geometric morphometrics: concepts, methods, and applications. Symmetry. 7:843–934.
- Kodric-Brown A. 1990. Mechanisms of sexual selection: insights from fishes. Ann Zool Fenn. 27:87–100.
- La Croix S, Zelditch ML, Shivik JA, Lundrigan BL, Holekamp KE. 2011. Ontogeny of feeding performance and biomechanics in coyotes. J Zool. 285:301–315.
- Langerhans RB, Layman CA, Langerhans AK, Dewitt TJ. 2003. Habitat-associated morphological divergence in two Neotropical fish species. Biol J Linn Soc. 80:689–698.
- Langerhans RB, Chapman LJ, Dewitt TJ. 2007. Complex phenotype–environment associations revealed in an East African cyprinid. J Evol Biol. 20:1171–1181.
- Langerhans RB. 2008. Predictability of phenotypic differentiation across flow regimes in fishes. Integr Comp Biol. 48:750–768.
- Langerhans RB, Makowicz AM. 2009. Shared and unique features of morphological differentiation between predator regimes in Gambusia caymanensis. J Evol Biol. 22:2231–2242.
- Langerhans RB, Reznick DN. 2010. Ecology and evolution of swimming performance in fishes: predicting evolution with biomechanics. In: Domenici P, Kapoor BG, editors. Fish locomotion: an etho-ecological perspective. Enfield: Science Publishers; p. 200–248.
- Layzer JB, Clady MD. 1987. Phenotypic variation of young-of-year Bluegills (Lepomis macrochirus) among microhabitats. Copeia. 702–707.
- Law T, Blake R. 1996. Comparison of the fast-start performances of closely related, morphologically distinct threespine sticklebacks (Gasterosteus spp.) J Exp Biol. 199:2595–2604.
- Lee HJ, Heim V, Meyer A. 2015. Genetic and environmental effects on the morphological asymmetry in the scale-eating cichlid fish, Perissodus microlepis. Ecol Evol. 5:4277–4286.
- Masagounder K, Hayward RS, Firman JD. 2014. Replacing fish meal with increasing levels of meat and bone meal, soybean meal and corn gluten meal, in diets of juvenile bluegill, Lepomis macrochirus. Aquac Res. 45:1202–1211.
- Mayer C, Metscher BD, Müller GB, Mitteroecker P. 2014. Studying developmental variation with geometric morphometric image analysis (GMIA). PLoS One. 9:1–16.
- McGee MD, Wainwright PC. 2013. Sexual dimorphism in the feeding kinematics of threespine stickleback. J Exp Biol. 216:835–840.
- Neves MP, Delariva RL, Guimarães AB, Sanches PV. 2015. Carnivory during ontogeny of the plagioscion squamosissimus: A successful non-native fish in a lentic environment of the upper paraná river basin. PLoS One. 10:1–15.
- Newman HH. 1907. Spawning behavior and sexual dimorphism in Fundulus heteroclitus and allied fish (Contributions from the Zoölogical Laboratories of the University of Michigan no. 108). Biol Bull. 12:314–348.
- Norton SF, Luczkovich JL, Motta PJ. 1995. The role of ecomorphological studies in the comparative biology of fishes. Environ Biol Fishes. 44:287–304.
- Pakkasmaa S, Piironen J. 2000. Water velocity shapes juvenile salmonids. Evol Ecol. 14:721–730.
- Parenti LR, Grier HJ. 2004. Evolution and phylogeny of gonad morphology in bony fishes1. Integr Comp Biol. 44:333–348.
- Parker GA. 1992. The evolution of sexual size dimorphism in fish. J Fish Biol. 41:1–20.
- Partridge C, Rodgers CMC, Knapp R, Neff BD. 2015. Androgen effects on immune gene expression during parental care in bluegill sunfish (Lepomis macrochirus). Can J Zool. 93:9–13.
- Requieron EA, Torres MA, Demayo CG. 2012. Applications of relative warp analysis in describing of scale shape morphology between sexes of the snakehead fish Channa striata. Int J Ecol Environ Sci. 1:205–209.
- Reznick DN. 1982. The impact of predation on life history evolution in Trinidadian guppies: genetic basis of observed life history patterns. Evolution. 36:1236–1250.
- Rohlf FJ. 2001. tpsDig—thin plate spline digitizer, version 2.11. New York (NY): State University of New York at Stony Brook.
- Rohlf FJ. 2004. tpsUtil, file utility program, version 1.26. New York (NY): State University of New York at Stony Brook.
- Rohlf FJ. 2015. tpsRelw—relative warp analysis, version 1.60. New York (NY): State University of New York at Stony Brook.
- Rohlf FJ. 2016. tpsRegr—regression, version 1.43. New York (NY): State University of New York at Stony Brook.
- Santos A, Araújo F. 2014. Evidence of morphological differences between Astyanax bimaculatus (Actinopterygii: Characidae) from reaches above and below dams on a tropical river. Environ Biol Fishes. 98:183–191.
- Shine R. 1989. Ecological causes for the evolution of sexual dimorphism: a review of the evidence. Q Rev Biol. 64:419–461.
- Showalter AM, Vanni MJ, González MJ. 2016. Ontogenic diet shifts produce trade-offs in elemental imbalance in bluegill sunfish. Freshw Biol. 61:800–813.
- Shuker DM. 2012. Review of getting started with R: an introduction for biologists, data analysis with R statistical software. A guidebook for scientists and discovering statistics using R. Anim Behav. 84:1597–1600.
- Spotte S. 2007. Bluegills: biology and behavior. Bethesda (MD): American Fisheries Society.
- Svanbäck R, Ecklöv P. 2002. Effects of habitat and food resources on morphology and ontogenetic growth trajectories in perch. Oecol. 31:61–70.
- Svensson I, Berglund A, Rosenqvist G. 1986. Mate choice, fecundity and sexual dimorphism in two pipefish species (Syngnathidae). Behav Ecol Sociobiol. 19:301–307.
- Taguchi T, Miura Y, Krueger D, Sugiura S. 2014. Utilizing stomach content and faecal DNA analysis techniques to assess the feeding behaviour of largemouth bass Micropterus salmoides and bluegill Lepomis macrochirus. J Fish Biol. 84:1271–1288.
- Verheyen R. 1953. Contribution a l'osteologie et a la systematique des Anseriformes. Gerfaut. 43:457–497.
- Videler JJ. 1993. Fish swimming. London: Chapman and Hall.
- Wainwright PC. 1996. Ecological explanation through functional morphology: The feeding biology of sunfishes. Ecology. 77:1336–1343.
- Wainwright PC, Richard BA. 1995. Predicting patterns of prey use from morphology of fishes. Environ Biol Fishes. 44:97–113.
- Werner EE, Hall DJ. 1977. Competition and habitat shift in two sunfishes (Centrarchidae). Ecology. 58:869–876.
- Werner EE, Hall DJ. 1988. Ontogenetic habitat shifts in bluegill: the foraging rate-predation risk trade-off. Ecology. 69:1352–1366.
- Wilson DS, Muzzall PM, Ehlinger TJ. 1996. Parasites, morphology, and habitat use in a bluegill sunfish (Lepomis macrochirus) population. Copeia. 1996:348–354.
- Wolter C, Arlinghaus R. 2003. Navigation impacts on freshwater fish assemblages, the ecological relevance of swimming performance. Rev Fish Biol Fish. 13:63–89.
- Yokogawa K. 2009. Changes in lengths of body portions and body weight by fixation with 10% formalin in Largemouth Bass, Micropterus salmoides, and Bluegill, Lepomis macrochirus. Biogeography. 11:153–161.
- Yokogawa K. 2013. Morphological variations in bluegill, Lepomis macrochirus, with particular emphasis on growth-related changes. Ichthyol Res. 60:48–61.
- Zimmerman MS. 2007. A field study of brook stickleback morphology: multiple predators and multiple traits. Can J Zool. 85:250–260.

