
ABSTRACT
Although cyanobacterial blooms can change microbial communities, it is still unclear what impact such harmful blooms will have on denitrifying bacteria, the drivers of the removal of excessive nitrogen from water. In order to clarify the impact, populations of denitrifying bacteria, with periodic proliferation and dominance of cyanobacteria in a eutrophic shallow lake located in southeast China, were investigated using quantitative real-time polymerase chain reaction (qPCR) and 454-pyrosequencing based on the copper-containing nitrite reductase (nirK) gene, cytochrome cd1-containing nitrite reductase (nirS) gene and nitrous oxide reductase (nosZ) gene. Samples were collected periodically during a three-month period when the cyanobacterial density gradually increased. In the qPCR analyses, abundances of nirK, nirS and nosZ were intensely positively correlated with the biomass of cyanobacteria. Moreover, 454-pyrosequencing revealed that the community composition of denitrifying bacteria shifted with the increase in cyanobacterial density. These results indicated that the shifts of the community composition of denitrifying bacteria might be related to cyanobacterial blooms, which could potentially lead to alterations of denitrification in eutrophic water.
Introduction
Excessive nitrogen and phosphorus input associated with urban, agricultural and industrial development have accelerated the rate of eutrophication. This accelerated rate favors the periodic proliferation and dominance of cyanobacteria in various aquatic ecosystems (Eiler & Bertilsson Citation2004; Dziallas & Grossart Citation2011), posing a great threat to the sustainability of water quality and ecology (Paerl & Huisman Citation2009). China has the largest subtropical lake density in the Northern Hemisphere (Downing et al. Citation2006). All together there are 698 subtropical shallow lakes (>1 km2) in China, mainly located along the Yangtze River (Yang et al. Citation2010). Due to the rapid development of this area, 85.9% of these lakes are currently eutrophic or hypereutrophic (Jin et al. Citation2005).
Great quantities of heterotrophic bacteria thrive within a special microenvironment defined as the ‘phycosphere’, which is closely related to algal functions (photosynthesis, respiration, excretions, etc.). Moreover, the intense ecological interactions between cyanobacteria and bacteria have commonly been observed (Eiler & Bertilsson Citation2004; Woodhouse et al. Citation2012; Bagatini et al. Citation2014). As is well known, many heterotrophic bacteria can perform denitrification, which is widely accepted as the major pathway for removing excess nitrogen from water (Chen et al. Citation2012).
However, it is still unclear what impact cyanobacterial blooms have on denitrifying bacteria. On one hand, it is reasonable to expect that cyanobacterial blooms could enhance the growth of denitrifying bacteria because cyanobacteria excrete an abundance of extracellular organic matter in the phycosphere to provide energy for the associated heterotrophic bacteria (Worm & Søndergaard Citation1998). Moreover, the aggregates of cyanobacteria could provide the necessary anaerobic environment for denitrifying bacteria and denitrification (Ploug et al. Citation1997). On the other hand, it is also possible that cyanobacterial blooms would have negative effects on denitrifying bacteria because the exudates from the cyanobacteria, such as phenols, peptides, alkaloids or terpenoids, can inhibit bacterial growth (Casamatta & Wickstrom Citation2000; Mundt et al. Citation2001; Valdor & Aboal Citation2007) and the oxygen produced in the process of photosynthesis can also play a negative role. If the growth of the denitrifying bacteria is inhibited, then more nitrogen would be reserved, leading to more cyanobacteria.
In order to clarify the impact of cyanobacterial blooms on denitrifying bacteria, we monitored the changes in the abundance and community composition of denitrifying bacteria during cyanobacterial blooms in a eutrophic lake in southeast China with periodic proliferation and dominance of cyanobacteria. As 16S rDNA sequencing is insufficient to explore specific functional bacterial populations, we elected to use nirK, nirS and nosZ amplicon sequencing combined with quantitative real-time PCR to study the abundance, diversity and community composition of denitrifying bacteria. The results provide valuable information regarding the impact of cyanobacterial blooms on denitrifying bacteria and denitrification.
Methods
Sampling site and sample collection
A eutrophic shallow lake was selected to study the dynamics of denitrifying bacteria under the influence of cyanobacterial blooms. The lake is near the Yangtze River (32°02′21″ N, 118°52′37″ E), Nanjing, China (). Nanjing is located at the subtropical climate zone of China. The lake (∼ 6 × 10⁵ m2 in area and ∼1.6 m in mean depth) has seasonal variation of water temperatures from ∼5 °C in winter up to nearly 33 °C in summer. The isobath interval is 100 cm. The lake suffers from domestic wastewater pollution and cyanobacteria bloom each year. For this lake, an investigation of phytoplankton composition in this eutrophic lake had been carried out with Algacount S300 (Shineso, China). Cyanobacteria were the absolutely dominant phytoplankton (86.1%–92.3% of total phytoplankton from May to July), and Microcystis aeruginosa, which were the most common cyanobacterial species in the basin of Lake Taihu in southeast China (Chen et al. Citation2003; Duan et al. Citation2009), account for 62.6%–89.1% of total phytoplankton. In China, such shallow lakes are commonly used for field irrigation. The sampling sites are labeled in .
Figure 1. Sketch of the sampling sites located in the eutrophic lake. The closed curves were isobaths (in centimeter), and the isobath interval is 100 cm.
The surface water samples (0.3 m depth) were collected using a JC-800 organic glass hydrophore (Juchuang, China) on three successive days in May (20, 21 and 22), June (18, 19 and 20) and July (29, 30 and 31) in 2015, when a gradual increase in the cyanobacterial density was observed. Water samples (2 L) were collected from sites A, B and C, mixed together with a stirrer, and then 1 L of mixed water was pumped into glass bottles. The bottles were kept in an ice box (∼4 °C) and immediately sent back to the laboratory for analysis of the physicochemical parameters and DNA extraction. The samples collected in three successive days of each month were the three replicates, which represented the different months. The temperature, dissolved oxygen (DO) and pH were measured in situ (Yellow Spring Instruments, YSI, 6600, USA). The water samples were transported to the lab in an ice box and were then used for the following analyses.
Analysis of the physicochemical parameters of the water samples
The analysis of NH4+, NO3−, NO2−, total phosphate (TP), total organic carbon (TOC) and chl a levels was performed following the methods described by Gao et al. (Citation2016). Briefly, 300 mL water was filtered (0.45 μm pore size) for the analysis of concentration of dissolved NH4+, NO3− and NO2−; 10 mL water was directly used to test TP; TOC was analyzed using a vario TOC instrument (Elementar, Germany); 100 mL water was centrifuged at 3000 G, and then the concentrated algae were used for analysis of chl a concentration.
DNA extraction, amplification, pyrosequencing and quantitative real-time PCR
Before DNA extraction, the water samples (May 20, 21 and 22; June 18, 19 and 20; and July 29, 30 and 31) were stirred with a magnetic stirring apparatus for 10 min separately. After that, 0.1 L water samples were filtered with a filtration apparatus (0.22 μm pore size of mixed cellulose membrane, 0.06–0.1Mpa, 5 min), the filter membranes were stored at −80 °C. When used, all the filter membranes were cut into pieces with sterile scissors and used immediately for DNA extraction. The total genomic DNA extraction was carried out using an UltraClean water DNA Kit according to the manufacturer's instructions (MoBio, USA). The chosen primer sets for qPCR and 454-pyrosequencing are shown in Table S1. For information on the reliability of these primers, see discussion by Throbäck et al. (Citation2004). Briefly, amplification and sequencing were performed as follows. For the copper-containing nitrite reductase (nirK) gene, cytochrome cd1-containing nitrite reductase (nirS) gene and nitrous oxide reductase (nosZ) gene, the reaction mix (20 μL) contained 2.00 μL of dNTPs (2.5 mM), 2 μL of template DNA (2 ng), 5.00 μL of 5 × Q5 Buffer (NEB, USA), 5.00 μL of 5 × GC Enhancer (NEB, USA), 1 μL of (10 μM) of each primer, 0.5 μL of Q5 DNA polymerase (NEB, USA) and 4.5 μL ultrapure water. A thermal PCR cycler (Takara, Japan) was used to carry out the amplification. 98 °C for 5 min for denaturation; 38 cycles of 98 °C for 30 s, 50 °C for 40 s and 72 °C for 60 s; at last 72 °C for 7 min. The PCR Clean-Up kit (MoBio, USA) was used to purify the PCR products, and then the PicoGreen reagent (Invitrogen, USA) was used to quantify dsDNA with an ND3300 Fluorospectrometer (NanoDrop Technologies, USA). Finally, Roche 454 (GS FLX Titanium System) was used to carry out the pyrosequencing. The abundance of nirK, nirS and nosZ were quantified by the method described by Yi et al. (Citation2014). Briefly, the qPCR amplification of nirK gene was carried out with an initial denaturation at 95 °C for 2 min, followed by 35 cycles consisting of denaturation step at 94 °C for 5 s, annealing at 58 °C for 30 s and elongation at 72 °C for 30 s. The qPCR amplification of nirS and nosZ was performed as follows: initial denaturation at 95 °C for 2 min, followed by 35 cycles consisting of denaturation step at 95 °C for 5 s, annealing at 54 °C for 30 s and elongation at 72 °C for 30 s. Data was analyzed using the ABI 7500 software (Version 2.0.6, Life Technologies, USA).
Data analysis
The method used to screen the high-quality nucleotide sequences of three denitrifying genes followed that reported by Zeleke et al. (Citation2013). The high-quality nucleotide sequences were used for operational taxonomic units (OTU)-based analyses. 97% sequence identity cut-offs were used to define OTUs. The R software was used for drawing rarefaction curves. Alpha richness indices (Chao1 and ACE) were calculated using QIIME software. The significant difference analysis (Student's t test) between the different months, which was based on the Alpha index Chao1 and ACE, was also carried out by R software. The representative inferred amino acid sequence of each OTU was selected to blast the most closely-related amino acid sequence in the UniProt Knowledgebase (UniProtKB) using HMMER web server, then the phylogenetic trees of the top 20 OTUs were constructed, corresponding to nirK, nirS and nosZ.
Nucleotide sequence accession numbers
The partial nirK, nirS and nosZ sequences used in this study were deposited in the NCBI GenBank Short Read Archive under accession number SRP076361.
Results
Characteristics of the water samples
The characteristics of the water samples are shown in . The temperature increased from 28 to 33 °C. The concentration of chl a increased from 0.098 to 0.322 mg/L. The DO (11.92 to 12.88 mg/L) and pH (9.01 to 9.31) were maintained at high levels but showed no statistically significant differences among May (20, 21 and 22), June (18, 19 and 20) and July (29, 30 and 31) in this study. The concentration of ammonium (1.85 to 2.1 mg NH4+ /L), nitrate (1.12 to 1.31 mg NO3− /L), nitrite (0.36 to 0.38 mg NO2− /L), TP (1.52 to 1.61 mg PO43- /L) and TOC (19.36 to 22.09 mg/L) also showed no statistically significant differences (p > 0.05) among May (20, 21 and 22), June (18, 19 and 20) and July (29, 30 and 31) in this study.
Figure 2. Characteristics of the water samples. The error bars are the standard deviations calculated from three different samples which sampled in consecutive days of each month (May 20, 21 and 22; June 18, 19 and 20; July 29, 30 and 31).
Abundances of the nirK, nirS and nosZ genes
From May (20, 21 and 22) to July (29, 30 and 31), the mean copy numbers of nirK, nirS and nosZ in the water increased from 7.12 to 11.26 × 10⁴ copies/mL, 0.91 to 2.02 × 10⁷ copies/mL and 1.26 to 2.21 × 10⁴ copies/mL, respectively (). Among all the monitored abiotic factors, the abundances of nirK, nirS and nosZ were only significantly correlated with temperature (p < 0.05, R2 > 0.98). However, the abundances of all three denitrification-related genes were strongly correlated with the chl a concentrations (p < 0.05, R2 = 0.93, 0.86 and 0.84). Generally, the copy numbers of nirS were higher than those of nirK. The abundance of nosZ was the lowest compared to the other genes.
Figure 3. The abundance of nirK, nirS and nosZ genes in different month. The error bars are the standard deviations calculated from three different samples which sampled in consecutive days of each month (May 20, 21 and 22; June 18, 19 and 20; July 29, 30 and 31).
Community structure and diversity analysis of denitrifying bacteria
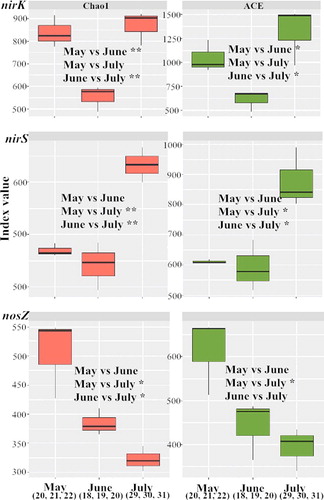
The raw sequences (containing some incorrect sequences, e.g. chimera) and filtered high-quality DNA sequences (after removal of the incorrect sequences) of the nirK, nirS and nosZ genes from samples collected at different sampling times are shown in Tables S2(a–c), and the high-quality sequences were retained for OTU-based analyses. Ninety-seven percent sequence similarity cut-offs were used for constructing rarefaction curves (Figure S1). The significant difference analysis (), which was based on the Alpha index Chao1 and ACE, indicated that the diversity of denitrifying bacteria changed with the month. For nirK, the bacterial diversities in May (20, 21 and 22) and July (29, 30 and 31) were more abundant than June (18, 19 and 20). For nirS, the bacterial diversity in July was more abundant than May (20, 21 and 22) and June (18, 19 and 20). For nosZ, the bacterial diversity in May was more abundant than July (29, 30 and 31).
Figure 4. The boxplots and the significant difference analysis which was based on the Alpha index Chao1 and ACE. **mean that there was an extremely significant difference with p < 0.01; *means that there was a significant difference with p < 0.05; no symbol means that there was no significant difference with values p > 0.05. The statistical test that was used to compare the indices is student's t test.
The top 20 OTUs accounted for 43.2, 48.4 and 51.3% of the total sequences for nirK, nirS and nosZ, respectively. The phylogenetic trees of the top 20 OTUs were constructed using the representative inferred amino acid sequences ((a–c)). For nirK, 17 OTUs were matched to uncultured denitrifying bacteria isolated from various environments, while 2 OTUs did not significantly match any of the sequences. OTU9 was very closely related (97.7%) to a nirK sequence from Ochrobactrum sp. OTU1, which accounted for 6.5% of the total sequences, and was closely related (92.1%) to a nirK sequence from an uncultured bacterium that was isolated from rice paddy soil in Tokyo, Japan. OTU2, which accounted for 6.2% of the total sequences, was also closely related (90.8%) to a nirK sequence from an uncultured bacterium that was isolated from sediments in a large urban eutrophic lake (Lake Donghu) in Wuhan, China.
Figure 5. (a–c) Phylogenetic trees of the top 20 OTUs for nirK (5a), nirS (5b) and nosZ (5c) genes respectively. Bootstrap values (%) are shown on the nodes. The similarity values and the accession numbers of the reference sequences are in front of each OTU, which were indicated in parentheses.
For nirS, 18 OTUs were matched to uncultured denitrifying bacteria isolated from different environments, while OTU2 and OTU14 were related (100.0% and 87.6%, respectively) to a nirS sequence from Prosthecomicrobium hirschii. OTU1, which accounted for 16.1% of the total sequences, was very closely related (100.0%) to a nirS sequence from an uncultured bacterium which was isolated from biological wastewater treatment systems of China. OTU2, which accounted for 5.5% of the total sequences, was closely related (100%) to a nirS sequence from Prosthecomicrobium hirschii.
For nosZ, 17 OTUs were matched to uncultured denitrifying bacteria isolated from various environments; OTU3 and OTU9 did not significantly match any sequence. OTU13 was closely related (90.5%) to a sequence from Magnetospirillum magnetotacticum. OTU1, which accounted for 9.9% of the total sequences, was very closely related (92.2%) to a sequence from an uncultured denitrifying bacterium isolated from a full-scale submerged biofilm reactor used for domestic wastewater treatment in El Jadida, Morocco. OTU2, which accounted for 4.9% of the total sequences, was related (71.5%) to a sequence from an uncultured denitrifying bacterium isolated from the gut contents of chironomid larvae in Denmark.
Except for the nosZ, the sequence reads for most of top 20 OTUs varied significantly in different months (Tables S3(a–c)), indicating that the abundance and structure of the dominant denitrifying bacterial community changed over time when cyanobacteria bloomed at different levels.
Discussion
Among all the monitored environmental factors, the abundances of nirK, nirS and nosZ were only significantly correlated with temperature. It has been generally believed that the biotic factors may be worthy of more attention than the abiotic factors (Woodhouse et al. Citation2016). In fact, the phytoplankton, emerged plants, floating plants, submerged macrophyte, etc. are closely related to bacteria, which not only provide the important habitats but also can affect the bacteria though photosynthesis, respiration, and secretions. In this study, the abundances of all three genes were found to be intensely positively correlated with the changes in the cyanobacterial biomass in different months. It is well known that the majority of denitrifying bacteria prefer an anaerobic environment. Cyanobacteria usually aggregate through the coagulation of extracellular polymeric substances and then form mucilaginous aggregates of different sizes (Xu et al. Citation2013). The mucilaginous sheath prevents gas exchange and provides a favorable anaerobic microenvironment (Ploug et al. Citation1997). Moreover, some secreted organic substances can also be utilized to provide energy for anaerobic denitrifying bacteria (Worm & Søndergaard Citation1998; Cai et al. Citation2014). Therefore, it was reasonable that the abundances of denitrifying bacteria were intensely positively correlated with the cyanobacterial concentration. This finding was consistent with the results showing that the abundances of the nirK and nirS genes were positively correlated with the cyanobacterial biomass in the Baltic Sea (Tuomainen et al. Citation2003).
It was interesting that except for nosZ, the sequence reads for most of top 20 OTUs varied significantly in different months (Table S4(a-c)), indicating that the abundance and the denitrifying bacterial community changed over time when cyanobacteria bloomed at different levels. In fact, the anaerobic microenvironment that is favorable for various denitrifying bacteria is also species-dependent (Robertson et al. Citation1988; Su et al. Citation2001; Kong et al. Citation2006). As the size and structure of the cyanobacterial aggregates vary during the cyanobacterial bloom (0.2 μm to >100 μm), different anaerobic levels within aggregates could be formed (Cai et al. Citation2014). Therefore, the specific denitrifying bacteria may be determined by the different anaerobic microenvironments. In addition, changes in the diversity and community of denitrifying bacteria may be induced by the bioactive organic substances secreted from cyanobacteria. Denitrifying bacteria consists of various species, which have different sensitivities to the bioactive organic substances. Therefore, it is possible that some specific denitrifying bacteria could be promoted or inhibited by certain substances, while others may be unaffected. This might be another reason for the results showing that the abundance and structure of denitrifying bacterial communities changed over time when the cyanobacteria bloomed at different levels.
Our results revealed that cyanobacterial blooms might increase the abundance of three denitrifying genes (nirS, nirK and nosZ). Moreover, it seems that cyanobacterial blooms might also alter the dominant community of denitrifying bacteria. These changes may lead to enhance or weaken in the denitrification of eutrophic water, the major pathway for removing excess nitrogen. This study provided considerable information about the changes in the abundance, diversity and community composition of denitrifying bacteria might be related to cyanobacterial blooms, which may provide insight into how harmful cyanobacterial blooms impact the nitrogen cycling in eutrophic freshwater.
TJFE_Suppl.docx
Download MS Word (124 KB)Acknowledgments
We thank American Journal experts (AJE) for editing English language.
Disclosure statement
All of the authors declare that they have no conflict of interest.
Additional information
Funding
Notes on contributors
Weiguo Zhang
Weiguo Zhang is an associate professor at the Institute of Agricultural Resources and Environment, Jiangsu Academy of Agricultural Sciences.
Yan Gao
Yan Gao is an associate professor at the Institute of Agricultural Resources and Environment, Jiangsu Academy of Agricultural Sciences.
Neng Yi
Neng Yi is an associate professor at the Institute of Agricultural Resources and Environment, Jiangsu Academy of Agricultural Sciences.
Chengcheng Wang
Chengcheng Wang is a PhD student at the Institute of Agricultural Resources and Environment, Jiangsu Academy of Agricultural Sciences.
Panpan Di
Panpan Di is a laboratory technician at the Institute of Agricultural Resources and Environment, Jiangsu Academy of Agricultural Sciences.
Shaohua Yan
Shaohua Yan is a professor at the Institute of Agricultural Resources and Environment, Jiangsu Academy of Agricultural Sciences.
References
- Bagatini IL, Eiler A, Bertilsson S, Klaveness D, Tessarolli LP, Vieira AAH. 2014. Host-Specificity and dynamics in bacterial communities associated with bloom-forming freshwater phytoplankton. Plos one. 9:1–13.
- Cai H, Jiang H, Krumholz LR, Yang Z. 2014. Bacterial community composition of size-fractioned aggregates within the phycosphere of cyanobacterial blooms in a eutrophic freshwater lake. Plos one. 9:e102879. doi:10.1371/journal.pone.0102879
- Casamatta DA, Wickstrom CE. 2000. Sensitivity of two disjunct bacterioplankton communities to exudates from the cyanobacterium Microcystis aeruginosa Kützing. Microb Ecol. 41:64–73.
- Chen X༌Yang L, Xiao L, Miao A, Xi B. 2012. Nitrogen removal by denitrification during cyanobacterial bloom in Lake Taihu. J Freshwater Ecol. 27:243–258.
- Chen Y, Qin B, Teubner K, Dokulil MT. 2003. Long-term dynamics of phytoplankton assemblages: Microcystis-domination in Lake Taihu, a large shallow lake in China. J Plankton Res. 25:445–453.
- Downing J, Prairie Y, Cole J, Duarte C, Tranvik L, Striegl R, McDowell W, Kortelainen P, Caraco N, Melack J. 2006. The global abundance and size distribution of lakes, ponds, and impoundments Limnol. Oceanogr. 51:2388–2397.
- Duan H, Ma R, Xu X, Kong F, Zhang S, Kong W, Hao J, Shang L. 2009. Two-decade reconstruction of algal blooms in China's Lake Taihu. Environ Sci Technol. 43:3522–3528.
- Dziallas C and Grossart HP. 2011. Temperature and biotic factors influence bacterial communities associated with the cyanobacterium Microcystis sp. Environ Microbio. 13:1632–1641.
- Eiler A, Bertilsson S. 2004. Composition of freshwater bacterial communities associated with cyanobacterial blooms in four Swedish lakes. Environ Microbio. 6:1228–1243.
- Gao Y, Zhang Z, Liu X, Yi N, Zhang L, Song W, Wang Y, Mazumderc A, Yan S. 2016. Seasonal and diurnal dynamics of physicochemical parameters and gas production in vertical water column of a eutrophic pond. Ecol Eng. 87:313–323.
- Jin X, Xu Q, Huang C. 2005. Current status and future tendency of lake eutrophication in China. Sci China Ser C Life Sci. 48:948–954.
- Kong QX, Wang XW, Jin M, Shen ZQ, Li JW. 2006. Development and application of a novel and effective screening method for aerobic denitrifying bacteria. Fems Microbiol Lett. 260:150–155.
- Mundt S, Kreitlow S, Nowotny A, Effmert U. 2001. Biochemical and pharmacological investigations of selected cyanobacteria. Int J Hyg Envir Heal. 203:327–334.
- Paerl HW, Huisman J. 2009. Climate change: a catalyst for global expansion of harmful cyanobacterial blooms. Env Microbiol Rep. 1:27–37.
- Ploug H, Kühl M, Buchholz-Cleven B, Jørgensen BB. 1997. Anoxic aggregates-anephemeral phenomenon in the pelagic environment. Aquat Microb Ecol. 13:285–294.
- Robertson LA, van Niel EW, Torremans RA, Kuenen JG. 1988. Simultaneous nitrification and denitrification in aerobic chemostat cultures of Thiosphaera pantotropha. Appl Environ Microb. 54:2812–2818.
- Su JJ, Liu BY, Chang YC. 2001. Identifying an interfering factor on chemical oxygen demand (COD) determination in piggery wastewater and eliminating the factor by an indigenous Pseudomonas stutzeri strain. Lett Appl Microbiol. 33:440–444.
- Throbäck IN, Enwall K, Jarvis Å, Hallin S. 2004. Reassessing PCR primers targeting nirS, nirK and nosZ genes for community surveys of denitrifying bacteria with DGGE. Fems Microbiol Ecol. 49:401–417.
- Tuomainen JM, Hietanen S, Kuparinen J, Martikainen PJ, Servomaa K. 2003. Baltic Sea cyanobacterial bloom contains denitrification and nitrification genes, but has negligible denitrification activity. FEMS Microbiol Ecol. 45:83–96.
- Valdor R, Aboal M. 2007. Effects of living cyanobacteria, cyanobacterial extracts and pure microcystins on growth and ultrastructure of microalgae and bacteria. Toxicon. 49:769–779.
- Woodhouse JN, Kinsela AS, Collins RN, Bowling LC, Honeyman GL, Holliday JK, Neilan BA. 2016. Microbial communities reflect temporal changes in cyanobacterial composition in a shallow ephemeral freshwater lake. ISME J. 10:1337–1351.
- Woodhouse JN, Ongley SE, Brown MV, Neilan BA. 2012. Microbial diversity and diazotrophy associated with the freshwater non-heterocyst forming cyanobacterium Lyngbya robusta. J Appl Phycol. 25:1039–1045.
- Worm J, Søndergaard M. 1998. Dynamics of heterotrophic bacteria attached to Microcystis spp. (Cyanobacteria). Aquat Microb Ecol. 14:19–28.
- Xu H, Cai H, Yu G, Jiang H. 2013. Insights into extracellular polymeric substances of cyanobacterium Microcystis aeruginosa using fractionation procedure and parallel factor analysis. Water Res. 47:2005–2014.
- Yang G, Ma R, Zhang L, Jiang J, Yao S, Zhang M, Zeng H. 2010. Lake status, major problems and protection strategy in China. J. Lake Sci. 22:799–810.
- Yi N, Gao Y, Long X, Zhang Z, Guo J, Shao H, Zhang Z, Yan S. 2014. Eichhornia crassipes Cleans Wetlands by enhancing the nitrogen removal and modulating denitrifying bacteria community. Clan–Soil Air Water. 42:664–673.
- Zeleke J, Lu S, Wang J, Huang J, Li B, Ogram AV, Quan Z. 2013. Methyl coenzyme M reductase A (mcrA) gene-based investigation of methanogens in the mudflat sediments of Yangtze River Estuary, China. Microb Ecol. 66:257–267.