
ABSTRACT
In this paper, we describe a model system comprised of hydrodynamic, sediment transport, heat transfer and habitat models. We used this model system to assess the ecosystem situation and investigate the impacts of two ecological restoration strategies in the Mian River, China. Freshwater Reeves shad (Tenualosa reevesii) was selected as the target fish species. Model results indicate a low habitat suitability level for T. reevesii under current hydrological conditions. Due to the habitat protection and restoration requirements in China, further numerical model simulations were conducted to investigate the effects of two ecological restoration strategies: addition of a side-channel and riverbank reconstruction (groin field installation). The long-term effects of the restoration projects were also simulated. The analysis indicated that both restoration strategies would significantly enhance the target fish habitat suitability level, with the OSI (overall suitability index) increasing from 39.9% to 53.7% for the added side-channel strategy and from 39.9% to 61.5% for the river bank reconstruction strategy.
Introduction
Surveys and documents on the status of freshwater fish species show that many precious freshwater fish species have declined dramatically since the beginning of this century and become endangered (Zhong and Power Citation1996; Fu et al. Citation2003; Albanese et al. Citation2009). The decline of freshwater fish, especially rare species, is causing increasing concern (Moyle and Leidy Citation1992; Dudgeon Citation1995; Burkhardt-Holm et al. Citation2002; Jones et al. Citation2004). One of the greatest threats contributing to the decline is the loss of the suitable river habitats. Freshwater fishes are very sensitive to the physical conditions of river and streams, including depth, current velocity, substrates, river bed shear stress and water temperature (Steffler and Blackburn Citation2002; Scheuerell et al. Citation2006; Yao et al. Citation2014, Citationa, Citationb). The decline of habitat quality and the decrease of fish species have aroused a strong interest in stream restoration and habitat improvement schemes.
River and habitat restoration is an attempt to recoup some of the losses in ecosystem services and to do so in more long-term effective ways and at lower costs than through technological fixes such as nutrient reduction programs through upgrades of sewage or sludge treatment plants (Palmer and Allan Citation2005; Palmer et al. Citation2007). Currently, many efforts are underway throughout the world to restore river ecosystems. For example, The United States has spent billions of dollars on the restoration of aquatic habitats and many endangered species are on the protected list (Bernhardt et al. Citation2005). Beginning in 2000, China has implemented the most stringent water management rules on streams to protect and restore river ecosystems (Chen Citation2009; Wang Citation2011). Australia has completed more than 2200 stream restoration projects, including riparian management projects, bank stabilization, in-stream habitat improvement and habitat monitoring projects (Brooks and Lake Citation2007). In all of the successful and effective stream restoration projects, hydrology and riverbed evolution have been very important factors (Bond and Lake Citation2003; Palmer et al. Citation2005). Thus, to provide a scientific basis for effective stream restoration, it is important to link hydrodynamics, temperature distribution and sediment characteristics of stream systems to habitat models. Such integrated model systems can evaluate and improve stream ecosystems.
The goal of this research was to identify strategies to improve the ecological condition of Mian River, China. In order to examine relations between restoration strategies and habitat improvement, we evaluated the current habitat suitability level and investigated two river restoration strategies: a groin field installation and an addition of a side-channel. The Mian River and Reeves shad (Tenualosa reevesii) were chosen as the experimental river and the target fish, respectively, by the local water conservancy bureau for a restoration study. We utilized measured hydrology, water temperature and topographic data as current conditions to simulate the flow velocity, water depth and water temperature on the experiment branch. We then used the simulated velocity, geology and substrates to calculate the river bed evolution and river bed shear stress. The Reeves shad habitat quality was also quantified. After that, the two restoration strategies were simulated to explore their immediate influence and their post-restoration effects to identify the best opportunities for meeting restoration goals.
Methods
Study areas
Our study was conducted in a planned reconstruction reach of the Mian River which is a tributary of the Xiang River (). The reach represents a field-scale laboratory for investigation of the restoration effects on river dynamics, evolution and habitat formation based on information from surveys and literature sources (Li et al. Citation2010). This reach is currently reconstructed in a planned way as part of a larger effort to improve hydrodynamic and native fish species habitat. Three monitoring locations were chosen which are evenly distributed along the river reach. The river has a single-channel, meandering form with an average width of 350 m and average annual discharge of 300 m3/s. The bed material grain-size distribution is shown in and the mean annual water temperature is 13 °C in the middle of the river and 18 °C near the river bank. The water quality and chemical pollution density meet the standard of GB3838-2002 (Citation2002 GB; Yin Citation2016).
Figure 1. Map of the Mian River reach and computation domain. Study area was used to generate the topographic mesh for hydraulic modeling, sediment transport, habitat calculation and restoration evaluation (A, B and C are monitoring locations).
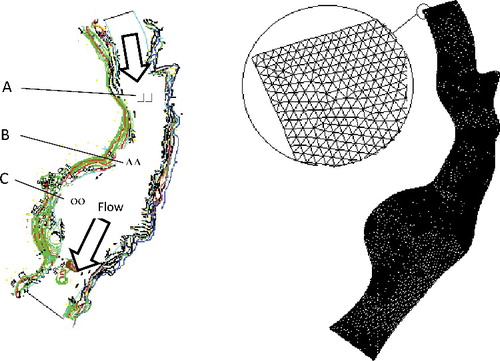
Figure 2. River bed sediment grading curves in locations A, B and C.
In the past, the Mian River had a rich diversity of freshwater aquatic organisms and supported four common freshwater fish species: grass carp (Ctenopharyngodonidella), Reeves shad (T. reevesii), bighead carp (Hypophthalmichthysnobilis) and black carp (Mylopharyngodonpiceus). Among these fish species, Reeves shad is a very good representative of the local fish community based on the aquatic ecological survey results. The river provides a habitat for a number of fish species, but the number of species has decreased significantly along with destruction of the river bank. The river bank destruction is mainly due to vegetation and surface soil damage.
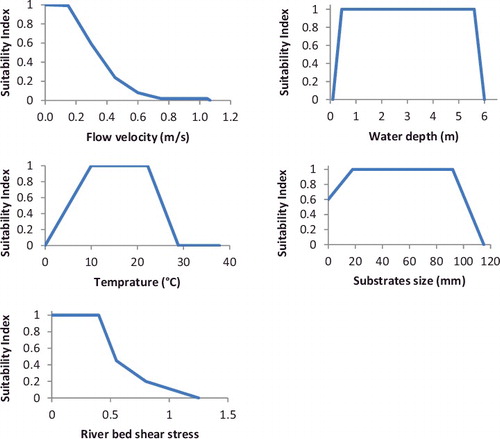
In order to understand the science of the Mian River restoration and the best chance of meeting restoration goals, two restoration strategies were proposed based on engineering experiences. Reeves shad was chosen as the target species to evaluate the river restoration efficiency. Five critical indices which were known to affect Reeves shad habitat were selected: velocity, water depth, substrate composition, water temperature and river bed shear stress distribution. The suitability index (SI) curves for the Reeves shad are shown in . These curves are constructed mainly from professional judgment and from information contained in literature sources (Liu and He Citation1992; Liu et al. Citation2002).
Figure 3. Flow velocity, water depth, water temperature, substrates and river bed shear stress habitat suitability index curves developed for the Reeves shad (Tenualosa reevesii) in the Mian River.
Model system
The Mian River computational domain was adapted as shown in . The Mian River model system was developed by integrating three parts: (Equation1(1) ) the hydrodynamic and heat transfer simulation model, (Equation2
(2) ) the sediment transport model (Equation3
(3) ) the target fish species habitat evaluation model based on preference curves. The flow chart of the model system is shown in . In the hydrodynamic model, the velocity, water depth and temperature distributions were obtained. The shear stress and substrate distributions were calculated based on the sediment transport model. The habitat model was used to calculate the habitat suitability index (HSI), weighted usable area (WUA), and the overall habitat suitability index (OSI).
Figure 4. Schematic flow chart of model structure of the Mian River study.
Mathematical description of hydrodynamic and heat transfer simulation model
The equations governing the flow and temperature characteristics simultaneously in the river are the continuity equation, the shallow water equation and the heat transfer equation. For the simulation of turbulence in the flow, the standard k-ϵ turbulent viscosity model has been employed (Rodi Citation1993). The notations used in the equations are defined in the list of symbols at the end of the paper.
Continuity equation(1)
Momentum equation(2)
(3)
Heat transfer equation(4)
Turbulent kinetic energy equation
The k-ϵ model is an empirical model which contains the turbulence kinetic energy (k) term and its dissipation rate () term.
(5)
Dissipation rate equation(6)
The model transport equation for k is derived from the nonlinear equations, while the model transport equation for ϵ was obtained using physical reasoning and bears little resemblance to its mathematically exact counterpart.
River bed shear stress and river bed evolution
River bed shear stress is one of the most important hydrodynamic parameters regarding fish habitat and river bed evolution (Borchardt Citation1993; Namin et al. Citation2004). The calculation equation is as follows:(7) with
(8)
The riverbed evolution is calculated from the sediment continuity equation, also named the Exner equation(9)
There are several capacity formulae which could be used for the bed load calculation (Einstein Citation1942; Meyer-Peter and Müller Citation1948; Brown Citation1950; Van Rijn Citation1984). After carefully reviewing the grain sizes and hydraulic conditions, the Meyer-Peter–Muller equation was chosen to calculate bed load(10)
(11)
Habitat construction procedure and restoration strategy evaluation
Similar to the concepts of PHABSIM, River2D and other models (Bovee Citation1986; Milhous et al. Citation1989; Gard Citation2009, Citation2010), the habitat model is used to calculate and evaluate the HSI, WUA and the OSI for the initial/current stage and restoration strategies. For the HSI calculation, variables which affect growth, survival and abundance were considered in the habitat model (Statzner & Higler Citation1986). In this model, velocity, water depth, substrates, water temperature and river bed shear stress distribution were selected as variables for the HSI calculation based on SI curves. The HSI was defined for each grid mesh and for each time step. The value of HSI ranged from 0 to 1, with three types: LSP (the percentage of low HSI values), MSP (the percentage of middle HSI values) and HSP (the percentage of high HSI values) (). The HSI is defined as follows:(12)
Table 1. Criteria of habitat suitability index for Reeves shad (Tenualosa reevesii) in Mian River. (HSI is habitat suitability index).
WUA and OSI are defined as follows:(13)
(14)
Model system and boundary condition setup
In applying the model, three simulations were setup for habitat quality evaluation, including the Mian River current habitat situation and two restoration strategies. Two additional simulations were setup for evaluating the post-restoration effects of restoration strategies in order to achieve the best chances of successful restoration. For the addition of a side-channel strategy, the side-channel length and width were 800 and 75 m, respectively. For the riverbank reconstruction (groin field installation) strategy, the side bar length and width were 50 m and 8 m, respectively. There were 22 groins planned in the computation domain and the interval between them ranged from 120 to 130 m.
In the model system, the finite volume method was applied to solve the staggered grid system on the partial differential equations. The entrance boundary, outflow boundaries and isothermal boundary conditions were applied. The mean annual discharge, initial substrate distribution and water depth were obtained (Li et al. Citation2010; Yin Citation2016). The simulation time step is 1 second and the simulation results are saved as output with an interval of three months. The model system has been developed based on the open source software TELEMAC (with authors’ subroutine) and Fortran compiler. More detailed description can be found in the Telemac user manual and books which discuss model system development and application (Riadh et al. Citation2014; Yao Citation2016).
Results
The river restoration model was applied to the target fish in the Mian River reach which was 1.2 km in length and 180 m in width (). The velocity distribution, water depth, water temperature, river bed shear stress, as well as the HSI of the initial stage, were calculated and the sensitivity analysis was also performed.
Hydrodynamic simulation and validation
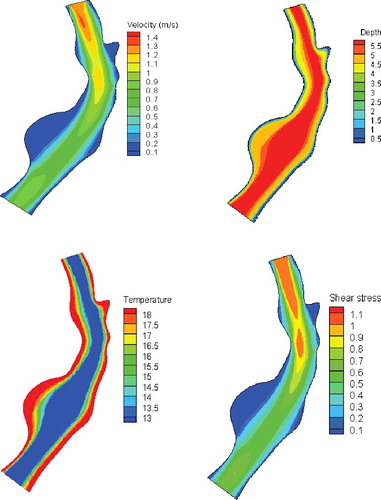
The hydrodynamic simulation of the Mian River indicated that the average velocity was 0.9 m/s in the middle of the river with a maximum value of 1.4 m/s, while near the shore and back water areas the velocity was about 0.1–0.3 m/s (). The maximum water depth was 5.5 m which occurred in the middle of the river (). For the water temperature distribution, our simulation results suggest that the near shore areas have a higher temperature (18 °C) than the middle of the river (13 °C; ). The river bed shear stress distribution had the same trend as the velocity distribution and had a maximum value of 0.9 ().
Figure 5. Velocity, water depth, temperature, river bed shear stress distribution under annual average discharge (300 m3/s).
The field-measured velocity and water depth at locations A, B and C acquired with a discharge of 300 m3/s were compared with the results from the hydrodynamic model. The agreement of the model simulations with the measured data is shown in . To assess the simulated accuracy of the hydrodynamic model, a statistical measure, i.e. mean absolute error, was applied and quantified. The results show that the model simulated results agree well with the measured data, which means the hydrodynamic model is reliable and can be expected to represent the real situation.
Table 2. Correlation between simulated and measured velocity, as well as water depth, at locations A, B and C in the Mian River (MAE is the mean absolute error).
Habitat suitability level
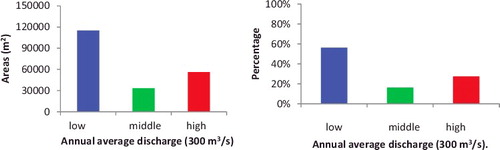
The HSI was calculated on the basis of point values of water depth, flow velocity, substrates sediment, temperature and bed shear stress. The Reeves shad HSI distributions for the present situation are shown in . From the simulation results, we found that the Mian River branch would not provide a very suitable living environment for the Reeves shad. Specifically, the majority of the river branch has a low HSI for Reeves shad with only the nearshore areas, as well as the backwater nursery areas, providing suitable habitat conditions for the fish. The proportions of the high, middle and low habitat suitability for the fish are 27.4%, 16.3% and 56.3%, respectively (). The corresponding areas for high, middle and low habitat suitability were 5.6 × 10⁴ m2, 3.3 × 10⁴ m2 and 1.2 × 10⁵ m2 (). The WUA and OSI for Reeves shad in the Mian River reach were 8.15 × 10⁴ m2 and 39.9%, respectively.
Figure 6. Initial habitat suitability index distributions for the Reeves shad (Tenualosa reevesii) in Mian River under the annual average discharge (300 m3/s).
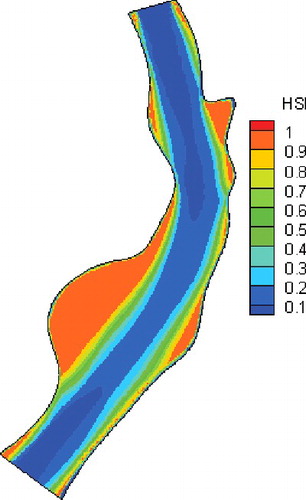
Figure 7. High, middle and low habitat suitability index percentages and areas for the Reeves shad (Tenualosa reevesii) under the annual average discharge (300 m3/s).
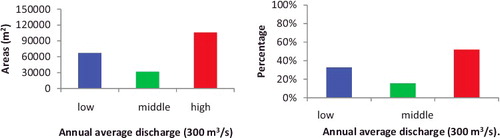
When the side-channel is added on the Mian River's right side, it is notable that the habitat suitability indices for the Reeves shed have observed a significant overall change in the river reach (). When comparing the initial habitat situation to the case where a side-channel has been added, it is apparent that the habitat level in the main stem of the Mian River has resulted in a decrease in the low HSI proportion and an increase in the middle and high HSI percentages. The habitat suitability level in the side-channel is filled with high HSI values. A comparison of the current habitat condition with the case of the addition of a side-channel, it is shown that the low and middle habitat suitability percentages for the target fish decreased to 32.8% and 15.4%, respectively, while the high habitat suitability increased to 51.8% (). The WUA and OSI have grown to 1.59 × 10⁵ m2 and 61.5% which is almost twice as much as original river condition. The river areas for high, middle and low habitat suitability are 1.34 × 10⁵ m2, 3.98 × 10⁴ m2 and 8.48 × 10⁴ m2, respectively.
Figure 8. The habitat suitability index distribution of Reeves shad (Tenualosa reevesii) under the added side-channel restoration strategy applied under the annual average discharge (300 m3/s).
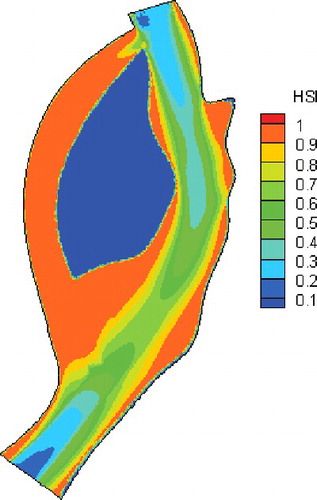
Figure 9. High, middle and low habitat suitability index percentages and areas for the Reeves shad (Tenualosa reevesii) under the added side-channel restoration strategy with the annual average discharge (300 m3/s).
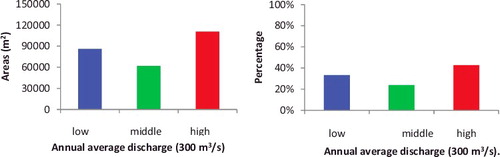
When the riverbank reconstruction was applied, the habitat quality was analyzed and presented in . In general, the habitat conditions improved on both sides of the Mian River, and especially on the left side, although there is little change in the middle of the river. In this hypothetical strategy, the ratio of the high, middle and low habitat suitability for the Reeves shad are 42.8%, 23.9% and 33.3%, respectively (). The corresponding high and middle suited areas for the Reeves shad increased to 8.75 × 10⁴ m2 and to 4.88 × 10⁴ m2, respectively, while the low suited areas decreased to 6.81 × 10⁴ m2. The WUA and OSI for the Reeves shad in the Mian River were 1.10 × 10⁵ m2 and 53.7%, respectively.
Figure 10. The habitat suitability index distribution of the Reeves shad (Tenualosa reevesii) for the groin field installation restoration strategy under the annual average discharge (300 m3/s).
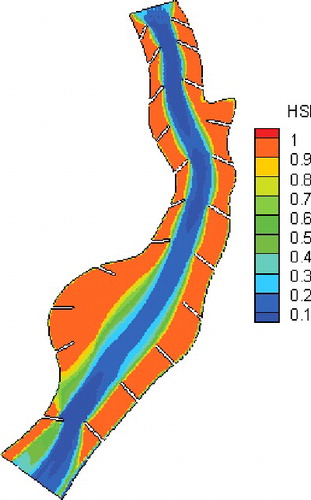
Figure 11. High, middle and low habitat suitability index percentages and areas for Reeves shad (Tenualosa reevesii) under the groin field installation restoration strategy with the annual average discharge (300 m3/s).
Discussion
It is notable that evaluating the success of the river restoration strategies largely depends on the pre-monitoring and post-monitoring data (Lake Citation2001; Palmer et al. Citation2005, Citation2007). The restoration of the Mian River has had poor habitat monitoring data archiving which has hampered progress in practical understanding of what a successful stream restoration project is. However, besides field monitoring, numerical simulation is also a very effective and appropriate approach (Kasahar and Hill Citation2008; Yao et al. Citation2014). Thus, we chose to evaluate the outcome of the Mian River restoration strategies through simulation results in order to determine whether they had the potential for a healthier and ecologically sustainable river.
Restoration strategy comparisons
A comparison of the habitat condition between the two restoration strategies and the original or current condition is summarized in . As depicted there, the values of the WUA, OSI and the high habitat suitable areas for the side-channel restoration strategy and the groin field installation strategy are much higher than those under current conditions. The figure also demonstrates that the side-channel restoration strategy is better than the riverbank reconstruction restoration strategy according to the values of highly suitable areas, WUA and OSI.
Table 3. Comparison of the LSP, MSP, HSP, WUA and OSI among initial stage and the side-channel and riverbank reconstruction (groin field installation). (LSP is the percentage of low HSI values; MSP is the percentage of middle HSI values; HSP is the percentage of high HSI values; WUA is the weighted usable area; OSI is the overall suitability index).
Post-restoration effects of restoration strategies
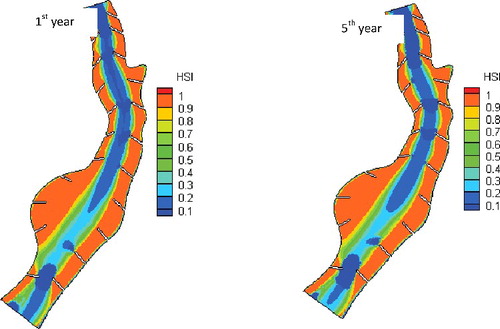
Although we found that both the added side-channel and riverbank reconstruction restoration strategies could significantly improve the habitat and ecological situation, we needed to further investigate and compare these two restoration strategies based on a long-term simulation. In order to identify a better restoration strategy, a five-year river habitat level after the proposed restoration strategies has been simulated. The simulation results of WUA, as well as OSI, are shown in . The corresponding HSI distributions with both restoration strategies at the Mian River reach are shown in and . From these figures, we could observe that the WUA and OSI in both restoration strategies are quite stable to a considerable extent but they also show different trends. For the addition of side-channel restoration strategy, the WUA and OSI values increased slightly in the first two years before decreasing tendencies set in during the last three years. In contrast, for the over the five-year period restoration strategy riverbank reconstruction (groin field installation), the WUA and OSI values are always showing a slightly decreasing trend over the five-year period. It is noted that even though decreasing trends in the WUA and OSI values in both restoration strategies have been observed, the alteration is too small to change the overall habitat situation in the Mian River.
Figure 12. The WUA, OSI curves for the Reeves shad (Tenualosa reevesii) after both the added side-channel and riverbank reconstruction (groin field installation) restoration strategies have been applied.
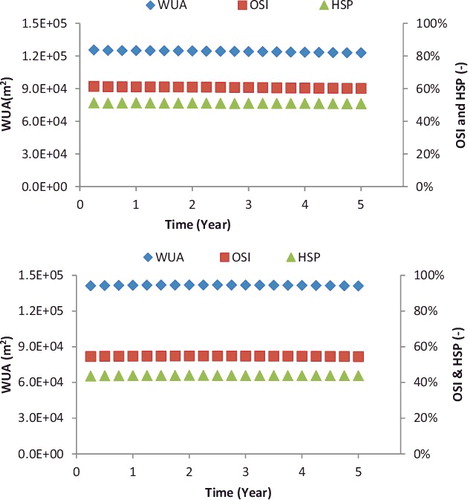
Figure 13. The habitat suitability index distribution of the Reeves shad (Tenualosa reevesii) in Mian River after the added side-channel restoration strategy has been applied.
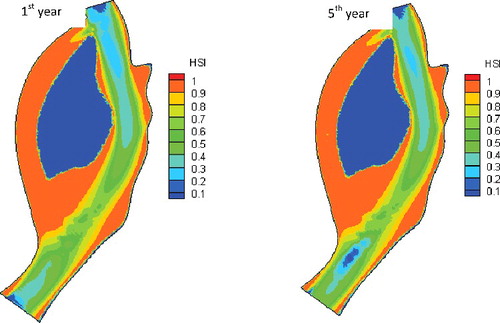
Figure 14. The habitat suitability index distribution of the Reeves shad (Tenualosa reevesii) in Mian River after the riverbank reconstruction (groin field installation) restoration strategy has been applied.
Through the analysis of the two restoration strategies and the analysis of the long-term post-restoration effects of the restoration strategies, we could conclude that both restoration strategies are likely to be very successful and could be applied in the Mian River. From the point view of the reach of Mian River that is the focus of this study, the habitat suitability level of the addition of side-channel strategy is better than the riverbank reconstruction (groin field installation) strategy. But from the point of view in the main river, the riverbank reconstruction (groin field installation) strategy would be better than addition of side-channel strategy. If the riverbank reconstruction (groin field installation) strategy is implemented, the habitat at the side of the river may become fragmented and the fish larvae habitat spatial configuration may also need further monitoring.
Conclusions
In this study, we have presented simulation results from two restoration strategies and highlighted the best opportunity for meeting restoration goals. The study has provided a unique opportunity to improve our knowledge about restoration success. We evaluated the initial habitat and ecological situation based on three different indices (HSI, WUA and OSI) and assessed the habitat situation improvement for two proposed restoration strategies. After that, the long-term habitat alterations for both restoration strategies were simulated and these results provided a scientific basis for effective stream restoration.
Through the model simulation in the Mian River, it can be noted that the HSI, WUA and OSI values are relatively low at initial stage which indicates the river is not suitable for Reeves shad survival. For the two river restoration strategies, we found that both addition of side-channel and riverbank reconstruction (groin field installation) strategies can improve the habitat suitability level substantially. In addition, through the simulation of long-term post-restoration effects after the restoration strategies have been implemented in the Mian River, the success of these two restoration strategies would be further improved. From the analysis, we can therefore conclude that both restoration strategies can be very successful for the Mian River and provide sufficient ecological requirement for fish by reshaping the lost habitats.
It should be noted that these two restoration strategies could further be compared from economic perspectives. It should also be noted that the restoration strategies obtained from this study are specific to the Mian River and the target fish species based on five important indices: velocity, water depth, temperature, substrates and river bed shear stress. However, the methodology is easily adapted to other applications. By applying stream restorations to other fluvial or lacustrine environments, other strategies such as built artificial islands and flood flushes, as well as other relevant suitability variables, also should be taken into account.
| List of symbols | ||
| Ai | = | The area of the mesh i |
| Ar | = | Archimedes number |
| = | Heat transfer diffusivity scalars | |
| u, v | = | Turbulence diffusivity scalars |
| k, ϵ | = | Diffusivity scalars |
| = | Non-dimensional skin friction number/shields number | |
| = | Critical shields value | |
| = | The eddy viscosity | |
| C1, C2, C3 | = | The constant values 1.44, 1.05 and 1, respectively |
| Cd | = | Chezy friction coefficient |
| d50 | = | Particle size parameter at 50 percent |
| g | = | Gravitational acceleration |
| Gb, Gk | = | The production of turbulent kinetic energy due to shear and due to buoyancy, respectively |
| h | = | Fluid column height |
| HSIi,t | = | Habitat suitability index |
| k | = | Kinetic energy |
| = | Dissipation rate | |
| η | = | Water surface elevation |
| M | = | The total number of grid mesh |
| Ma | = | Manning friction (0.035 was chosen) |
| OSI | = | Overall suitability index |
| p’ | = | The non-cohesive bed porosity |
| Qbs, Qbn | = | Bed-load flux |
| SIv, SId, SIs, SIT, SIbs | = | Suitability index for velocity, water depth, substrates, temperature and bed shear stress |
| t | = | Time |
| T | = | Temperature |
| u, v | = | Average depth, average velocity components in x and y directions, respectively |
| WUA | = | Weighted usable area |
| τb | = | Bed shear stress |
| = | Sediment density | |
| = | Water density | |
| Zb | = | Channel elevation |
Acknowledgments
The work was financially support by the China key water project plan (2016YFC0502004), The National Key Research and Development Program of China (2017YFC0404304), The Basic Research and Application Program of the Bingtuan (2016AG003), project (O5Z512CFWW), the CAS project (Y6V60222YZ), and CCA project (201707). The authors also thank the editor and two anonymous reviewers which help to improve the quality of this paper.
Disclosure statement
No potential conflict of interest was reported by the authors.
Additional information
Funding
Notes on contributors
Wei-Wei Yao
Wei-Wei Yao is a research scientist at CAS environmental remediation who develop the model tool to predict the habitat quality and predict the long-term effects of restoration strategies.
Yuansheng Chen
Yuansheng Chen is a professor at CAS environmental remediation who mainly focuses on water resources and water environment survey.
Yu Zhong
Yu Zhong is a research scientist at CAS biophysics where she gives professional support decision on study fish preference curves.
Wenyi Zhang
Wenyi Zhang is the senior engineer who works on river restoration strategies.
Haiyan Fan
Haiyan Fan is the senior engineer who works on river restoration strategies.
References
- Albanese E, Dangour AD, Uauy R, Acosta D, Guerra M, Guerra SSG, Huang Y, Jacob KS, Rodriguez JL, Noriega LH, et al. 2009. Dietary fish and meat intake and dementia in Latin America, China, and India: a 10/66 dementia research group population-based study. Am J Clin Nutr. 90(2):392–400.
- Bernhardt ES, Palmer M, Allan JD, Alexander G, Barnas K, Brooks S, Carr J, Clayton S, Dahm C, Follstad-Shah J, et al. 2005. Synthesizing U.S. river restoration efforts. Science. 308(5722):636–637.
- Bond NR, Lake PS. 2003. Local habitat restoration in streams: constraints on the effectiveness of restoration for stream biota. Ecol Manage Restor. 4(3):193–198.
- Borchardt D. 1993. Effects of flow and refugia on drift loss of benthic macroinvertebrates: implications for habitat restoration in lowland streams. Freshwater Biol. 29(2):221–227.
- Bovee KD. 1986. Development and evaluation of habitat suitability criteria for use in the instream flow incremental methodology. US Fish and Wildlife Service Biological Report 86 (7). Washington, DC.
- Briggs MK, Cornelius S. 1998. Opportunities for ecological improvement along the lower Colorado River and delta. Wetlands. 18(4):513–529.
- Brooks SS, Lake PS. 2007. River restoration in Victoria, Australia: change is in the wind, and none too soon. Restor Ecol. 15(3):584–591.
- Brown CB. 1950. Sediment transport. In: Rouse H, editor. Engineering hydraulics, Chapter 12. Wiley.
- Burkhardt-Holm P, Peter A, Segner H. 2002. Decline of fish catch in Switzerland. Aquat Sci. 64(1):36–54.
- Chen L. 2009. [Implement the most stringent water management system to protect the economic and social sustainable development]. China Water Resour. 4(5):10–12. Chinese.
- Dudgeon D. 1995. River regulation in southern China: ecological implications, conservation and environmental management. Regul Rivers: Res Manage. 11(1):35–54.
- Einstein HA. 1942. Formulae for transportation of bed-load. Trans. ASCE. 107(1):561–577.
- European Commission. 1992. Council Directive 9243/EEC of 21 May 1992 on the conservation of natural habitats and of wild fauna and flora. Official J Eur Communities. L 206. p. 7.
- Fu C, Wu J, Chen J, Wu Q, Lei G. 2003. Freshwater fish biodiversity in the Yangtze River basin of China: patterns, threats and conservation. Biodivers Conserv. 12(8):1649–1685.
- Gard M. 2009. Comparison of spawning habitat predictions of PHABSIM and River2D models. Int J River Basin Manage. 7(1):55–71.
- Gard M. 2010. Response to Williams (2010) on Gard (2009): comparison of spawning habitat predictions of PHABSIM and River2D models. Int J River Basin Manage. 8(1):121–125.
- Jones GP, McCormick MI, Srinivasan M, Eagle JV. 2004. Coral decline threatens fish biodiversity in marine reserves. Proc Nat Acad Sci United States Am. 101(21):8251–8253.
- Kasahara T, Hill AR. 2008. Modeling the effects of lowland stream restoration projects on stream–subsurface water exchange. Ecol Eng. 32(4):310–319.
- Lake PS. 2001. On the maturing of restoration: linking ecological research and restoration. Ecol Manage Res. 2:110–115.
- Li W, Liu L, Xiao L. 2010. [The project of Mian River preliminary design and research report]. p. 230. Chinese.
- Liu J, He B. 1992. [China freshwater fishery cultivation]. Beijing: Science Press. Chinese.
- Liu S, Chen D, Duan X, Qiu S, Wang L. 2002. Status of Reeves shad and corresponding resources protection measures in China. Aquat Biol. 26(6):679–684.
- Meyer-Peter E, Müller R. 1948. Formulas for bed-load transport. In: Proceedings of the 2nd Meeting of the International Association for Hydraulic Structures Research; Stockholm, Sweden. p. 39–64.
- Milhous RT, Updike MA, Schneider DM. 1989. Physical habitat simulation system reference manual, Version II. Instream flow information paper no. 26; US fish and wildlife service, Biological report 89(16).
- Moyle PB, Leidy RA. 1992. Loss of biodiversity in aquatic ecosystems: evidence from fish faunas. In: Peggy LF, Subodh KJ, editors. Conservation biology. New York (NY): Springer; p. 127–169.
- Namin MM, Lin B, Falconer RA. 2004. Modelling estuarine and coastal flows using an unstructured triangular finite volume algorithm. Adv Water Resour. 27(12): 1179–1197.
- Palmer MA, Allan JD. 2005. Restoring rivers. Issues Sci Technol. 22:40–48.
- Palmer MA, Bernhardt ES, Allan JD, Lake PS, Alexander G, Brooks S, Carr J, Clayton S, Dahm CN, Follestad Sha J, et al. 2005. Standards for ecologically successful river restoration. J Appl Ecol. 42:208–217.
- Palmer M, Allan JD, Meyer J, Bernhardt ES. 2007. River restoration in the twenty‐first century: data and experiential knowledge to inform future efforts. Restor Ecol. 15(3):472–481.
- Riadh A, Cedric G, Jean MH. 2014. Telemac modeling system: 2d hydrodynamics telemac-2d software release 7.0 user manual. Paris: R&D, Electricite de France, p. 134.
- Rodi W. 1993. Turbulence models and their application in hydraulics. New York (NY): CRC Press, p. 124.
- Scheuerell MD, Hilborn R, Ruckelshaus MH, Bartz KK, Lagueux KM, Haas AD, Rawson K. 2006. The Shiraz model: a tool for incorporating anthropogenic effects and fish-habitat relationships in conservation planning. Can J Fish Aquat Sci. 63(7):1596–1607.
- Statzner B, Higler B. 1986. Stream hydraulics as a major determinant of benthic invertebrate zonation patterns. Freshwater Biol. 16(1):127–139.
- Steffler P, Blackburn J. 2002. Two-dimensional depth averaged model of river hydrodynamics and fish habitat. River2D user's manual. Canada: University of Alberta.
- Van Rijn LC. 1984. Sediment transport, part I: bed load transport. J Hydraulic Eng. 110(10):1431–1456.
- Wang H. 2011. [Implement the most stringent water management system analysis of key technical support]. Chinese Water Conserv. 5(6):28–29. Chinese.
- Yao W. 2016. Application of the ecohydraulic model on hydraulic and water resources engineering. München, Germany: Technische Universität München; p. 220. ISBN 978-3853-943683-11-0.
- Yao W, Bui M, Rutschmann P. 2014. Application of habitat and population modeling in river management. Zurick.
- Yao W, Rutschmann P, Bamal S. 2014a. Simulating dam effects on river deformation and rainbow trout (Oncorhynchus mykiss) population number. River Flow.
- Yao W, Rutschmann P, Bamal S. 2014b. Modeling of river velocity, temperature, bed deformation and its effects on rainbow trout (Oncorhynchus mykiss) habitat in Lees Ferry, Colorado River. Int J Environ Res. 8(4):887–896.
- Yao W, Rutschmann P, Sudeep. 2015. Three high flow experiment releases from Glen Canyon Dam on rainbow trout and flannelmouth sucker habitat in Colorado River. Ecol Eng. 75:278–290.
- Yin W. 2016. [Mian River water environmental survey report]. p. 120. Chinese.
- GB3838. 2002. [The surface water environmental quality standard of the People's Republic of China]. P. 12. Chinese.
- Zhong Y, Power G. 1996. Environmental impacts of hydroelectric projects on fish resources in China. Regul Rivers: Res Manage. 12(1):81–98.