
ABSTRACT
Shallow lakes and ponds constitute a significant number of water bodies worldwide. Many are heterotrophic, indicating that they are likely net contributors to global carbon cycling. Climate change is likely to have important impacts on these waterbodies. In this study, we examined two small Minnesota ponds; a permanent woodland pond and a temporary prairie pond. The woodland pond had lower levels of phosphorus and phytoplankton than the prairie pond. Using the open water oxygen method, we found the prairie pond typically had a higher level of gross primary production (GPP) and respiration (R) than the woodland pond, although the differences between the ponds varied with season. Despite the differences in GPP and R between the ponds the net ecosystem production was similar with both being heterotrophic. Since abundant small ponds may play an important role in carbon cycling and are likely to undergo changes in temperature and hydroperiod associated with climate change, understanding pond metabolism is critical in predicting impacts and designing management schemes to mitigate changes.
Introduction
Lakes have been described as important components of global nutrient and energy cycles and as such are likely to impact and be impacted by climate change (Williamson et al. Citation2009a, Citation2009b; Moss Citation2012). Small standing waterbodies (<0.01 km2) constitute a large proportion of the number (91%) and area (16%) of lakes globally (Downing et al. Citation2006) although the estimation of their number is difficult (Cael and Seekell Citation2016). There is growing awareness of the importance of these small water bodies in the global carbon cycle (Cole et al. Citation2007; Downing Citation2010; Trochine et al. Citation2014; Holgerson and Raymond Citation2016; Reverey et al. Citation2016). In addition to their importance in carbon cycling, small water bodies also provide a number of other ecosystem services including improving water quality, moderating floods and supporting biodiversity (Marton et al. Citation2015; Bortolotti et al. Citation2016).
Climate change is expected to have significant impacts on many aquatic systems (Schindler Citation1997; Oki and Kanae Citation2006; Whitehead et al. Citation2009; Williamson et al. Citation2009a, Citation2009b; Moss Citation2012) including small permanent and temporary ponds (Flanagan and McCauley Citation2010; Jeppesen et al. Citation2014). A number of studies have examined these potential changes on small ponds including changes in vascular plants and benthos (Rosset and Oertli Citation2011), periphyton production and benthic community structure (Evtimova and Donohue Citation2014), food web structure (Shurin et al. Citation2012) and pond metabolism (Klotz Citation2013; Christensen et al. Citation2013). Rohia et al. (Citation2015) point out that the number of permafrost thaw ponds is increasing in arctic and subarctic regions and these ponds are generally heterotrophic, producing supersaturation levels of CO2 and CH4.
Ponds likewise can have impacts on climate change. High levels of productivity from increased temperature could significantly contribute to carbon sequestration (Downing Citation2010; Klotz Citation2013) or, since many small lakes and ponds are heterotrophic, increased temperature could lead to increased carbon release (Klotz Citation2013). A mesocosm study by Yvon-Durocher et al. (Citation2017) indicated that warming can alter the carbon balance of small ponds over a number of years resulting in reduced sequestration of CO2 and increased emissions of CH4.
While climate change will influence both water temperature and hydroperiod (Ali et al. Citation2016), Brooks (Citation2009) indicated that the duration (hydroperiod) and the timing (hydroregime) of inundation are the major abiotic factors influencing small ponds. Hydroperiod has been shown to have significant impacts on benthic and zooplankton community structure (Pyke Citation2005; Kneitel Citation2014), food chain length (Schriever and Williams Citation2013) leaf litter breakdown (Gingerich et al. Citation2014) and breeding success of amphibians (Chandler et al. Citation2016). As Bauder (Citation2005) points out, the variability in the hydrology of individual ponds and the variety of hydrological conditions likely means that systems will need individual consideration to be conserved, managed or restored.
One approach to examining the potential impact of climate change on ponds through alterations of hydroperiod is to measure pond metabolism. Woodward et al. (Citation2010) recommended more studies that focus on integrated responses to impacts of climate change rather than focusing on individuals or populations. Pond metabolism is the combination of gross primary productivity (GPP) of an ecosystem and total respiration (R), which together make up the net ecosystem production (NEP). The overall sign of NEP is important to consider; positive means the pond is autotrophic and negative indicates heterotrophy. If a pond is heterotrophic, there must be additional sources of energy from outside the pond that are fueling the high amounts of respiration (Sand-Jensen and Staehr Citation2007). This can be from the inflow of a stream or from terrestrial sources, such as leaves or other organic matter. While there have been a few studies of metabolism in ponds, most have used a closed chamber method to estimate production and respiration often over relatively short periods of time (Naiman et al. Citation1986; Sand-Jensen and Staehr Citation2009; Camacho et al. Citation2016). Increasingly there has been the widespread use of free-water measurements of oxygen change to assess metabolism, which was the approach we used. The number of these types of free-water studies in ponds, especially ephemeral ponds is small (Geertz-Hansen et al. Citation2011; Christensen et al. Citation2013; Klotz Citation2013).
Primary producers in ponds and shallow lakes include periphyton, phytoplankton, macrophytes and mixotrophs. Periphyton contributes between 43% and 97% of total productivity in shallow oligotrophic lakes, while phytoplankton account for 96% of total productivity in eutrophic lakes (Loeb et al. Citation1983; Liboriussen and Jeppesen Citation2003). In the past, phosphorus was thought to be the main factor limiting phytoplankton and periphyton growth (Dillon and Rigler Citation1974; Schindler Citation1977). Other studies show that phosphorus is not always the primary limiting nutrient and that a co-limitation mechanism between nitrogen and phosphorus may exist (Dzialowski et al. Citation2005; Smith and Lee Citation2006, Kniffin et al. Citation2009). Moreover, other factors seem to influence GPP, such as seasonal variation, light availability, oxygen availability and temperature (Smith and Lee Citation2006; Kniffin et al. Citation2009; Trochine et al. Citation2014) thus influencing overall pond metabolism.
To examine the potential impact of hydroperiod on ecosystem metabolism and primary production we measured diurnal variation in dissolved oxygen (DO), periphyton production and phytoplankton biomass in two ponds: one an ephemeral pond and the other a permanent pond.
Methods
Study area
Study ponds were located at Macalester College's Katharine Ordway Natural History Study Area in east central Minnesota (). This area is located at the boundary of the north central hardwood forest and northern glaciated plain ecoregions. Average winter minimum temperatures reach −15 °C and average summer maximum temperatures are 28.5 °C.
Figure 1. Maps of research sites. A shows the location of both ponds and the main vegetation types in the watershed. B shows the depth profile of the woodland pond. C shows the depth profile of the prairie pond in May when the pond was full. D shows the change in surface area of the prairie pond as the prairie pond dried and refilled.
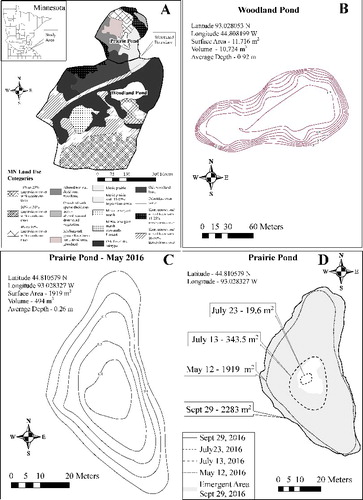
Watershed area was determined by examining 0.3 m resolution LIDAR elevation data (http://www.mngeo.state.mn.us/chouse/metadata/lidar_metro2011.html). Land-use information was taken from the Dakota County, Minnesota GIS archive ftp://ftp.gisdata.mn.gov/pub/gdrs/data/pub/us_mn_co_dakota/biota_landuse_landdev_service/metadata/metadata.html#Identification_Information). We mapped pond shorelines with a handheld GPS (Garmin® Montana 650t) and took water depth readings with a calibrated measuring rod. We then used ESRI® ArcGIS to calculate surface area and volume. The woodland pond (Pratt Pond) had a drainage area of approximately 0.26 km2, a surface area of almost 12,000 m2, and an average depth of 0.9 m. The watershed was covered predominantly by oak forest (44%) with some short grasses and mixed trees (43%). There are homes with lawns surrounding approximately one-third of the pond. The prairie pond had a drainage area of 0.05 km2 with approximately 44% grassland and 29% short grasses with mixed trees. The prairie area is intensively managed with prescribed burns to maintain the habitat. The prairie pond was an ephemeral pond so its surface area and depth varied throughout the study period (). The pond was full in May and began drying during the summer. During 2016 we had an unusually wet late summer and early fall that resulted in pond refilling from late July through late September and it maintained this extent through the rest of the study period. The woodland pond had only marginal emergent vegetation but there were extensive beds of the submerged macrophyte Najas. The prairie pond had extensive beds of the emergent bull reed Sparganium, duckweed (Lemna) was common, and invasive reed canary grass (Phalaris) grew along its perimeter. The presence of duckweed is likely indicative of this pond being eutrophic (Smith Citation2014). Rainfall input to the watersheds was measured by a Vaisala® WXT510 weather station located approximately 100 m northeast by east of the prairie pond.
Physical and chemical parameters
We used standard methods to measure physical and chemical attributes of our study sites. We measured dissolved orthophosphorus and nitrate using a portable spectrophotometer (DR 890, Hach Company, Loveland, Colorado; http://www.hach.com) on 5 dates in the fall. From May 21 to November 2 we used DO data loggers (Model U26, HOBO®, Onset Computer Corporation, http://www.onsetcomp.com) to record water temperature and DO concentration every 10 min. We also deployed a model U24-001 conductivity data logger (HOBO®) in both ponds recording data every 10 min. Additionally, we installed model U20L-04 level loggers (HOBO®) to record water depth. Changes in water depth over the period of the study were calculated based on the initial water depth. The level meter in the prairie pond had to be moved when the water level declined below the meter. All subsequent depths were adjusted for this move. Weather stations (model H21 microstation, HOBO®) were installed at each pond to record photosynthetic activity, barometric pressure, wind speed, air temperature and humidity. To measure underwater light intensity we set light loggers (UA-002, HOBO®) 10 cm below floats. While the response of these loggers was greater than photosynthetically active radiation (PAR), i.e. that which is important to plants, they recorded daily light variation reaching pond algae (Long et al. Citation2012). We measured pH in the prairie pond every 15 min using a data sonde (YSI® Model 6600; Yellow Springs, Inc., http://www.ysi.com) data sonde from September to November. In the woodland pond we only measured pH three times with a portable meter (Combo pH/EC/TDS/C/PPM Tester HI98129, Hanna®; http://www.hannainst.com). Since pH varied diurnally in the prairie pond, and all of the measures in the woodland pond were taken during the afternoon, we restricted our comparison to 1300–1600 h. Six sediment cores were taken in each pond with an HTH sediment corer (Pylonex, Umeå, Sweden; https://www.pylonex.com) in October. Sediment volume was measured in settling cones and bulk density was calculated as dry weight divided by volume. Subsamples from each core were ashed at 550 °C to calculate sediment organic matter content. We also placed temperature sensors (iBCod 22L®, Alpha Mach, Quebec, Canada; http://www.alphamach.com) in one location near the oxygen sensors at the sediment-water interface and 20 cm below the sediment-water interface from September 9 to November 4 to examine whether there was groundwater input into the ponds. Differences in water temperature across the sediment-water interface can be used to detect whether water bodies are gaining or losing systems (Anderson Citation2005).
Periphyton production and phytoplankton biomass
For both periphyton and phytoplankton biomass, we used chlorophyll a as an index of phytoplankton biomass, where chlorophyll was extracted in 90% acetone and measured with an fluorometer (Aquafluor® Model 8000; Turner Designs, http://www.turnerdesigns.com) using EPA Method 445.0 (Arar and Collins Citation1997). Phytoplankton were collected every two weeks from June 8 to November 3 by filtering water samples through Whatman® GF/F filters with a pore size of 0.7 micron.
To assess periphyton growth and nutrient limitation, we deployed artificial substrates enriched with nitrogen (N), phosphorus (P) or nitrogen plus phosphorus (N+P), and measured algal growth similar to methods in Vaughn et al. (Citation2007). Periphyton assays were done in situ using substrates composed of 20 mL agar-filled scintillation vials enriched with either nitrate (0.5M NaNO3 in 2% agar solution), phosphate (0.5M KH2PO4 in 2% agar solution), nitrate and phosphate (0.5M N and 0.5M P using NaNO3 and KH2PO4 in 4% agar), or a non-enriched control (2% agar). Each vial was covered with a porous silica disc, affixed with silicone, and placed in a holder maintained 10 cm below the water surface with only the silica disc exposed. Three replicates of each treatment were placed in each pond for two-week spans, after which time they were collected and new vials were positioned. We conducted five trials in the prairie pond and six in the woodland pond from August through early November.
Pond metabolism
Pond metabolism can be calculated using high frequency free-water measurements of the percent DO taken at regular intervals throughout the day (Odum Citation1956). GPP, which produces oxygen, occurs mainly through photosynthesis and therefore is assumed to be zero during the night. R, however, occurs continuously day and night. If the reasonable assumption is made that respiration stays constant throughout a 24-h period while GPP occurs only during sunlit hours, the differences in oxygen levels during the day and night can be used to estimate GPP and R, and through those two measurements, NEP can also be calculatedwhere C = concentration of oxygen, Cs = concentration of oxygen at saturation, k = reaeration coefficient and GWA = oxygen accrual from groundwater (Odum Citation1956). Groundwater accrual is usually assumed to be zero (Odum Citation1956). Hall and Tank (Citation2005) suggested that even a small amount of groundwater input can substantially impact metabolism calculations. However, our sediment temperature measurements, while not covering the entire pond basins, suggested neither pond had significant groundwater inputs.
To collect our oxygen data from both ponds, we used data loggers that recorded water temperature and DO every 10 min from 21 May 2016 to 2 November 2016. These optical sensors had better response and reliability than other types of oxygen probes (Almeida et al. Citation2014). We used Hoboware® Pro software (version 3.7.8) to calculate percent saturation from the oxygen data. This software used the DO and temperature measurement from the data logger, barometric pressure measurements from the HOBO® weather station and the conductivity logger installed in the pond.
While the simple ‘bookkeeping’ method described by Odum (Citation1956) has been used to calculate metabolism, it does not include error terms, nor does it estimate metabolism parameters from the data (Winslow et al. Citation2016). A number of models have been used to calculate metabolism in aquatic systems (e.g. Hanson et al. Citation2008; McNair et al. Citation2013, Citation2015; Winslow et al. Citation2016). While there is no ‘perfect’ model, we chose the Kalman model (Batt and Carpenter Citation2012), a state space model that uses a maximum likelihood estimation approach with a method of smoothing DO data (the Kalman filter). In addition to handling noisy DO data, this model accounts for two types of error; process and observation error. Calculations of daily GPP, R and NEP were made with this model using the R package lake metabolizer (Winslow et al. Citation2016). Values of GPP that were less than zero or R greater than zero (so-called impossible values) were removed from the analysis as suggested by Winslow et al. (Citation2016). Winslow et al. (Citation2016) suggests these impossible values may occur when physical processes such as wind mixing outweigh the importance of biological processes in influencing DO levels. Brothers et al. (Citation2017) found that wind-driven mixing and high littoral production likely lead to negative values of GPP in a small pond but found using a variety of models other than the bookkeeping model that constrain the values of GPP did not give results that were significantly different from the bookkeeping model. We used the Cole and Caraco (Citation1998) method, one of the most widely used methods for estimating k based on wind speed (Winslow et al. Citation2016).
Statistical analyses
We used JMP® version 12.1 (SAS, Cary, North Carolina, USA) for statistical analyses. To examine the differences in GPP, R and NEP between ponds we used paired t-tests comparing values on a daily basis. We also used paired t-tests to compare the differences in periphyton production and phytoplankton biomass between ponds. For the periphyton production, we used analysis of variance (ANOVA) with repeated measures (different time periods) to test the differences between ponds and nutrient treatments. We conducted analyses of covariance with unequal slopes (ANCOVA) for many of our tests, with the response variable (e.g. GPP, R, NEP, periphyton production, phytoplankton biomass) as the dependent variable, pond as the independent variable and temperature, light (PAR) or change in water level as the co-variable. Values for most variables were log-transformed (log10(value +1)) to improve normality. Since values for R, NEP and change in water levels were negative, minimum values were added to make the values positive before log transformation.
Results
Physical and chemical parameters
We observed several differences between the prairie and woodland ponds. The woodland pond had significantly higher pH, conductivity, alkalinity and hardness than the prairie pond but significantly lower dissolved inorganic phosphate (). The average water temperature in the prairie pond was lower than in the much larger woodland pond () with a greater range of daily temperatures in the prairie pond apparently responsible for this difference. Daily PAR was greater in the prairie pond because there is no shading of the pond at any time during the day. At the woodland pond, the surrounding trees prevented light from reaching the pond until the sun angle was such that it was nearly overhead. While daily PAR was greater at the prairie pond, the light penetrating into the water was greater in the woodland pond () likely due to the abundance of duckweed covering much of the water surface at the prairie pond. There was a period of drying in the prairie pond in July but significant rainfall in August–October resulted in a refilling of the pond ( and ). Changes in water level in both ponds were responsive to daily rainfall indicating that the small watersheds quickly delivered precipitation to the ponds (). The large jump in water level in the prairie pond from July 4 to July 19 came when the level sensor was not operating. During this time, 12.5 cm of rain fell resulting in the large increase. We found that the temperature at 20 cm in the pond bed was not significantly different from the temperature at the sediment-water interface (t-test – woodland pond: t110 = 1.0, p = 0.3; prairie pond: t109 = 0.8, p = 0.4) indicating there was likely no incoming groundwater to either pond, at least in the areas we tested for groundwater input.
Table 1. Physical and chemical parameters of the study sites.
Figure 2. Seasonal variation in mean daily water temperature, photosynthetic active radiation, light intensity at 10 cm below the water surface and change in water level since the beginning of the study for the prairie and woodland ponds. The daily rainfall for the area is also given. Lines are cubic spline fits to show the pattern of change.
Periphyton production
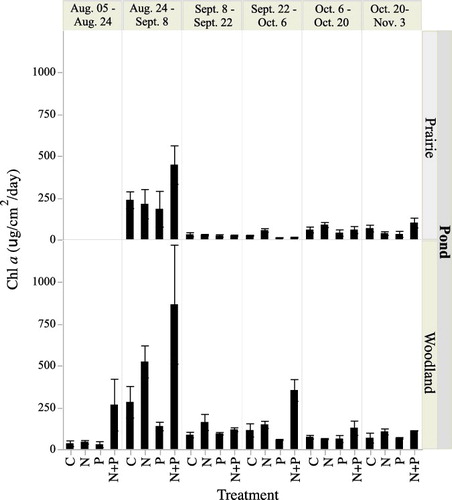
Periphyton production varied over time, between ponds and among different nutrient addition treatments (). Based on repeated measures ANOVA the woodland pond had higher production rates than the prairie pond (F1,103 = 90.9, p < 0.0001). The N+P treatment was significantly greater than the other treatments (F1,103 = 12.3, p < 0.0001 – tested with post hoc Tukey tests) mainly due to high levels of production in the N+P treatment in the woodland pond (there was a significant interaction term between pond and treatment – F3,103 = 92.9, p < 0.04 – tested with post hoc Tukey tests). We also examined whether temperature or PAR influenced periphyton production using the average temperature and the total PAR over the two-week deployment period as co-variables. There was no significant impact of temperature or the interaction of temperature and pond or treatment on periphyton production (temperature: F1,138 = 2.4, p = 0.15; temperature * pond: F1,138 = 0.002, p = 0.96; temperature * treatment: F3,138 = 0.14, p = 0.93; temperature * treatment * pond: F3,138 = 1.3, p = 0.3. However, increased PAR resulted in higher periphyton production (F1,139 = 8.6, p < 0.004) and there were significant interaction terms with pond (F1,138 = 7.3, p = 0.008) but not treatment (F3,138 = 0.1, p = 0.95).
Figure 3. Mean rate of daily periphyton production, measured as chlorophyll a, from the woodland and prairie ponds. Vertical bars are 1 standard deviation. Rates were determined over two week periods from August 5 to November 3. The influence of nutrient control on production was measured by adding nitrogen, phosphorus or nitrogen + phosphorus.
Phytoplankton biomass
Phytoplankton biomass was fairly constant over time in the woodland pond, while it was much more variable in the prairie pond (). A paired t-test showed greater phytoplankton biomass in the prairie pond than in the woodland pond (t10 = 5.2, p = 0.0004). For both ponds, phytoplankton biomass declined from early June through early July then increased dramatically in the prairie pond as it began to dry (). The extremely high values in the prairie pond in July occurred when the pond was almost completely dry and we noted significant numbers of filamentous green algae. As the prairie pond refilled, phytoplankton levels tended to decline gradually until the end of the study in November. We examined whether temperature or PAR had an influence on phytoplankton biomass using either the previous two-week total PAR or mean temperature as the co-variables (). Temperature and the interaction between temperature and pond had significant impacts on biomass. Phytoplankton biomass increased with temperature in the prairie pond but remained relatively flat in the woodland pond (ANCOVA – pond: F1,65 = 129.8, p < 0.0001 temperature: F1,65 = 24.6, p < 0.0001; temperature * pond: F1,65 = 14.4, p = 0.0003). There was no significant impact of PAR or the interaction of PAR and pond on phytoplankton biomass (PAR: F1,65 = 0.9, p = 0.4; pond * PAR: F1,65 = 0.5, p = 0.8).
Figure 4. Mean standing crop biomass, as chlorophyll a, of phytoplankton from the prairie and woodland ponds. Lines are cubic spline fits to show the pattern of change. Measurements were made from June 8 to November 3.
Figure 5. Relationships between mean daily water temperature and photosynthetically active radiation (PAR) and phytoplankton biomass. Lines are from the ANCOVA analysis and shaded areas are 95% confidence limits for the trend lines.
Pond metabolism
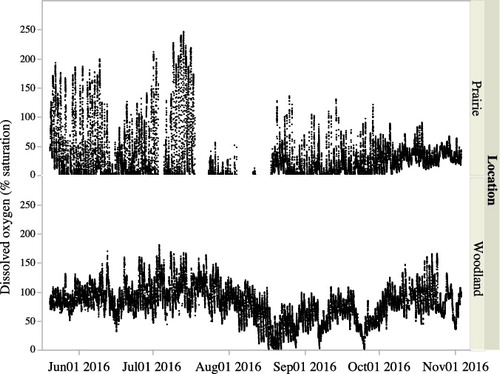
Pond oxygen levels varied daily as expected with much greater variability in the prairie pond (). For some days in July, the water level in the prairie pond fell below the level of the oxygen probes and resulted in some missing data. The prairie pond became hypoxic (<1% saturation) for 62% of the sampling days while the woodland pond became hypoxic for only 4% of the days (4 days in late August and 2 days in September). And while the level of supersaturation in prairie pond sometimes exceeded woodland pond (up to 246% versus 180%) the woodland pond had 23% of its oxygen readings exceeding 100% compared to only 8% for prairie pond. While we cannot rule out groundwater input into our ponds given the limited nature of our examinations we suspect that the majority of oxygen changes are likely due to photosynthesis and respiration and not from incoming groundwater, which can influence DO readings and calculations of metabolism (Sand-Jensen and Staehr Citation2007; Christensen et al. Citation2013).
Figure 6. Oxygen saturation levels for the prairie and woodland ponds from May 21 to November 2. Days of missing data in July in the prairie pond are times when the pond level fell below the level of the oxygen probes.
Out of 302 daily metabolism measurements, 52 (17%) represented so-called impossible measurements (GPP < 0 or R > 0). Only two of these impossible measurements were for R > 0. The majority of the impossible measurements (79%) were from the prairie pond. Mean daily wind speeds were significantly greater at the prairie pond and on days with impossible measurements (two-way ANOVA – pond: F1,300 = 10.0, p = 0.002; impossible measurements: F1,300 = 7.6, < 0.006).
We observed differences in GPP, R and NEP between the ponds over time (). GPP was higher on average in the prairie pond than the woodland pond (8.8 and 5.0 mg O2/L/day, respectively; t92 = 4.1, p < 0.0001). GPP increased from May through early July and then remained fairly stable until November in the woodland pond (). In the prairie pond, GPP decreased from May as the pond dried in July, rebounded in August as the pond refilled and began to decline again until the end of the study in November (). On average R was greater (i.e. more negative) in the prairie pond than in the woodland pond (−48.0 and −38.9 mg O2/L/day, respectively; t92 = 2.1, p = 0.04). R was greatest (most negative) in the prairie pond starting in May then decreased through July, reaching its minimum values as the pond was drying in July (). It increased slightly after the pond refilled in August and remained fairly constant through the fall. In the woodland pond, R increased from May through mid-July then decreased again, remaining nearly constant throughout the rest of the study and at the same levels as the prairie pond. NEP in the prairie pond was slightly greater (more negative) than in the woodland pond (−39.2 and −33.9 mg O2/L/day, respectively) but they were not significantly different (t92 = 1.4, p = 0.18). The pattern of change in NEP in the ponds is essentially the same as that for R ().
Figure 7. Daily rates of gross primary production (GPP), respiration (R) and net ecosystem production (NEP) for the prairie and woodland ponds from May 21 to November 2. Lines are cubic spline fits to show the pattern of change.
Water temperature and PAR both had significant influences on GPP and R (). An increase in temperature was correlated with increased GPP in both ponds and while there was no significant difference in the slopes, temperature appeared to have slightly more impact in the prairie pond (ANCOVA – temp: F1,247 = 7.3, p = 0.007; pond: F1,247 = 14.3, p = 0.0002; temp * pond: F1,247 = 3.2, p = 0.07). PAR likewise had a positive relationship with GPP in both ponds ( – ANCOVA – PAR: F1,247 = 48.2, p < 0.0001; pond: F1,247 = 4.6, p = 0.03; PAR * pond; F1,247 = 1.8, p = 0.2). Respiration increased (i.e. became more negative) with temperature in both ponds ( – ANCOVA – temp: F1,247 = 13.5, p = 0.0003). At any temperature, R was lower in the woodland pond than the prairie pond (ANCOVA – pond: F1,247 = 10.4, p = 0.0014), but both responded to temperature in a similar way (temp * pond; F1,247 = 0.25, p = 0.3). Respiration was also higher (i.e. more negative) at higher PAR levels ( – ANCOVA – PAR: F1,247 = 5.7, p < 0.0001) with the relationship being stronger at the prairie pond (ANCOVA – PAR * pond: F1,247 = 14.0, p = 0.0002). GPP and R varied with changes in pond water level. GPP increased as pond water levels decreased ( – ANCOVA – pond: F1,247 = 12.2, p < 0.0006, water level: F1,247 = 6.1, p = 0.01, pond * water level: F1,247 = 0.2, p = 0.5). R, however, decreased (i.e. became less negative) with increasing water level similarly in both ponds (ANCOVA – pond: F1,247 = 12.1, p < 0.0001, water level: F1,247 = 26.8, p < 0.0001, pond * water level: F1,247 = 2.9, p = 0.09).
Figure 8. Relationships between mean daily water temperature, photosynthetically active radiation (PAR) and changes in water level since the beginning of the study and gross primary production (GPP) and respiration (R). Lines are from the ANCOVA analysis and shaded areas are 95% confidence limits for the trend lines.
Discussion
The two ponds examined in this study had different hydroperiods, one a permanent pond and one a pond that dried almost completely in the summer and refilled in the fall. There were significant differences in many of the functional attributes of these ponds that might be the result of these differences as well as differences in the surrounding watershed (prairie versus woodland). The prairie pond had higher GPP and R (throughout most of the sampling period) and phytoplankton biomass while the NEP was not significantly different between the ponds. The rate of periphyton production was greater in the woodland pond than in the prairie pond, especially with nutrient enrichment.
Periphyton plays an important role in nutrient cycling and primary production in aquatic systems and can also be a good indicator of water quality (Smith and Lee Citation2006). Nutrient co-limitation of periphyton typically occurs when the total N:P ratio in an ecosystem is low (Harpole et al. Citation2011). Beck et al. (Citation2017) reviewed the impacts of environment, experimental setup and location on periphyton production in running waters and found a significant, but weak, relationship between nitrogen and phosphorus availability and the impacts of nutrient additions with greater availability of nutrients resulting in lesser impacts of nutrient additions on production. Although we did not measure the total N and P of the pond, the amount of dissolved inorganic nutrients was relatively low in the woodland pond but PO4 levels were high in the prairie pond. Despite these differences the response of periphyton to N or P alone was low in both ponds. We used similar methods as Dzialowski et al. (Citation2005) to determine the limitation mechanism in both ponds. Since production in the presence of added N+P was significantly greater than P, and neither N nor P was significantly greater than the control, we reached the conclusion that N and P are co-limiting, especially in the woodland pond. This mechanism is explained by N limitation in an excess of P, but after a substantial input of N, P quickly becomes the limiting nutrient. The responses to added nutrients were much lower in the prairie pond as might be expected given its higher phosphorus content. It appears that some other factor, likely light penetration, was limiting in the prairie pond.
Phosphorus is often considered to be the limiting nutrient in the growth of phytoplankton (Schindler Citation2012), although in some circumstances nitrogen may be limiting (Mischler et al. Citation2014). Gołdyn et al. (Citation2015) indicate that ponds with shorter hydroperiods tend to have increased levels of nutrients and Klotz and Linn (Citation2001) indicated that there is a release of phosphorus from sediments after rewetting, which could have happened over the course of the drying and refilling in the prairie pond and may partially explain why the prairie pond had significantly greater levels of dissolved inorganic phosphate and greater amount of phytoplankton than the woodland pond. In addition the higher phosphorus content makes the prairie pond a more suitable environment for blue-green algae, as phosphorus is the main factor influencing their abundance (Carpenter Citation2008). Also a statistically greater amount of PAR reaching the prairie pond may help explain the greater phytoplankton biomass. Cyanobacteria generally settle near the surface in turbid environments (Schriver et al. Citation1995) and as a result, phytoplankton may be more responsive to PAR than the light level reaching 10 cm below the surface. This may explain the discrepancy between greater phytoplankton and lesser periphyton in the prairie pond compared to the woodland pond as excess blue-green algae outcompete other phytoplankton species for light at the surface of the pond (Paelr and Ustach Citation1982; Smith and Gilbert Citation1995).
Assessing overall pond metabolism (NEP) helps to integrate production by phytoplankton, periphyton and the input of allochthonous material that supports NEP. There are a number of factors that can influence GPP and R and thus the overall level of NEP. These factors include nutrients (Hoellein et al. Citation2013; Klotz Citation2013; Solomon et al. Citation2013), light levels (Sand-Jensen and Staehr Citation2007), temperature (Yvon-Durocher et al. Citation2010, Citation2012) and pond size (Sand-Jensen and Staehr Citation2007; Staehr et al. Citation2012). Solomon et al. (Citation2013), examining a wide variety of lakes globally, found that mean annual GPP was positively correlated with total phosphorus as expected. However, while it is generally believed that systems with high levels of dissolved organic carbon should be heterotrophic and thus result in high levels of respiration, they did not find this to be the case. They did find that a high ratio of watershed area to lake volume was correlated with respiration, suggesting that the input of allochthonous material can drive heterotrophy. In our study, GPP was higher in the prairie pond, especially early in our study. The higher GPP in this pond may be due to the higher level of PAR that reaches this pond and greater phosphorus content. It is consistent with the higher level of phytoplankton biomass in this pond. The fact that periphyton levels in the control treatment were greater in the woodland pond suggests that phytoplankton production is likely responsible for the higher GPP in the prairie pond. PAR also had a positive relationship with GPP within each pond, but more so in the prairie pond. Given the presence of duckweed that resulted in less light penetrating the pond surface in the prairie pond, the increased PAR may help to ameliorate the shading effect of these floating-leaved plants.
A variety of primary producers can contribute to GPP in ponds. Camacho et al. (Citation2016) found a seasonal change in GPP correlated with different communities of primary producers in a Mediterranean temporary pond, with an early season growth of submerged macrophytes being primarily responsible for GPP, while later in the season when these macrophytes began to decay the nutrients they released appeared to be responsible for an increase in GPP due to phytoplankton growth. Overall the pond was autotrophic except for the period right after macrophyte decomposition. Laas et al. (Citation2012) also found seasonal switching between autotrophy and heterotrophy in a shallow, eutrophic, polymictic lake with the switching apparently related to peaks of phytoplankton production. In our study, we did not find changes in GPP in the woodland pond despite the presence of macrophytes. While it is possible that the location of our oxygen sensor could influence the ability to detect changes due to the macrophytes, the fact that we measured changes over a long period of time seems to provide adequate information to assess differences in metabolism between ponds (Van de Bogert et al. Citation2012). Despite the presence of submerged macrophytes in the woodland pond, GPP was lower than the prairie pond, and it remained relatively constant over the course of this study. This was also true for the phytoplankton biomass in this pond. While NO3 levels were similar between the ponds, PO4 levels were lower in the woodland pond. Thus nutrient limitation may be responsible for the relatively constant levels of GPP and phytoplankton biomass and the modest impacts of PAR on GPP in the woodland pond. These findings are also consistent with the findings from our periphyton nutrient addition experiments. The periphyton production did not differ between ponds for the control treatments. It is possible that the periphyton are restricted by nutrients in the woodland pond and by light in the prairie pond where light penetration to 10 cm below the surface was lower than in the prairie pond. When N+P was added the periphyton production response was greater in the woodland pond suggesting that as nutrient limitation is relaxed, the greater light penetration allowed for this greater production.
Water level may influence GPP in ponds. Staehr et al. (Citation2012) found GPP decreased with increasing water levels while Laas et al. (Citation2012) found no relationship between GPP and water level. In our study, GPP generally decreased with increasing water level in the both ponds, but the relationship was less robust in the woodland pond. Staehr et al. (Citation2012) found increasing R with water depth while Laas et al. (Citation2012) found decreasing R with increasing water. In our study, R increased in both of our ponds with depth. Christensen et al. (Citation2013) found that GPP and R increased during drying in a Swedish pond slightly larger and deeper than our prairie pond where GPP declined and R increased during drying.
Hoellein et al. (Citation2013) indicated that temperature variation was less important in influencing GPP in aquatic systems than other factors. We found that temperature changes over the course of the study had lesser impact on GPP in the woodland pond while it had greater impact in the prairie pond. There was a lower average daily temperature in the prairie pond that should result in lower GPP than the woodland pond, but this was not the case. The greater range of temperatures in the prairie pond meant that it was warmer during the day when photosynthesis was occurring potentially resulting in higher GPP. The moderate response of GPP to temperature again suggests that low nutrient levels, especially phosphorus, were the limiting factor in the woodland pond.
Yvon-Durocher et al. (Citation2010, Citation2012), indicate that while GPP may be somewhat temperature insensitive, ecosystem R is temperature-dependent across a wide range of ecosystems including aquatic systems. This was the case in our study where increasing temperature resulted in higher R (i.e. more negative) in both ponds and had a greater impact on R in the prairie pond. It is possible that the lower production in the woodland pond resulted in a restriction in R due to a lack of food resources. Increased PAR which resulted in increased GPP in the prairie pond and to a lesser degree in the woodland pond suggests a connection between GPP and R. Correlations between GPP and R have been noted in a number of other studies (Sand-Jensen and Staehr Citation2007; Van de Bogert et al. Citation2012; Klotz Citation2013).
Àvila et al. (Citation2016) suggest that many temporary ponds are heterotrophic because of the input of allochthonous materials. Hanson et al. (Citation2003) found that while many lakes have net negative NEP, phosphorus levels tend to be driving GPP while dissolved organic carbon, likely derived from exogenous sources drives R. Rubbo et al. (Citation2006) found that experimentally removing leaf litter from ponds led to a decline in R but no change in GPP suggesting that R, influenced by allochthonous inputs, drives NEP. Sand-Jensen and Staehr (Citation2007) and Solomon et al. (Citation2013) similarly found that exogenous sources of organic material also supplemented within pond production. Both of our ponds are heterotrophic with respiration driving NEP in these ponds. The more heterotrophic prairie pond had a much greater contact between the bottom of the pond and the water than the woodland pond (bottom surface area:volume ratio is 3.9 m−1 for the prairie pond compared to 1.1 m−1 for the woodland pond) which is likely partially responsible for the high frequency of periods of nighttime hypoxia.
Tsai et al. (Citation2016) found that NEP decreased with decreases in water level in a mesotrophic subtropical lake, likely due to a change in stratification pattern and the concentration of nutrients in a lower volume lake. Most of the change was attributed however to a greater reduction in R than an increase in GPP. As Rose and Crumpton (Citation2006) point out hydroperiod can influence the degree to which emergent vegetation dominates wetlands resulting in shifts between aerobic and anaerobic metabolism. NEP varied over time and between the ponds, with the prairie pond being more heterotrophic than the woodland pond early in the season and then being less heterotrophic later in the season. In both of our ponds NEP increased (i.e. became more negative) with decreasing water level. This was especially pronounced in the prairie pond. However, over the course of the entire study the levels of NEP averaged out to be the same in the two ponds.
Solomon et al. (Citation2013) provide an overview of metabolism among a global network of 23 lakes (from GLEON – Global Lake Ecological Observation Network) for which appropriate data were available. As mentioned above, their study indicated that total phosphorus was correlated with GPP while allochthonous input was correlated with R. In their analysis they only had one small lake (Mirror Lake in Connecticut, US) that was similar in size to those examined in our study. In Mirror Lake, GPP varied from near zero to 15 mg O2/L/day while R ranged from near zero to 15 mg O2/L/day; March–October). This lake was heterotrophic on an annual basis (NEP −0.38 mg O2/L/day) while it was autotrophic during the summer (NEP 0.18 mg O2/L/day). While a few other published studies estimate pond metabolism, only four recent studies (in addition to Solomon et al. Citation2013) used the open water method of estimating pond metabolism (López-Archilla et al. Citation2004; Geertz-Hansen et al. Citation2011; Christensen et al. Citation2013; Klotz Citation2013). All of these studies reported their results on an areal basis, whereas we report our results on a volumetric basis. We took areal estimates from these three studies and converted them to volumetric estimates based on the depths provided. López-Archilla et al. (Citation2004) reported a range of GPP, R and NEP values that varied with season and water depth in a shallow coastal lake in Spain. On average GPP was 2.9 mgO2/l/day, R was 3.2 mg O2/L/day resulting in a NEP of −0.3 mg O2/L/day indicating the lake was slightly heterotrophic. Geertz-Hansen et al. (Citation2011) examined nine lagoons in a temporary Mediterranean marsh and found GPP ranged from 1.8 to 8.7 mgO2/l/day, R ranged from 0.1 to 2.8 mgO2/l/day and NEP ranged from 2.7 to 2.8 mgO2/l/day. All lagoons were found to be autotrophic mainly due to benthic production. Christensen et al. (Citation2013) studying a small pond that developed in an abandoned quarry found GPP averaged 3.1 mg O2/L/day, R averaged 2.9 mg O2/L/day and NEP averaged 0.3 mg O2/L/day. Again the pond was autotrophic, although when estimating metabolism with changes in CO2 they found it to be heterotrophic. They indicate this was likely due to dissolved inorganic carbon input from the surrounding limestone mimicking respiration. Klotz (Citation2013), studying two beaver ponds, found average GPP of 3.6–7.1 2 mg O2/L/day, R of 4.2–5.32 mg O2/L/day and NEP averaging −0.6–1.62 mg O2/L/day. Thus one pond was autotrophic and the other heterotrophic. Over the course of our study GPP averaged 8.8 and 5.0 mg O2/L/day, R averaged −48.0 and −38.9 2 mg O2/L/day and NEP averaged −39.2 and −33.9 mg O2/L/day for the prairie and woodland ponds, respectively. Thus, while our study showed GPP results as high as these other studies, the high levels of R in these ponds was responsible for a high level of heterotrophy. The high level of respiration in the prairie pond is not unexpected given the large amount of organic matter that accumulates in the pond resulting in almost daily anoxia. However, the high rates of respiration in the woodland pond are more difficult to explain. While there were low levels of phytoplankton and periphyton production, the large amount of the submerged macrophyte Najas may have provided enough decomposing organic matter to support high levels of respiration. The difference in the degree of autotrophy or heterotrophy among ponds studied with open water oxygen techniques suggests the need for additional research, especially for ponds with different hydroperiods.
Particularly crucial is the need for more research on the models used to estimate pond metabolism from DO. There are many sources of error in estimating various estimates of metabolism and many models have been derived from studies on larger lakes and permanent ponds (Winslow et al. Citation2016 and references therein). The fact that metabolism measures could not be accurately obtained from a number of days in our study, especially in the prairie pond, indicates the need for additional research on appropriate methods for estimating these parameters.
Conclusions
Production in the permanent, woodland pond was likely limited by nutrients since we found constant GPP throughout the study period and little impact of light, temperature or water level. This pond also had relatively constant levels of phytoplankton biomass, and periphyton production when not enriched with nutrients. In the temporary, prairie pond GPP varied with temperature, light and water level, with variation in phytoplankton biomass and lower response in periphyton growth to nutrient additions, suggesting less control by nutrient limitation than the woodland pond. While these ponds are quite different in many aspects, surprisingly the NEP over the course of the study was not significantly different.
In the United States, small water bodies (<0.01 km2) are not included in the National Lakes Assessment program that assists decision-makers and the public in allocating resources for aquatic resource protection (Peck et al. Citation2013). More research on small water bodies must be done in order to help programs like this realize their importance and make recommendations as lake responses to management are unpredictable and factors responsible for changes are often unclear (Hanson et al. Citation2017). Since small ponds may play an important role in carbon cycling and are likely to undergo changes in temperature and hydroperiod associated with climate change, understanding the metabolism of pond ecosystems provides useful information needed for making predictions about impacts and designing management schemes to help mitigate these impacts. If climate change were to drive more lakes towards becoming ponds and more ponds becoming wetlands there may be an increase in the degree of heterotrophy and the types of metabolism that dominate these waterbodies.
Acknowledgments
This research was part of a Fall 2016 Aquatic Ecology class and we thank Macalester College for providing material support. We are especially grateful to Jerald Dosch and Mike Anderson of the Katharine Ordway Natural History Study Area for logistical support and to colleagues from EREN (Ecological Research as Education Network: http://erenweb.org) for the inspiration to conduct this project. Thanks also to Ken Moffett Scientific Instrumentation technician for constructing many of the sampling devices used in the study.
Disclosure statement
No potential conflict of interest was reported by the authors.
Additional information
Funding
Notes on contributors
Daniel J. Hornbach
Daniel J. Hornbach is an aquatic ecologist and professor of Biology and Environmental Studies at Macalester College.
Mark C. Hove
Mark C. Hove is a biologist working with Macalester College and the University of Minnesota where he studies aquatic ecology.
Mira W. Ensley-Field
Mira W. Ensley-Field is an undergraduate student at Macalester College and is a member of the Fall 2016 Aquatic Ecology class in which this research was conducted.
Matthew R. Glasenapp
Matthew R. Glasenapp is an undergraduate student at Macalester College and is a member of the Fall 2016 Aquatic Ecology class in which this research was conducted.
Ian A. Goodbar
Ian A. Goodbar is an undergraduate student at Macalester College and is a member of the Fall 2016 Aquatic Ecology class in which this research was conducted.
J. Douglas Harman
J. Douglas Harman is an undergraduate student at Macalester College and is a member of the Fall 2016 Aquatic Ecology class in which this research was conducted.
Benjamin D. Huber
Benjamin D. Huber is an undergraduate student at Macalester College and is a member of the Fall 2016 Aquatic Ecology class in which this research was conducted.
Emily A. Kangas
Emily A. Kangas is an undergraduate student at Macalester College and is a member of the Fall 2016 Aquatic Ecology class in which this research was conducted.
Kira X. Liu
Kira X. Liu is an undergraduate student at Macalester College and is a member of the Fall 2016 Aquatic Ecology class in which this research was conducted.
Molly Stark-Ragsdale
Molly Stark-Ragsdale is an undergraduate student at Macalester College and is a member of the Fall 2016 Aquatic Ecology class in which this research was conducted.
Long K. Tran
Long K. Tran is an undergraduate student at Macalester College and is a member of the Fall 2016 Aquatic Ecology class in which this research was conducted.
References
- Ali S, Mishra PK, Islam A, Alam NM. 2016. Simulation of water temperature in a small pond using parametric statistical models: implications of climate warming. J Environ Eng. 142:04015085-1-14.
- Almeida GH, Boëchatb IG, Gückerb B. 2014. Assessment of stream ecosystem health based on oxygen metabolism: which sensor to use? Ecol Eng. 69:134–138.
- Anderson MP. 2005. Heat as a ground water tracer. Ground Water. 43:951–968.
- Arar EJ, Collins GB. 1997. In vitro determination of chlorophyll a and pheophytin a in marine and freshwater algae by fluorescence. Cincinnati (OH): National Exposure Research Laboratory Office of Research and Development U.S. Environmental Protection Agency; EPA publication; method no. 445.0. [ accessed 2015 Dec 13]. http://permanent.access.gpo.gov/lps68140/m445-0.pdf
- Àvila N, López-Flores R, Boix D, Gascón S, Quintana XD. 2016. Environmental factors affecting the balance of autotrophs versus heterotrophs in the microbial food web of temporary ponds. Hydrobiologia. 782:127–143.
- Batt RD, Carpenter SR. 2012. Free-water lake metabolism:addressing noisy time series with a Kalman filter. Limnol Oceanogr-Meth. 10:20–30.
- Bauder, ET. 2005. The effects of an unpredictable precipitation regime on vernal pool hydrology. Freshwater Biol. 50:2129–2135.
- Beck WS, Rugenski AT, Poff NL. 2017. Influence of experimental, environmental, and geographic factors on nutrient-diffusing substrate experiments in running waters. Freshwater Biol. 62:1667–1680.
- Bortolotti LE, Vinebrooke RD, St. Louis VL. 2016. Prairie wetland communities recover at different rates following hydrological restoration. Freshwater Biol. 61:1874–1890.
- Brooks, RT. 2009. Potential impact of global climate change on the hydrology and ecology of ephemeral freshwater systems of the forests of the northeastern United States. Clim Change. 95:469–483.
- Brothers S, Lazanjian G, Köhler J, Scharfenberger U, Hilt S. 2017. Convective mixing and high littoral production established systematic errors in the diel oxygen curves of a shallow, eutrophic lake. Limnol Oceanogr-Meth. 15:429–435.
- Cael BB, Seekell DA. 2016. The size-distribution of Earth's lakes. Sci Rep-UK. 6:29633. doi:10.1038/srep29633
- Camacho A, Murueta N, Blasco E, Santamans AC, Picazo A. 2016. Hydrology-driven macrophyte dynamics determines the ecological functioning of a model Mediterranean temporary lake. Hydrobiologia. 774:93–107.
- Carpenter SR. 2008. Phosphorus control is critical to mitigating eutrophication. Natl Acad Sci USA. 105:11039–11040.
- Chandler HC, Rypel AL, Jiao Y, Haas CA, Gorman TA. 2016. Hindcasting historical breeding conditions for an endangered salamander in ephemeral wetlands of the southeastern USA: implications of climate change. PLoS One. 11(2):e0150169. doi:10.1371/journal.pone.0150169
- Christensen JP, Sand-Jensen AK, Staehr PA. 2013. Fluctuating water levels control water chemistry and metabolism of a charophyte-dominated pond. Freshwater Biol. 58:1353–1365.
- Cole JJ, Caraco NF. 1998. Atmospheric exchange of carbon dioxide in a low-wind oligotrophic lake measured by the addition of SF6. Limnol Oceanogr. 43:647–656.
- Cole JJ, Prairie YT, Caraco NF, McDowell WH, Tranvik LJ, Striegl RG, Duarte CM, Kortelainen P, Downing JA, Middelburg JJ, et al. 2007. Plumbing the global carbon cycle: integrating inland waters into the terrestrial carbon budget. Ecosystems. 10:171–184.
- Dillon PJ, Rigler FH. 1974. The phosphorus-chlorophyll relationship in lakes. Limnol Oceanogr. 19:767–773.
- Downing JA. 2010. Emerging global role of small lakes and ponds: little things mean a lot. Limnetica. 29:9–24.
- Downing JA, Prairie YT, Cole JJ, Duarte CM, Tranvik LJ, Striegl RG, McDowell WH, Lortelainen P, Caraco NF, Melack JM, et al. 2006. The global abundance and size distribution of lakes, ponds, and impoundments. Limnol Oceanogr. 51:2388–2397.
- Dzialowski AR, Wang S, Lim N, Spotts WW, Huggins DG. 2005. Nutrient limitation of phytoplankton growth in central plains reservoirs. USA J Plankton Res. 27:587–595.
- Evtimova VV, Donohue I. 2014. Quantifying ecological responses to amplified water level fluctuations in standing waters:an experimental approach. J Appl Ecol. 51:1282–1291.
- Flanagan KM, McCauley E. 2010. Experimental warming increases CO2 saturation in a shallow prairie pond. Aquat Ecol. 44:749–759.
- Geertz-Hansen O, Montes C, Duarte CM, Sand-Jensen K, Marbá N, Grillas P. 2011. Ecosystem metabolism in a temporary Mediterranean marsh (Doñana National Park, SW Spain). Biogeosciences. 8:963–971.
- Gingerich RT, Merovich G, Anderson JT. 2014. Influence of environmental parameters on litter decomposition in wetlands in West Virginia, USA. J Freshwater Ecol. 29:535–549.
- Gołdyn B, Kowalczewska-Madura K, Celewicz-Gołdyn S. 2015. Drought and deluge: influence of environmental factors on water quality of kettle holes in two subsequent years with different precipitation. Limnologica. 54:14–22.
- Hall RO, Tank JL. 2005. Correcting whole-stream estimates of metabolism for groundwater input. Limnol Oceanogr-Meth. 3:222–229.
- Hanson MA, Herwig BR, Zimmer KD, Hansel-Welch N. 2017. Rehabilitation of shallow lakes: time to adjust expectations? Hydrobiologia. 787:45–59.
- Hanson PC, Bade DL, Carpenter SR, Kratz TK. 2003. Lake metabolism: relationships with dissolved organic carbon and phosphorus. Limnol Oceanogr. 48:1112–1119.
- Hanson PC, Carpenter SR, Kimura N, Wu C, Cornelius SP, Kratz TK. 2008. Evaluation of metabolism models for free-water dissolved oxygen methods in lakes. Limnol Oceanogr-Meth. 6:454–465.
- Harpole WS, Ngai JT, Cleland EE, Seabloom EW, Borer ET, Bracken MES, Elser JJ, Grunner DS, Hillebrand H, Shurin JB, et al. 2011. Nutrient co-limitation of primary producers communities. Ecol Lett. 14:852–862.
- Holgerson MA, Raymond PA. 2016. Large contribution to inland water CO2 and CH4 emissions from very small ponds. Nat Geosci. 9:222–228.
- Hoellein TJ, Bruesewitz DA, Richardson DC. 2013. Revisiting Odum (1956): a synthesis of aquatic ecosystem metabolism. Limnol Oceanogr. 58:2089–2100.
- Jeppesen E, Meerhoff M, Davidson TA, Trolle D, Søndergaard M, Lauridsen TL, Bekilğlu M, Brucet S, Volta P, González-Bergonzoni I, et al. 2014. Climate change impacts on lakes: an integrated ecological perspective based on a multi-faceted approach, with special focus on shallow lakes. J Limnol. 73:84–107.
- Klotz RL. 2013. Factors driving the metabolism of two north temperate ponds. Hydrobiologia. 711:9–17.
- Klotz RL, Linn SA. 2001. Influence of factors associated with water level drawdown on phosphorus release from sediments. Lake Reserv Manage. 17:48–54.
- Kneitel JM. 2014. Inundation timing, more than duration, affects the community structure of California vernal pool mesocosms. Hydrobiologia. 732:71–83.
- Kniffin M, Neill C, McHorney R, Gregory G. 2009. Nutrient limitation of periphyton and phytoplankton in Cape Cod coastal plain ponds. Northeast Nat. 16:395–408.
- Laas A, Nõges P, Kõiv T, Nõges T. 2012. High-frequency metabolism study in a large and shallow temperate lake reveals seasonal switching between net autotrophy and net heterotrophy. Hydrobiologia. 694:57–74.
- Liboriussen L, Jeppesen E. 2003. Temporal dynamics in epipelic, pelagic and epiphytic algal production in a clear and turbid shallow lake. Freshwater Biol. 48:418–431.
- Loeb SL, Reuter JE, Goldman CR. 1983. Littoral zone production of oligotrophic lakes: the contributions of phytoplankton and periphyton. In: Wetzel RG, editor. Proceedings of the first international workship on periphyton of freshwater ecosystems held in Växjö; Sep 14–17; Sweden. The Hague: Dr. W. Junk Publishers. p. 161–167.
- Long MH, Rheuban JE, Berg P, Zieman JC. 2012. A comparison and correction of light intensity loggers to photosynthetically active radiation sensors. Limnol Oceanogr-Meth. 10:416–424.
- López-Archilla AI, Mollá S, Coleto MC, Guerrero MC, Montes C. 2004. Ecosystem metabolism in a Mediterranean shallow lake (Laguna de Santa Olalla, Doñana National Park, SW Spain. Wetlands. 24:848–858.
- Marton JM, Creed IF, Lewis DB, Lane CR, Basu NB, Cohen MJ, Craft CB. 2015. Geographically isolated wetlands are important biogeochemical reactors on the landscape. Bio Sci. 65:408–418.
- McNair JN, Gereaux LC, Weinke AD, Sesselmann MR, Kendall ST, Biddanda BA. 2013. New methods for estimating components of lake metabolism based on free-water dissolved oxygen dynamics. Ecol Model. 263:251–263.
- McNair JN, Sesselmann MR, Kendall ST, Gereaux LC, Weinke AD, Biddanda BA. 2015. Alternative approaches for estimating components of lake metabolism using the free-water dissolved-oxygen (FWDO) method. Fund Appl Limnol. 186:21–44.
- Mischler JA, Taylor PG, Townsend AR. 2014. Nitrogen limitation of pond ecosystems on the plains of Eastern Colorado. PLoS One. 9(5):e95757. doi:10.1371/journal.pone.0095757
- Moss B. 2012. Cogs in the endless machine: lakes, climate change and nutrient cycles: a review. Sci Total Environ. 434:130–142.
- Naiman RJ, Melillo JM, Hobbie JE. 1986. Ecosystem alteration of boreal forest streams by beaver (Castor canadensis). Ecology. 67:1254–1269.
- Odum HT. 1956. Primary production in flowing waters. Limnol Oceanogr. 1:102–117.
- Oki T, Kanae S. 2006. Global hydrological cycles and world water resources. Science. 313:1068–1072.
- Peck DV, Olsen AR, Weber MH, Paulsen SG, Peterson C, Holdsworth SM. 2013. Survey design and extent estimates for the National Lakes Assessment. Freshw Sci. 32:1231–1245.
- Paelr HW, Ustach JF. 1982. Blue-green algal scums: an explanation for their occurrence during freshwater blooms. Limnol Oceanogr. 27:212–217.
- Pyke CR. 2005. Assessing climate change impacts on vernal pool ecosystems and endemic branchiopods. Ecosystems. 8:95–105.
- Reverey F, Grossart H, Premke K, Lischeid G. 2016. Carbon and nutrient cycling in kettle hole sediments depending on hydrological dynamics: a review. Hydrobiologia. 775:1–20.
- Rohia T, Laurion I, Rautio M. 2015. Carbon dynamics in highly heterotrophic subarctic thaw ponds. Biogeosciences. 12:7223–7235.
- Rose C, Crumpton WG. 2006. Spatial patterns in dissolved oxygen and methane concentrations in a prairie pothole wetland in Iowa, USA. Wetlands. 26:1020–1025.
- Rosset V, Oertli B. 2011. Freshwater biodiversity under climate warming pressure: identifying the winners and losers in temperate standing waterbodies. Biol Conserv. 144:2311–2319.
- Rubbo MJ, Cole JJ, Kiesecker JM. 2006. Terrestrial subsidies of organic carbon support net ecosystem production in temporary forest ponds: evidence from an ecosystem experiment. Ecosystems. 9:1170–1176.
- Sand-Jensen K, Staehr PA. 2007. Scaling of pelagic metabolism to size, trophy and forest cover in small Danish lakes. Ecosystems. 10:127–141.
- Sand-Jensen K, Staehr PA. 2009. Net heterotrophy in lakes: a widespread over gradients in trophic and land cover. Ecosystems. 12:336–348.
- Schindler DW. 1977. Evolution of phosphorus limitation in lakes. Sci-New Ser. 195:260–262.
- Schindler DW. 2012. The dilemma of controlling cultural eutrophication of lakes. Proc R Soc B. 279:4322–4333.
- Schindler DW. 1997. Widespread effects of climatic warming on freshwater ecosystems in North America. Hydrol Process. 11:1043–1067.
- Schriver P, Bøgestrand J, Jeppesen E, Søndergaard M. 1995. Impact of submerged macrophytes on fish-zooplankton-phytoplankton interactions: large scale enclosure experiments in a shallow eutrophic lake. Freshwater Biol. 33:255–270.
- Schriever TA, Williams DD. 2013. Influence of pond hydroperiod, size, and community richness on food-chain length. Freshwater Sci. 32:964–975.
- Shurin JB, Clasen JL, Greig HS, Kratina P, Thompson PL. 2012. Warming shifts top-down and botton-up control of pond food web struture and function. Phil Trans Soc B. 367:3008–3017.
- Smith AD, Gilbert JJ. 1995. Spatial and temporal variability in filament length of a toxic cyanobacterium (Anabaena affinis). Freshwater Biol. 33:1–11.
- Smith SDP. 2014. The roles of nitrogen and phosphorus in regulating the dominance of floating and submerged plants in a field mesocosm experiment. Aquat Bot. 112:1–9.
- Smith SM, Lee KD. 2006. Responses of periphyton to artificial nutrient enrichment in cold freshwater kettle ponds of Cape Cod National Seashore. Hydrobiologia. 571:201–211.
- Solomon CT, Bruesewitz DA, Richardson DC, Rose KC, Van de Bogert MC, Hanson PC, Kratz TK, Larget B, Adrian R, Babin BL, et al. 2013. Ecosystem respiration: drivers of daily variability and background respiration in lakes around the globe. Limnol Oceanogr. 58:849–866.
- Staehr PA, Baastrup-Spohr L, Sand-Jensen K, Stedmon C. 2012. Lake metabolism scales with lake morphometry and catchment conditions. Aquat Sci. 74:155–169.
- Trochine C, Guerrieri ME, Liboriussen L, Lauridsen TL, Jeppesen E. 2014. Effects of nutrient loading, temperature regime and grazing pressure on nutrient limitation of periphyton in experimental ponds. Freshwater Biol. 59:905–917.
- Tsai J, Kratz TK, Rusak JA, Shih WY, Liu WC, Tang SL, Chiu CY. 2016. Absence of winter and spring monsoon changes in water level and rapidly shifts metabolism in a subtropical lake. Inland Waters. 6:436–448.
- Van de Bogert MC, Bade DL, Carpenter SR, Cole JJ, Pace ML, Hanson PC, Langman OC. 2012. Spatial heterogeneity strongly affects estimates of ecosystem metabolism in two north temperate lakes. Limnol Oceanogr. 57:1689–1700.
- Vaughn CC, Spooner DE, Galbraith HS. 2007. Context-dependent species identity effects within a functional group of filter-feeding bivalves. Ecology. 88:1654–1662.
- Whitehead PG, Wilby RL, Battarbee RW, Kernan M, Wade AJ. 2009. A review of the potential impacts of climate change on surface water quality. Hydrol Sci J. 54:101–123.
- Williamson CE, Saros JE, Schindler DW. 2009a. Sentinels of change. Science. 323:887–888.
- Williamson CE, Saros JE, Vincent WF, Smol JP. 2009b. Lakes and reservoirs as sentinels, integrators, and regulators of climate change. Limnol Oceanogr. 54:2273–2282.
- Winslow LA, Zwart JA, Batt RD, Dugan HA, Woolway RI, Corman JR, Hanson PC, Read JS. 2016. LakeMetabolizer: an R package for estimating lake metabolism from free-water oxygen using diverse statistical models. Inland Waters. 6:622–636.
- Woodward G, Perkins DM, Brown LE. 2010. Climate change and freshwater ecosystems:impacts across multiple levels of organization. Philos T Royal Soc B. 365:2093–2106.
- Yvon-Durocher G, Allen AP, Montoya JM, Trimmer M, Woodward G. 2010. The temperature dependence of the carbon cycle in aquatic ecosystems. Adv Ecol Res. 43:267–313.
- Yvon-Durocher G, Caffrey JM, Cescatti A, Dossena M, del Giorgio P, Gasol JM, Montoya JM, Pumpanen J, Staehr PA, Trimmer M, et al. 2012. Reconciling the temperature dependence of respiration across timescales and ecosystem types. Nature. 487:472–476.
- Yvon-Durocher G, Hulatt CJ, Woodward G, Trimmer M. 2017. Long-term warming amplifies shifts in the carbon cycle of experimental ponds. Nat Clim Change. 7:209–213.