
 ?Mathematical formulae have been encoded as MathML and are displayed in this HTML version using MathJax in order to improve their display. Uncheck the box to turn MathJax off. This feature requires Javascript. Click on a formula to zoom.
ABSTRACT
We tested the response of several different water quality metrics at 6 sites along a 4-km alternating forest (canopied) and floodplain (non-canopied) reach of the East Branch of the Black River, an undisturbed northern Lower Michigan trout stream, during summer 2015. Physicochemical parameters were unchanged between sites and reflected an undisturbed continuum. In-stream woody debris was higher at the forest sites, whereas relative canopy cover and sunlight intensity were higher at the floodplain sites. Both benthic macroinvertebrates and adult caddisflies exhibited greater species richness and a higher abundance of shredders at the forest sites, and a higher abundance of scrapers at the floodplain sites. Fish specimen abundance, species richness, and percentage of trout were not different between sites, and instead all increased throughout the summer. Community respiration was unchanged between the single tested floodplain site and the forest sites upstream and downstream of it. Gross primary production and net daily metabolism were higher at the floodplain site, leading to stream autotrophy. This result was also obtained when tested in summer 2017. Our results support the idea that terrestrial habitat changes can singularly affect the fundamental ecological functioning of an undisturbed stream, primarily due to deviations in sunlight penetration and allochthonous input. Moreover, the short distances between sites with alternating results indicate the dynamic and serially discontinuous state of natural rivers.
Introduction
A fundamental assumption in stream ecology is that changes in riparian habitat will have important effects on stream morphometrics, organismal assemblages, and ecological functioning, even if these changes occur within a relatively short stretch of river (Thorp et al. Citation2006). One challenge to rigorously testing this idea is that terrestrial habitat changes, such as a loss of forest canopy cover, are frequently the result of recent or historical anthropogenic disturbance. Thus, multiple variables, such as sunlight penetration, flow regime, chemical input, and sedimentation, may change simultaneously with changes in riparian habitat, and each may have a different effect on the ecological functioning of the stream.
Many studies have suggested the singular importance of riparian canopy cover in affecting organismal assemblages (Detenbeck et al. Citation1990, Burkhead et al. Citation1997, Rios and Bailey Citation2006, Urban et al. Citation2006, Houghton et al. Citation2011, Houghton and Wasson Citation2013, Houghton et al. Citation2013), benthic metabolism (Fellows et al. Citation2006, Hornbach et al. Citation2015, Clapcott et al. Citation2016), and organic matter processing (Lagrue et al. Citation2011, de Nadaï-Monoury et al. Citation2014). In all of these studies, however, changes in riparian canopy cover was associated with changes in landuse or other aspects of stream conditions. Thus, the potential problem of multiple variables and their confounding effects was not completely eliminated.
The objective of this study was to assess the singular effect of riparian canopy cover on the ecological functioning of an undisturbed stream using multiple metrics. Specifically, we tested changes in stream habitat, several physicochemical parameters, benthic metabolism, and assemblages of benthic macroinvertebrates, adult caddisflies, and fish on a stream reach with naturally alternating forest and floodplain habitats. The goal of this multimetric approach was to simultaneously obtain a robust response to riparian habitat changes, and to assess how well these metrics individually reflected such changes.
Materials and methods
Study site
The East Branch of the Black River is a fourth-order stream arising in Montmorency County, Michigan. It flows northwesterly for ∼30 km until its confluence with the Main Branch of the Black River. Its watershed is surrounded by land with minimal anthropogenic disturbance, including the public Atlanta (113,000 ha) and Pigeon River Country (42,500) State Forests, and the private Black River Ranch (3,650) and Canada Creek Ranch (5,500) hunting and fishing preserves. As a result, the Black River and its tributaries are some of the best fisheries for the native brook trout (Salvelinus fontinalis Mitchill) in the eastern US (www.upperblack.org).
Several km of the East Branch pass through the Black River Ranch in Montmorency County. The Ranch is composed mostly of primary and secondary growth of eastern white pine (Pinus strobus L.) and other conifers, and has not been logged in >100 years. Aside from a small airstrip, ∼100 km of dirt trails, and one cluster of buildings, the property is undisturbed, and is primarily used for elk hunting, trout fishing, and non-motorized recreation (www.blackriverranch.org). A recent study of the caddisfly fauna of the lakes and streams of the Ranch documented one of the most species rich assemblages of any area of Michigan, Minnesota, or Wisconsin. In addition, of 438 individual lakes and streams sampled from the three states during the last 15 years, the nearby Main Branch of the Black River recently yielded the most caddisfly species (66) ever collected from a single night of sampling (Houghton Citation2016).
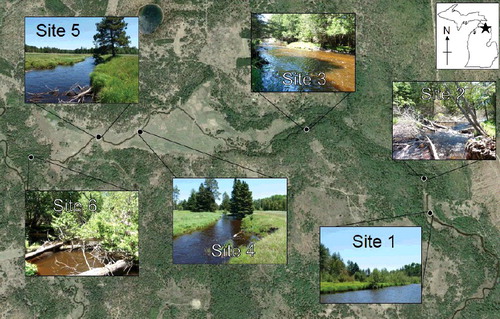
Six sites of the East Branch within the Black River Ranch were sampled during this study. Due to its unregulated condition and low base flow, the river is prone to flooding. Thus, some low riparian areas are not conducive to tree growth and are naturally devoid of canopy cover (). In our study, site 1 was in a floodplain, sites 2 and 3 in forest, sites 4 and 5 in floodplain, and site 6 in forest. The alternating forest and floodplain habitats along a relatively short (∼4 km) continuum provided a unique opportunity to study the effects of abrupt riparian changes on an otherwise undisturbed stream.
Figure 1. The east branch of the Black River within the Black River Ranch, showing the location and images of our six study sites. River flow is westerly. Landscape photo from Google Earth, taken in May 2011. Site photos by the authors.
Stream physicochemistry and habitat
Physicochemical measurements were made approximately weekly from 16 May to 10 July 2015. All measurements were made between 1:00 and 3:00 pm to minimize diel fluctuations in temperature and sunlight exposure. All sampling occurred ∼5 cm below the water surface. For measurements not made on site, water samples were stored at room temperature in 1 L high-density polyethylene bottles and transported to the laboratory. Three samples were collected at each site on each date for each physicochemical parameter, and the mean value for each was determined.
Specific conductance (ECTestr Low, Vernon Hills, IL, www.eutechinst.com), pH (AccuMet AP61, Pittsburg, PA, www.fishersci.com), temperature (YSI-55, Yellow Springs, OH, www.ysi.com), and dissolved oxygen (DO) (YSI-55, Yellow Springs, OH, www.ysi.com) measurements were all made on-site. Water alkalinity to pH 4.6 was measured by laboratory titration with 0.05 M hydrochloric acid (HCL) in 50 mL of river water using bromcresol green as the indicator. Alkalinity was calculated as follows:
Water hardness was measured by laboratory titration with 0.050 M EDTA in 80 mL of river water using Eriochrome Black T as the indicator after adjusting the pH to 10 with 5.0 mL of ammonium/ammonia buffer. Hardness was calculated using the following equation:
where the equivalence factor equaled the milligrams of calcium carbonate that complexed to 1 mL of EDTA titrant. This value was 5.004345 mg/mL.
Extent of canopy cover at each site was determined from digital images taken adjacent to and directly above the stream at a height of 2 m. Six images were taken along 20 m of stream length at each site during a single date in early September 2015, approximately one month before leaf fall. Images were printed on grid paper, and the percentage of overhead canopy relative to visible sky determined. Relative sunlight intensity was determined on the same day, using a light intensity meter (753–002C, SKC, Inc., www.skcinc.com). Readings were taken by walking along each stream bank and stopping every five steps to measure light intensity at water level. Measurements were taken from 12 locations at each site during sunny conditions between 2:00 and 4:00 pm.
The volume of in-stream woody debris was estimated on a single day in early September 2015 along transects between stream banks. Six transects were assigned at each site by throwing a spool of twine across the stream and then tying both ends to riparian vegetation to hold it steady. The diameters of all pieces of woody debris in the stream and intercepted by each transect were recorded. The overall volume (V) of debris was calculated for each transect by using the following equation:
where L is the length of the transect and d is the diameter of each individual piece of wood, i (Van Wagner Citation1968; Wallace and Benke Citation1984).
Benthic assemblages
Benthic invertebrates were sampled from representative aquatic habitats using timed collections. Starting downstream, two-person crews worked upstream for 20 minutes, collecting all specimens located on logs, rocks, and within the smaller benthic substrate. Larger specimens were collected by hand, while smaller ones were washed off of large substrates with 80% ethanol into the sampling bottles. This procedure was repeated four times at each site on a single day in May 2015 and three times on a single day in June for a total sample size of seven per site. Collected specimens were identified to the genus level using Hilsenhoff (Citation1995). All identified specimens are stored in the Hillsdale College Insect Collection.
Adult caddisfly assemblages
Adult caddisflies were collected using light traps. Each trap consisted of an 8-watt portable ultraviolet light placed over a white pan filled with 80% ethanol. Lights were placed ∼1 m from each site at dusk and collected approximately 2 h after dusk (Wright et al. Citation2013). Samples were collected only if the peak daytime temperature was >25°C, dusk temperature was >18°C, and there was no noticeable wind or precipitation at dusk (Houghton Citation2004). Since caddisflies collected within 40 m of a habitat accurately reflect the assemblage of that habitat (Sode and Wiberg-Larson Citation1993, Peterson et al. Citation1999, Sommerhäuser et al. Citation1999, Brakel et al. Citation2015), dispersals of adults between sites, while certainly possible, were considered unimportant. Sites were sampled three times in June 2015 and two times in July, for a total sample size of 5 per site. Specimens were identified to the species level using Houghton (Citation2012), except for females of Hydropsychidae, Hydroptilidae, and Polycentropodidae, which lack the necessary characteristics to do so. Such specimens were not included in analyses. All identified specimens are stored in the Hillsdale College Insect Collection.
Fish assemblages
Fish were sampled using wire mesh minnow traps and with electrofishing (Knight and Bain Citation1996, Jones et al. Citation1999). Five minnow traps were set at each site for 24 h, followed by 24–72 h of no sampling. Traps were set at representative habits, emphasizing snags and other large woody debris, and separated by ∼10 m. Combined data from a set of 5 traps constituted a sample. During days without trapping, a single electrofishing run was taken along a ∼50-m stretch of each sampling site. One person ran the electroshocker while two others carried hand nets. A seine was set up at the end of the run to minimize fish escape. Fish were identified to the species level using Page and Burr (Citation1991). All specimens were released on site. One minnow trap sample was combined with an electroshock sample into an overall sample pair for each site. A total of two sample pairs were collected per site in May 2015, 6 in June, and 4 in July.
Benthic metabolism
Benthic metabolism was determined by measuring the changes in DO levels within dome-shaped chambers () at sites 2, 4, and 6 during a 36-h period on 15–16 July 2015 and during a 42-h period on 20–21 May 2017. The sites were chosen due to their cobble-dominated substrate, which was more conducive to obtaining a watertight seal with the chambers than the sand-dominated substrates of the other sites (Fellows et al Citation2006). They also allowed for a transition from forest to floodplain and back to forest.
Figure 2. Opaque and transparent benthic chambers. The bottom metal strip was added in 2017.
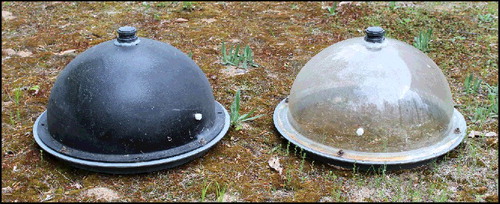
Benthic chambers were composed of transparent polymethyl methacrylate. Some were left transparent and others were painted black on the outside surface. Mean light attenuation by the transparent chambers was <5% within the 400–700 nm photosynthetic spectral range, with a marked increase to almost 60% at 350–390 nm (). The chambers were constructed to allow in situ determination of benthic metabolism through direct contact with benthic substrate. The top of each chamber had a watertight access port to allow insertion of a DO probe (YSI-55, Yellow Springs, OH, www.ysi.com) during sampling.
Figure 3. The percentage of light intensity from a standard incandescent bulb attenuated by our benthic chambers at wavelengths 350–1000 nm. Wavelengths outside of this range were not tested. Each marker represents the mean of ten 3-ms optical spectrometric readings at each wavelength (Ocean Optics, USB-650 Red Tide. www.oceanoptics.com). Error bars omitted for clarity.
Each site had three transparent and three opaque chambers, for a total of six chambers at each site. All chambers were placed along the streambank to minimize the effects of canopy gaps. Chambers were inserted ∼5 cm into the benthic substrate. In July 2015, the chambers were set out at ∼12:00 pm. After a ∼2 h stabilization period, DO measurements from the chambers and surrounding stream were taken at ∼4-h intervals for the next 36 h. This experiment was repeated in May 2017 after some improvements to the experimental design. First, due to suspected leakage of benthic seals in 2015, chambers were redesigned to include a metal strip at the bottom (), allowing chambers to be inserted more rigorously into the substrate. Secondly, chambers were set out at ∼5:00 am and DO measurements first checked ∼1 h later. Measurements were taken at ∼3–4-h intervals for the next 42 h
Community respiration (CR) rates for the transparent chambers were calculated by determining the difference in DO concentrations between measurements when values were decreasing during the night (9 PM to 5 AM), and dividing by 8 to find the hourly rate of oxygen consumption. Net primary production (NPP) rates were calculated in the transparent chambers by determining the difference in DO concentrations between measurements when values were increasing during the day (5 AM–9 PM), and dividing by 18 to find the hourly rate of oxygen production. Hourly gross primary production (GPP) during daylight hours was then calculated by adding NPP and CR. Resulting values in units of mg O2 L−1 h−1 were then multiplied by chamber volume (25 L) and divided by benthic substrate surface area (0.165 m2), rendering units of mg O2 m−2 h−1. These rates were subsequently converted to units of carbon, assuming molar equivalency between C and O in both respiration and photosynthesis (Fellows et al. Citation2006). GPP and R values were multiplied by 18 (daylight hours) and 24 (total hours), respectively, to estimate the total daily gross primary production (GPP24) and community respiration (CR24). Subtracting CR24 from GPP24 yielded net daily metabolism (NDM), a measure of the daily total carbon deficit or surplus from the chamber. GPP24 was divided by CR24 to measure the overall autotrophy or heterotrophy of the chamber. Respiration rates were also calculated in the opaque chambers to serve as controls.
Statistical analyses
Global means of each physicochemical parameter for each sampling site were determined from weekly data and compared to each other using Kruskal–Wallis tests, since data violated parametric assumptions. Specimens of both benthic macroinvertebrates and adult caddisflies were placed into trophic functional groups following Merrit et al. (Citation2008). Mean percentages of the functional groups informative of stream condition at each site: scrapers, shredders, and filtering collectors (Vannote et al Citation1980, Allan Citation2004, Houghton Citation2006), were compared to each other for benthic invertebrates and adult caddisflies separately by a one-way ANOVA, as was mean taxa richness for each assemblage. Three different fish metrics were calculated for each sample pair: specimen abundance, species richness, and percentage of trout specimens. Mean values of each metric were compared between sites by a one-way ANOVA. Values from all sites were also grouped together, and differences between months were compared by a one-way ANOVA. Both GPP24 and CR24 values from transparent chambers were compared between sites using one-way ANOVA. Mean CR24 values between transparent and opaque chambers were compared using a two-sample T-test. Mean CR24 values between day and night in the opaque chambers were compared using a two-sample T-test. For all analyses, percentage data were transformed through an arcsine function before analysis and (Zar Citation2007).
Results
Both relative riparian canopy cover and sunlight intensity were higher at the floodplain sites than the forest sites. The amount of woody debris in the stream was higher at the forest sites (). Physicochemical parameters remained similar at all sites ().
Figure 4. Mean (+SE) amount of (A) canopy cover (B) sunlight intensity, and (C) woody debris for the six sampling sites. Superscript letters denote statistically distinct groups of means based on a Kruskal–Wallis with post-hoc Nemenyi test for each assemblage. n = 6 for canopy and woody debris data, and 12 for sunlight data.
Table 1. Summary of mean (±SE) physicochemical data, organized by forest and floodplain sites. n = 6 for all metrics.
Benthic macroinvertebrate genus richness was generally higher at the forest sites than the floodplain sites, with some statistical overlap. Adult caddisflies had a similar result, except that site 6 (forest) had higher richness than the other forest sites (). Although there was some statistical overlap, the relative abundance of scrapers was lower at forest sites than floodplain sites, whereas the relative abundance of shredders was higher at the forest sites for both assemblages (). The relative abundance of filtering collectors remained unchanged between sites.
Figure 5. Mean (+SE) number of (A) benthic genera and (B) adult caddisfly species for the six sampling sites. Superscript letters denote statistically distinct groups of means based on a one-way analysis of variance with post-hoc Tukey test for each assemblage. n = 7 for benthic genera and n = 5 for adult caddisflies.
Figure 6. Mean (+SE) percentage of the total assemblages for adult caddisfly (A) filtering collectors, (B) scrapers, and (C) shredders, and benthic invertebrate (D) filtering collectors, (E) scrapers, and (F) shredders from the six sampling sites. Superscript letters denote statistically distinct groups of means based on a one-way analysis of variance with post-hoc Tukey test for each functional group for each assemblage. n.s. = not significant. n = 7 for benthic genera and n = 5 for adult caddisflies.
There was no difference in fish specimen abundance, species richness, or percent of trout metrics between the sites. All metrics had higher values in July than in May or June, except for percentage of trout which was statistically related to both May and July in June (). For all sites, Salvelinus fontinalis, Rhinichthys atratulus (Hermann), and Rhinichthys cataractae (Valenciennes) were the most common species caught.
Figure 7. Mean (+SE) values of three different fish metrics calculated by (A) study site and by (B) month from the same data set of combined minnow trapping and electrofishing sample pairs. Superscript letters denote statistically distinct groups of means based on a one-way analysis of variance with post-hoc Tukey test for each metric. n.s. = not significant. n = 12 sample pairs for each study site. n = 12 sample pairs for May, 36 for June, and 24 for July.
DO concentrations followed the predicted pattern in transparent chambers, increasing during daylight hours and decreasing during the night ((a,c)). Opaque chambers exhibited a consistent decrease in DO regardless of sunlight presence during the first ∼24 h of the study. In 2015, several of the chambers exhibited an increase in DO concentration between some daylight measurements after 24 h, leading to a rise in mean values ((b)). In 2017, DO concentrations decreased throughout the duration of the study ((d)). Stream DO concentrations also rose and fell through a 24-h period, reaching their peaks at around noon and their low around midnight ((c,f)). There was no difference in CR24 between sites during either year. The GPP24 rate was higher at the floodplain site than at the forest sites during both years (). The floodplain site was autotrophic, with GPP24/CR24 > 1 and a net surplus in daily metabolism. The upstream forest site was slightly heterotrophic in 2015, while the downstream forest site was slightly autotrophic. Both forest sites were heterotrophic in 2017. During the first 24 h of the 2015 experiment, there was no difference in CR24 between transparent (24.9 mg C m−2 d−1) and opaque (21.8) chambers (two-sample T-test, P = 0.25), or between day (20.9) and night (22.6) in the opaque chambers (two-sample T-test, P = 0.75). Likewise, during the first 24 h of the 2017 experiment, there was no difference in CR24 between transparent (24.2 mg C m−2 d−1) and opaque (23.8) chambers (two-sample T-test, P = 0.99), or between day (21.9) and night (25.7) in the opaque chambers (two-sample T-test, P = 0.20).
Figure 8. Mean (±SE) dissolved oxygen in (A, D) transparent chambers, (B, E) opaque chambers, and (C, F) stream column during our experiments in 2015 and 2017. n = 3 for each value.
Table 2. Mean (±SE) values for benthic metabolism metrics found during trials using transparent and opaque chambers.
Discussion
One of the inherent challenges with testing concepts in-stream ecology (Vannote et al. Citation1980, Thorp et al. Citation2006) is finding habitats that reflect the undisturbed conditions upon which these concepts are predicated. It is highly unlikely that the East Fork of the Black River, or any stream system in the eastern USA, is in a truly pristine condition. Deforestation, dam construction, and other land uses in the watershed during the 1800s may have altered stream conditions in ways that are important, yet difficult to detect now, even after the landscape appears recovered (Harding et al. Citation1998, Baumgartner and Robinson Citation2015). Current upstream gravel roads, dams on the lower Main Stem of the Black River (∼40 km below our study area), and subtle changes in climate or groundwater flow are probably affecting the river system now. Despite these problems, the high level of habitat protection, biological diversity (Houghton Citation2016), and generally unimpeded flow regime of the East Fork suggest that it is one of the least disturbed rivers in the northcental USA and, thus, one of the most appropriate places to test stream ecological concepts. Moreover, the variable we tested, loss of canopy cover at natural floodplain sites, appeared generally unaffected by anthropogenic disturbance.
The lack of riparian canopy at the floodplain sites did not appear to have important effects on water physicochemistry, as indicated by our static pH, specific conductance, alkalinity, and hardness values between sites. Changes in specific conductance and pH have been found to explain large amounts of the disturbance variation between sites of watersheds in New Jersey, and were also associated with differences in the assemblages of organisms (Zampella and Laidig Citation1997, Dow and Zampella Citation2000). Specific conductance, in particular, is often used as a preliminary indicator of nutrient, sediment, and organic matter concentrations. Such concentrations accumulate naturally in larger rivers or anthropogenically in disturbed streams (Allan Citation2004). Agriculturally disturbed Michigan streams of a similar size have specific conductance levels two to three times that of the East Branch (Castillo et al. Citation2000, Houghton et al. Citation2011). Our low specific conductance values, as well as the similarity of these and other physicochemical values between study sites, suggested no important differences in natural or anthropogenic sediment input throughout the continuum of the stream.
Even though our sites were physicochemically similar, changes in macroinvertebrate assemblages suggested biological differences between sites. The increase in macroinvertebrate shredder relative abundance among both the benthic and adult caddisfly faunas at the forest sites was probably caused by the increase in coarse allochthonus input from the surrounding forest canopy. The reciprocal increase in macroinvertebrate scraper relative abundance among both faunas at the floodplain sites was likely due to greater sunlight penetration stimulating growth of epilithic periphyton, although we did not directly measure periphyton growth. In general, these changes were expected. Shredders typically reach their highest abundance in narrow streams with a dense forest canopy, whereas scrapers reach theirs in mid-order streams with an open canopy and shallow enough depth for light to penetrate to the benthic substrate. As a fourth-order stream, the East Branch is at the point in its continuum where either set of conditions could be met with an increase or decrease in riparian canopy cover (Vannote et al Citation1980). The lack of change in the filtering collectors of either fauna between sites further suggested no important source of organic input to the river throughout the studied area (Allan Citation2004).
Our macroinverterate results were slightly different than those previously reported from 2 northern Lower Michigan streams with abrupt changes in forest canopy (Houghton and Wasson Citation2013, Houghton et al. Citation2013). In those studies, filtering collectors increased in non-canopied sites for both benthic and adult caddisfly assemblages. This difference may be due to the previous deforestation and recent (∼10 ybp) agriculture at the non-canopied sites of the previous studies. Although there were no differences in pH or specific conductance between sites of these studies, the nutrients and fine organic matter input that may promote increases in filtering collectors were not specifically measured. Thus, the increase in filtering collectors in non-canopied areas may indicate the effects of past landuse on current assemblages (Harding et al. Citation1998), whereas the East Branch assemblages suggest either no previous anthropogenic disturbance, or else a more recovered stream condition.
The increase in taxa richness among both benthic macroinvertebrate and adult caddisfly faunas at forest sites suggested the importance of habitat heterogeneity in promoting biological diversity. Many studies have noted a link between macroinvertebrate taxa richness and increased in-stream coarse woody debris due to its use as a food source and shelter, area for biofilm colonization, ability to stabilize stream banks and channels, and indirect effects on habitat variability (Rios and Bailey Citation2006, Urban et al Citation2006, Schneider and Winemiller Citation2008, Houghton et al. Citation2011, Stewart et al. Citation2012, Pilotto et al. Citation2014). In our study, site 6 had the highest amount of both woody debris and species richness, adding further support to the idea. Moreover, our forest sites had small gaps throughout the canopy, as evidenced by the high standard errors in sunlight intensity measurements (), as well as a larger gap in the middle of the channel, suggesting that species dependent on sunlight could still exist at forest sites at a lowered abundance. Thus, a higher total number of species was found at the forest sites.
Biological differences between habitat types were also suggested by the increase in benthic metabolism at our floodplain site, including GPP two to three times that of the forest sites, and a shift from heterotrophy to autotrophy. As a fourth-order stream, the East Branch is at a point in the continuum where it is predicted to gradually transition from heterotrophy to autotrophy (Vannote et al. Citation1980). The abrupt shift to autotrophy at the floodplain site suggested no nutrient limitations to photosynthesis at the upstream forest site (Sanderson et al. Citation2009, Hornbach et al. Citation2015). The subsequent reversion to heterotrophy at the downstream forest site suggested the singular importance of sunlight in increasing GPP at the floodplain site. Closed chamber-determined benthic metabolism is one of the most robust and accurate measures of GPP, highly sensitive to changes in sunlight penetration (Migné et al. Citation2002, Spillmont et al. Citation2006). The similarity in CR observed at our sites further suggested no important source of organic carbon or sediment along our studied continuum (Bunn et al. Citation1999), and that our observed changes in GPP were largely due to changes in sunlight penetration.
In 2015, we suspected that differences in GPP between forest and floodplain sites might actually have been underestimated due to leakage of the benthic chambers. Most studies (e.g. Fellows et al. Citation2006) utilize only transparent chambers for metabolism determination and assume that the benthic seal will remain intact so that changes in in-situ DO are due exclusively to processes occurring within the chamber. We were unwilling to make that assumption, so we utilized opaque chambers as controls. Since the opaque chambers effectively eliminated solar radiation, they should have also minimized photosynthesis. Any photosynthetic activity in the dark (Scoffoni et al. Citation2015) would likely have occurred during the first 12–24 h of incubation. Previous research (Fellows et al. Citation2006), and the similarity of our CR values between transparent and opaque chambers, and between day and night during the first 24 h in the opaque chambers, all indicated a constant respiration rate in all chambers. Thus, DO in the opaque chambers should have continually decreased throughout the entire 36-h period. The noted increase in DO after 24 h in several of the opaque chambers, therefore, suggested chamber leakage through a gradual erosion of the benthic seal. The measured DO concentrations of the surrounding stream were always higher than those of the chambers of the forest sites and usually lower than those of the floodplain site (). Thus, if leakage was consistent into transparent chambers at both types of sites, it would have homogenized the DO differences between them and, ultimately, underestimated differences in benthic metabolism. This hypothesis was supported in 2017 after the addition of the metal strip to the base of the chambers to stop benthic leakage. Opaque chambers exhibited the predicted continual decrease in DO throughout the 42 h experiment, and differences in GPP were greater between forest and floodplain habitats than they had been in 2015 ()
Contrary to other metrics, fish assemblages did not exhibit differences between forest and floodplain sites. Instead, all 3 tested metrics increased during the summer. Although precise long- and short-term ranges are not known for most coldwater fish species, both of these results are probably due to the inherent mobility of fish and their search for optimal habitat or defensible territory. For example, cutthroat trout [Oncorhynchus clarki (Richardson)] can travel up to 1 km per day until they find areas with appropriate large woody debris (Harvey et al. Citation1999). Brook trout that are unable to defend a territory will continually disperse to new habitats (Hudy et al. Citation2010). The short distance of our studied continuum suggested that the larger and more vagile fish, such as trout or suckers, could have visited several sites during the course of the summer. The increase in metrics during the summer, particularly the increase in the percentage of trout specimens, was probably due to warming water downstream of our study area forcing fish to seek cooler areas with groundwater upwelling for both survival and reproduction (Guillemette et al. Citation2011). The mobility of fish, and the variety of reasons for their movement, renders them less valuable as biomonitoring organisms over the small spatial scale of our study.
A few sources of potential error existed within our study design. The difficulty of sampling some microhabitats, such as large woody debris or the hyporheos, may have led to macroinvertebrate samples that were non-representative of the overall assemblage (Cao and Hawkins Citation2011). This concern can be alleviated by sampling adult caddisflies, which have left the natal habitat and are attracted to ultraviolet lights regardless of functional group (Dohet Citation2002, Houghton Citation2006). The congruency between benthic and adult caddisfly assemblages suggested that our sampling techniques, however imperfect, were sufficient to capture the functional differences between sites. Similarly, minnow trap placements in specific microhabitats, behavior of fish species during electroshocking, and size of minnow trap openings can all affect the number and relative abundance of fish species caught (Pot et al. Citation1984, Rozas and Minello Citation1997, Layman and Smith Citation2001). Lastly, we did not quantify differences in river width, depth, current velocity, or substrate composition between sites. Substrate composition, in particular, appeared highly variable both within and between sites. For example, we were unable to find cobble-dominated substrate at sites 1, 4, and 5, precluding benthic metabolism study. Undocumented differences in substrate between sites may have had an effect on river continuity not detected by our analyses.
Additional sources of potential error existed in our benthic metabolism experiment. First, the remoteness of several of the sites precluded a high number of measurements. Measuring every 4 h was imprecise at documenting the transition between day and night, and provided us with fewer data to analyze. Measuring more frequently with an automated system would greatly improve the study design. Second, we did not quantify groundwater input. Such input tends to affect CR more than GPP (McCutchan et al. Citation2002, Hall and Tank Citation2005). Due to the short distances and similar CR values, we suspect minimal differences in groundwater input between sites. Third was the chamber design itself. Ultraviolet light irradiation is known to be harmful to periphyton and other benthic organisms. Thus, any ultraviolet light attenuated by the polymethyl methacrylate material of our chambers may have led to increased algal growth or other artificial changes during the incubation period (Bühlmaan et al. Citation1987, Dodds and Brock Citation1998). Although our primary concern was measuring the attenuation of photosynthetically active light, we did observe up to 60% attenuation of high (350–400 nm) ultraviolet wavelengths (). We also observed <5% attenuation within the 400–700 nm photosynthetic spectral range. While this result appeared to confirm a negligible impact on photosynthesis from our benthic chamber material, the sharp increase in light attenuation below 400 nm suggests the possibility that our chambers may have reduced low range photosynthetically active light. The potential effects to this study are minimal since any attenuation that occurred was consistent throughout our study area. Caution should be taken when directly comparing our results to studies that used a different material for their chambers, or that used a design with more frequent DO measurements.
Overall, our results provide broad empirical support for the riverine ecosystem synthesis (Thorp et al. Citation2006). This idea posits that while large-scale changes in organismal assemblages and ecological processes are continual and can be predicted by stream order (Vannote et al. Citation1980), small-scale changes and reversals can occur repeatedly, leading to serial discontinuity along the overall continuum. Aside from the mobile fish, the trends in our metrics agreed with each other and collectively constituted a robust response over several levels of biological organization to natural changes in canopy cover in the absence of water physicochemical changes. Although individual metric responses were not necessarily surprising, they were striking in their abruptness over short distances (<1 km) and in their repeated reversals. Such reversals indicate the dynamic and serially discontinuous nature of undisturbed rivers.
Acknowledgments
We thank the members and staff of the Black River Ranch, especially Dorothy and Tim Michiels, for their hospitality and support. We thank Joel Parker and Bilyana Petkova for field assistance, and Paul Hosmer and Mark Nussbaum for laboratory assistance. We appreciate the efforts of Joel Haines in helping to redesign our benthic chambers for 2017. A fish collecting permit was provided by Thomas Goniea of the Michigan Department of Natural Resources. The valuable comments of two anonymous reviewers improved earlier version of the manuscript. This is paper no. 18 of the G.H. Gordon BioStation Research Series.
Disclosure statement
No potential conflicts of interest were reported by the authors.
Additional information
Funding
Notes on contributors
David C. Houghton
David Houghton is a professor of biology at Hillsdale College and the director of the G.H. Gordon Biological Station. His research involves the biological diversity of aquatic organisms, particularly caddisflies, and the effects of natural and anthropogenic impacts on their assemblages.
All coauthors obtained their undergraduate degrees from Hillsdale College in 2016.
References
- Allan JD. 2004. Landscapes and riverscapes: the influence of land use on stream ecosystems. Annu Rev Ecol Evol Syst. 35:257–284.
- Baumgartner SD, Robinson CT. 2015. Land-use legacy and the differential response of stream macroinvertebrates to multiple stressors studied using in situ experimental mesocosms. Freshw Biol. 60:1622–1634.
- Brakel K, Wassink L, Houghton DC. 2015. Nocturnal flight periodicity of the caddisflies (Trichoptera) in forest and meadow habitats of a first order Michigan stream. The Great Lakes Entomologist. 48:34–44.
- Bühlmaan B, Bossard P, Uehlinger U. 1987. The influence of longwave ultraviolet radiation (uv-A) on the photosynthetic activity (14C-assimilation) of phytoplankton. J Plankton Res. 9:935–943.
- Bunn SE, Davies PM, Mosisch TD. 1999. Ecosystem measures of river health and their response to riparian and catchment degradation. Freshwater Biol. 41:333–345.
- Burkhead NM, Walsh SJ, Freeman BJ, Williams JD. 1997. Status and restoration of the Etowah River, an imperiled southern Appalachian ecosystem. In: Benz GH, Collins DE, editors. Aquatic fauna in peril: the southeastern perspective. Decatur (GA): Southeast Aquatic Research Institute Special Publication 1. Lenz Design and Communications; p. 375–444.
- Castillo MM, Allan JD, Brunzell S. 2000. Nutrient concentrations and discharges in a Midwestern agricultural catchment. Journal of Environmental Quality. 29:1142–1151.
- Cao Y, Hawkins CP. 2011. The comparability of bioassessments: a review of conceptual and methodological issues. J N Am Benthol Soc. 30:680–701.
- Clapcott JE, Young RG, Neale MW, Doehring K, Barmuta LA. 2016. Land use affects temporal variation in stream metabolism. Freshw Sci. 35:1164–1175.
- de Nadaï-Monoury E, Gilbert F, Lecerf A. 2014. Forest canopy cover determines invertebrate diversity and ecosystem process rates in depositional zones of headwater streams. Freshw Biol. 59:1532–1545.
- Detenbeck NE, DeVore PW, Niemi GJ, Lima A. 1990. Recovery of temperate-stream fish communities from disturbance: a review of case studies and synthesis of theory. Environ Manag. 16:33–53.
- Dodds WK, Brock J. 1998. A portable flow chamber for in situ determination of benthic metabolism. Freshwater Biol. 39:49–59.
- Dohet A. 2002. Are caddisflies an ideal group for the assessment of water quality in streams? In Mey W, editor. Proceedings of the 10th international symposium on Trichoptera; 30 July–05 August; Potsdam: Nova Supplementa Entomologica. p. 507–520.
- Dow CL, Zampella RA. 2000. Specific conductance and pH as indicators of watershed disturbance in streams of the New Jersey pinelands, Environ Manag. 26:437–445.
- Fellows CS, Clapcott JE, Udy JW, Bunn SE, Harch BD, Smith MJ, Davies PM. 2006. Benthic metabolism as an indicator of stream ecosystem health. Hydrobiologia. 572:71–87.
- Guillemette F, Vallee C, Bertolo A, Magnan P. 2011. The evolution of redd site selection in brook trout in different environments: same cue, same benefit for fitness. Freshw Biol. 56:1019–1029.
- Hall RO, Tank JL. 2005. Correcting whole-stream estimates of metabolism for groundwater input. Limnol Oceanogr: Methods. 3:222–229.
- Harding JS, Benfield EF, Bolstad PV, Helfman GS, Jones EPB. 1998. Stream biodiversity: the ghost of land use past. Proc Nat Acad Sci USA. 95:14843–14847.
- Harvey BC, Nakamoto RJ, White JL. 1999. Influence of large woody debris and a bankfull flood on movement of adult resident coastal cutthroat trout (Oncorhynchus clarki) during fall and winter. Can J Fish Aquat Sci. 56:2161–2166.
- Hilsenhoff WL. 1995. Aquatic insects of Wisconsin: generic keys and notes on biology, ecology and distribution. Technical Bulletin No. 89. Madison (WI): Wisconsin Department of Natural Resources.
- Hornbach DJ, Beckel R, Hustad EN, McAdam DP, Roen IM, Wareham AJ. 2015. The influence of riparian vegetation and season on stream metabolism of Valley Creek, Minnesota. J Freshw Ecol. 30:569–588.
- Houghton DC. 2004. Minnesota caddisfly biodiversity (Insecta: Trichoptera): delineation and characterization of regions. Environ Monit Assess. 95:153–181.
- Houghton DC. 2006. The ability of common water quality metrics to predict habitat disturbance when biomonitoring with adult caddisflies (Insecta: Trichoptera). J Freshw Ecol. 21:705–716.
- Houghton DC. 2012. Biological diversity of Minnesota caddisflies. ZooKeys Spec Issues. 189:1–389.
- Houghton DC. 2016. The caddisflies (Trichoptera) of an undisturbed Lower Michigan habitat. The Great Lakes Entomol. 49:41–54.
- Houghton DC, Berry EA, Gilchrist A, Thompson J, Nussbaum MA. 2011. Biological changes along the continuum of an agricultural stream: influence of a small terrestrial preserve and use of adult caddisflies in biomonitoring. J Freshw Ecol. 26:381–397.
- Houghton DC, Brandin CM, Reyonolds L, Elzinga LL. 2013. Reverse biological continuity in the headwaters of a northern Lower Michigan stream due to terrestrial habitat loss. The Great Lakes Entomol. 46:31–41.
- Houghton DC, Wasson JL. 2013. Abrupt biological discontinuity in a small Michigan stream due to historical riparian canopy loss. J Freshw Ecol. 28:293–306.
- Hudy MH, Coombs JA, Nislow KH, Letcher BH. 2010. Dispersal and within-stream spatial population structure of brook trout revealed by pedigree reconstruction analysis. Trans Am Fish Soc. 139:1276–1287.
- Jones EBD, Helfman GS, Harper JO, Bolstad PV. 1999. Effects of riparian forest removal on fish assemblages in southern Appalachian streams. Conservation Biology. 13:1454–1465.
- Knight JG, Bain MB. 1996. Sampling fish assemblages in forest floodplain wetlands. Ecol Freshwater Fish. 5:76–85.
- Lagrue C, Kominoski JS, Danger M, Baudoin J-M, Lamothe S, Lambrigot D, Lecerf A. 2011. Experimental shading alters leaf litter breakdown in streams of contrasting riparian canopy cover. Freshw Biol. 56:2059–2069.
- Layman CA, Smith DE. 2001. Sampling bias of minnow traps in shallow aquatic habitats on the eastern shores of Virginia. Wetlands. 21:145–154.
- McCutchan JH Jr., Saunders JF III, Lewis WM Jr., Hayden MG. 2002. Effects of groundwater flux on open-channel estimates of stream metabolism. Limnol Oceanogr. 47:321–324.
- Merrit RW, Cummins KW, Berg MB. 2008. An introduction to the aquatic insects of North America. 4th ed. Dubuque (IA): Kendall/Hunt.
- Migné A, Davoult D, Spilmont N, Menu D, Boucher G, Gattuso JP, Rybarczyk H. 2002. A closed-chamber CO2-flux method for estimating intertidal primary production and respiration under immersed conditions. Marine Biology. 140:865–869.
- Page LM, Burr BM. 1991. A Peterson field guide to the freshwater fishes. 2nd ed. Boston (MA): Houghton Mifflin Harcourt.
- Peterson I, Winterbottom JH, Orton S, Friberg N, Hildrew AG, Spiers DC, Gurney WSC. 1999. Emergence and lateral dispersal of adult Plecoptera and Trichoptera from Broadstone Stream, U.K.Freshwater Biol. 42:401–416.
- Pilotto F, Bertoncin A, Harvey GL, Wharton G, Pusch MT. 2014. Diversification of stream invertebrate communities by large wood. Freshw Biol. 59:2571–2583.
- Pot WD, Noakes LG, Ferguson MM, Coker G. 1984. Quantitative sampling of fishes in a simple system: failure of conventional methods. Hydrobiologia. 114:249–254.
- Rios SL, Bailey RC. 2006. Relationship between riparian vegetation and stream benthic communities at three spatial scales. Hydrobiologia. 553:153–160.
- Rozas LP, Minello TJ. 1997. Estimating densities of fishes and decapod crustaceans in shallow estuarine habitats: a review of sampling design with a focus on gear selection. Estuaries. 20:199–213.
- Sanderson BL, Coe HJ, Tran CD, Macneale KH, Harstad DL, Goodwin AB. 2009. Nutrient limitation of periphyton in Idaho streams: results for nutrient diffusing substrate experiments. JN Am Benthol Soc. 28:832–845.
- Schneider KN, Winemiller KO. 2008. Structural complexity of woody debris patcfhes influences fish and mavroinvertebrate species richness in a temperate floodplain-river system. Hydrobiologia. 610:235–244.
- Scoffoni C, Kunkle J, Pasquet-Kok J, Vuong C, Patel AJ, Montgomery RA, Givnish TJ, Sack L. 2015. Light-induced plasticity in leaf hydraulics, venation, anatomy, and gas exchange in ecologically diverse Hawaiian lobeliads. New Phytol. 207:43–58.
- Sode A, Wiberg-Larson P. 1993. Dispersal of adult Trichoptera at a Danish forest brook. Freshwater Biol. 30:439–446.
- Sommerhäuser M, Koch P, Robert B, Schumacher H. 1999. Caddisflies as indicators for the classification of riparian systems along lowland streams. In: Malicky H, Chantaramongkol P, editors. Proceedings of the 9th International Symposium on Trichoptera; Jan 5–10 1998; Chiang Mai: Faculty of Science, Chiang Mai University. p. 337–348.
- Spillmont N, Davoult D, Migné A. 2006. Benthic primary production during emersion: in situ measurements and potential primary production in the Seine Estuary (English Channel, France). Marine Pollution Bulletin. 53:49–55.
- Stewart PM, Bhattarai S, Mullen MW, Metcalf CK, Reátegui-Zirena G. 2012. Characterization of large wood and its relationship to pool formation and macroinvertebrate metrics in southeastern coastal plain streams, USA. J Freshw Ecol. 27:351–365.
- Thorp JH, Thoms MC, Delong MD. 2006. The riverine ecosystem synthesis: biocomplexity in river networks across space and time. River Res Appl. 22:123–147.
- Urban MC, Skelly DK, Burchsted D, Price W, Lowry S. 2006. Stream communities across a rural–urban landscape gradient. Divers Distrib. 12:337–350.
- Van Wagner CE. 1968. The line intersect method in forest fuel sampling. Forest Science. 14:20–26.
- Vannote RL, Minshall GW, Cummins KW, Sedell JR, Cushing CE. 1980. The river continuum concept. Can J Fish Aquat Sci. 37:130–137.
- Wallace JB, Benke AC. 1984. Quantification of wood habitat in subtropical coastal plain streams. Can J Fish Aquat Sci. 41:1643–1652.
- Wright DR, Pytel AJ, Houghton DC. 2013. Nocturnal flight periodicity of caddisflies (Trichoptera) in a large Michigan river. J Freshw Ecol. 28:463–476.
- Zampella RA, Laidig KJ. 1997. Effect of watershed disturbance on pinelands stream vegetation. J Torrey Bot Soc. 124:52–66.
- Zar JH. 2007. Biostatistical analysis. 5th ed. Englewood Cliffs (NJ): Prentice-Hall.