
ABSTRACT
The ecological integrity of the Mthatha River is increasingly under threat from climate change and anthropogenic impacts of contamination by acidification, organic pollutants, industrial and agricultural chemicals, and waste water. This study assessed the ecological state of the river and the impact of water quality on benthic macroinvertebrate communities from 2015 to 2016. Faunal specimens were sampled and environmental variables measured at four sites that vary in topography and human impact along the river. A total of 2980 specimens were recorded at sites, and classified into 12 orders, 46 families and 71 species. Species composition and distribution were directly or indirectly affected by season, physico-chemical variables and habitat heterogeneity. CCA results showed that electrical conductivity, pH, temperature, dissolved oxygen and vegetation accounted for species distribution patterns. Both habitat-restricted and common/widespread species can be used as indicators for assessing the quality of the Mthatha River system. Habitat management along the river should aim at preserving sufficient indigenous vegetation, especially during summer when biotope requirements are optimal. The practicality of using species-level surveys on a routine basis can be challenging. It might be advisable to select a few indicator species identified in this study and to monitor them as surrogates for the whole community.
Introduction
The deterioration of surface water quality globally has been attributed to increasing impacts of climate change and anthropogenic pressures (Jun et al. Citation2016). Habitat loss and degradation, invasive species, overharvesting, chemical and organic pollution remain the main threats to freshwater biotic systems, resulting in species losses and/or extinctions (Niba and Mafereka Citation2015). South Africa is a dry country with low, irregular and seasonal rainfall patterns, resulting in a broad range of aquatic ecosystems adapting to different water quality regimes and flow characteristics (DWAF Citation1996).
Many South African rivers, including the Mthatha River have been deteriorating in quality in the past few decades, largely due to an increase in industrial, agricultural and domestic activities within the catchments. Such activities alter its physico-chemical characteristics and ecological integrity (Alvarez-Cabria et al. Citation2010; Simaika and Samways Citation2011; Konig et al. Citation2014). Since different benthic taxa tend to exhibit different tolerance levels to individual environmental parameters, water of suitable quality is essential to maintain healthy populations of benthic fauna (Dallas and Day Citation1993; Fatoki et al. Citation2001; Dallas Citation2004). Many studies have used family-level analyses of benthic macroinvertebrates to assess river health condition. In this study, we propose that a species-level assessment is needed in order to obtain a better interpretation of the ecological state of selected sections of the Mthatha River.
The objectives of this study were to identify the benthic macroinvertebrate assemblage along the Mthatha River and its response to measured site variables, and make recommendations for monitoring the quality of the river based on findings of the study.
Materials and methods
Study area
The study was conducted in shallow sections of the Mthatha River at the following sites: Headwaters (HW: 31° 30′32.19″ S, 28° 23′ 47.57″ E), Langeni Forest (LN: 31°29′ 35.14″S, 28° 28′ 36.65″E), Kambi Valley (KM: 31° 28′ 17.76″S, 28° 36′ 53.59″E) and Ntsaka (NT: 31° 41′ 08.49″ S, 28° 49′13.64″E) ().
Figure 1. Map showing location of sampling sites at Headwaters (H), Langeni (L), Kambi (K) and Ntsaka (NT) along the Mthatha River, Eastern Cape, South Africa.
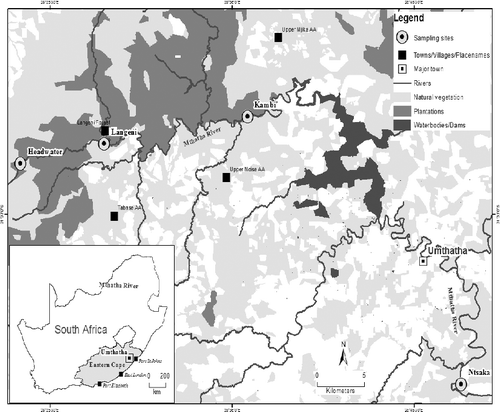
The geology of the catchment comprises mudstones and sandstones, with scattered deposits of alluvium in some valleys. Soils in the catchment are moderate to deep and vary between sandy loam in the upper section and clayey loam in the section lower down the river, with extensive pine plantations in the Headwaters (Fatoki et al. Citation2001).
Site selection and description
Using a 30 m transect, four a-priori-selected sites along the Mthatha River were mapped out. Each site measured 25 m in length by 2 m (1 m on land and 1 m into water) wide, separated apart by at least 5 m.
The Headwater (HW) site was minimally disturbed, and characterized by clear, fast flowing, nutrient-free water with medium-sized boulders which form riffles. Marginal forest and riparian vegetation formed a canopy that reduced light penetration. Langeni Forest (LN) site had a wide range of habitats types, with river flow characterized by runs. Riparian vegetation was dominated by sedges (Cyperus papyrus L.), herbs (Setaria sp.), grasses (Ludwigia octovalvis Jacq.) and forbs. This site was moderately disturbed by human activity such as grazing and logging from a nearby saw mill. Riparian vegetation at Kambi Valley (KM) site comprised of alien plants, e.g. black wattle Acacia mearnsii, Lantana sp., Eucalyptus sp. and indigenous herbs. This site was highly disturbed by water extraction, grazing and sand mining activities that altered water flow, resulting in high sediment loads at this section of the river. Habitat at Ntsaka (NT) site comprised a sandy substrate, with a few species of emergent and submerged vegetation (e.g. chara sp. and Commelina Africana, respectively). The site was accessible to intensive human activity such as washing, water collection and grazing by cattle from the surrounding Ntsaka local community.
Benthic macroinvertebrate sampling
According to Buchwald (Citation1992) and Phiri et al. (Citation2012), macroinvertebrates may reside on or within sediments, or be associated with aquatic vegetation. Semi-quantitative surveys were done in 2015–2016 by sampling benthic fauna at sampling units (SUs) with a net once a month throughout the year between 11 am and 1 pm on clear sunny days, using an adapted version of the South African Scoring System (SASS 5) (Dickens and Graham Citation2002).
Samples were taken within 5–10 min, using the kick-method in which rocks and other benthic material were disturbed by foot, and faunal specimens allowed to follow the water current downstream into a soft 1 mm mesh, 30 cm × 30 cm net. The contents of each sample were washed to the bottom of the net and tipped into a water water-filled tray. Benthic macroinvertebrate specimens were then separated from organic and mineral matter, counted (after preliminary identification to the lowest taxonomic level possible), and released back into water. Where specimens could not be identified in the field, subsamples were preserved in 70% ethanol, and transported to the laboratory for further identification using voucher specimens, a Zeiss dissecting microscope (Model STEMI DV4) and with the aid of field guides by Hart et al. (Citation2003), Appleton (Citation2002), De Moor et al. (Citation2003) and Nelson (Citation2007). Specimen identities were verified by a specialist at the Albany Natural Science Museum, Grahamstown, South Africa.
Measurement of environmental variables
Measurements of physical, chemical and biotic variables that were hypothesized to affect benthic macroinvertebrate composition and distribution were made thought out the one-year sampling period from 2015 to 2016 at each of the SUs. Measurements commenced within 10–15 min of faunal specimen sampling. Electrical conductivity (CND), acidity (pH), dissolved oxygen (TDO) and temperature (TEMP) were measured in situ using a portable multi-parameter meter (Model Hach HQd). Plants within the SUs were classified into broad vegetation types such as aquatic vegetation (Aqua Veg) (plants in the river channel, partly or fully submerged), riparian vegetation (Rip Veg) (grasses, reeds, shrubs and sedges on the water's edge) and algae (Algae) (isolated and also on stones), according to Gerber and Gabriel (Citation2002). Vegetation was estimated as percentage of total surface area of SU covered by these plants.
Data analysis
To describe the variation in environmental variables, means and ranges of all measured variables were calculated for the study sites during the sampling period. The statistical software programs DIVERSE and CLUSTER in PRIMER v. 6 (Clarke and Warwick Citation2001) were used to determine indices of diversity and classification of species data, respectively. Benthic species × SU data matrices were fourth root-transformed to balance rarer and common species. The Bray–Cutis measure of similarity (Bray and Curtis Citation1957) was then applied to the data to generate SU similarity matrices that were fused successively using group average linking.
Results describing patterns obtained using clusters were represented by a dendrogram. SU clusters were confirmed using a non-metric multi-dimensional scaling (NMDS) ordination plot. Ordination techniques in correspondence analysis (CA) and canonical correspondence analysis (CCA) from the computer software package CANOCO (Ter Braak Citation1988; Ter Braak and Smilauer Citation2002) were also used to describe community trends in faunal data and to identify environmental variables that best explained species distribution patterns at study sites. CCA is a direct gradient analysis technique that uses multiple regressions to select linear combinations of environmental variables that account for most of the variation in faunal distributions.
Results
Overall taxon richness
A total of 2980 benthic macroinvertebrate individuals were recorded, and were classified into 12 orders, 46 families and 71 species (). The orders Lepidoptera and Platyhelminthes were represented by one family and one species each while the Ephemeroptera was the richest order with seven families and 12 species. The family Baetidae (Ephemeroptera) had the most species and individual counts. Castanophleblia sp. (Leptophlebibidae) had the highest population count and occurred mainly at the Headwater and Langeni SUs like other members of the order.
Table 1. Taxonomic profile of benthic macroinvertebratess recorded at Headwaters, Langeni, Kambi and Ntsaka in 2015–2016.
Spatial distribution
Higher benthic macroinvertebrate individual counts were recorded at the Headwaters (HW) and Langeni (LN) than at Kambi (KM) and Ntsaka (NT). Langeni SUs had the highest population count (nind = 958) while the highest species numbers were recorded at the Headwaters (nsp = 93). The lowest number of species (nsp = 19) and individuals (nind = 115) across all SUs occurred at Kambi (SU KM1). Trends in species diversity (Shannon H’) and evenness (Pielou J’) across sites are presented in . Six species, Neoperla sp., Castanophlebia sp., Rheoptilium sp., Cleon sp., Simulium letabum and Hydropsyche longifurca, were recorded across all site SUs. Only one macroinvertebrate species (nind = 1–10) belonging to the habitat-tolerant family Chironomidae was recorded during the study.
Temporal distribution
Species richness and abundance varied across sites during the study period. Aeshna sp. and Neoperla sp. were recorded throughout the study at Langeni, while Potamonautidae sp., Tricorythus sp. and Afroceania sp. occurred every month at the Headwaters. Hydropsyche longifurca occurred each month at Ntsaka (). Highest monthly species and individual counts were recorded in April and September at Langeni and Ntsaka, respectively. Seasonal species counts showed that 21% (mean 15, range 10–18) of the total number of macroinvertebrate species recorded during the study occurred in spring and 17% (mean 12, range 6–17) occurred in summer.
Table 2. Temporal distribution of benthic macroinvertebrate taxa during the sampling period (2015–2016) across sites: H = Headwaters, L = Langeni, K = Kambi and N = Ntsaka Only species with population counts above two individuals per sampling unit have been included in the table.
Similarity of benthic macroinvertebrate distribution at sites
NMDS results showed that all SUs at Headwater and Langeni were over 65% similar, and showed closer similarity to Kambi SUs KM2 and KM3 at 58% similarity, while SUs at Ntsaka were 70% similar, and distinct from the other SUs ((a,b)). Out of the 71 species recorded during the study, 36 species where distributed as follows: 7 occurred at all 12 SUs, 11 were restricted to Headwater SUs, while an additional 5 species (Pachyelmis convexa, Helodidae sp., Hydaticus sp., Tipulia pompasa and Bezzia sp.) were unique to Headwaters and Langeni SUs. Four (Oligoneurus sp., Elmidae sp. 2, Notonecta sp., Rhagovelia sp.), three (Prosopistoma sp., Micronecta sp., Aphelocheirus sp.) and five (T. dorsalis, Pseudagrion sp., Malaya sp., D. urceolu, Appasus sp., Chlorocypha sp.) were restricted to Langeni, Kambi and Ntsaka SUs, respectively.
Figure 2. Dendrogram showing (a) Bray–Curtis similarity and (b) NMDS obtained using group-average linking from matrices on fourth-root transformed benthic macroinvertebrate data for all sampling units at Head waters (HW), Langeni (LN), Kambi (KM) and Ntsaka (NTS) in 2015–2016.
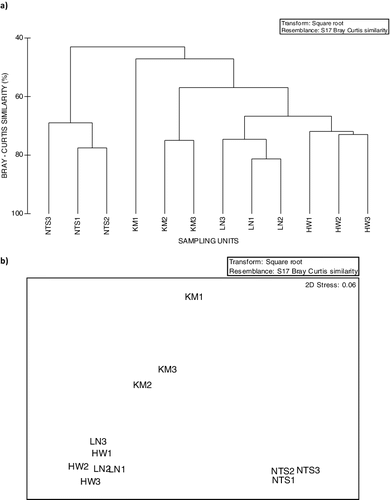
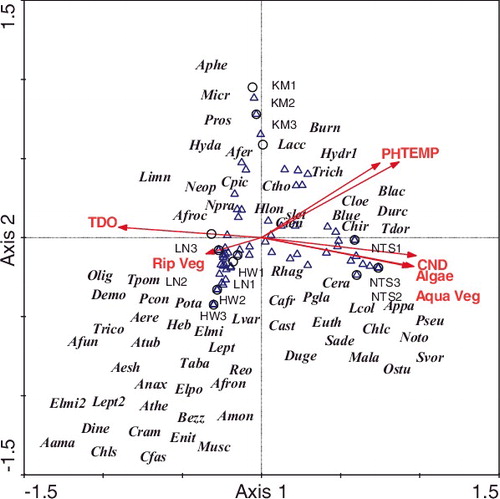
Figure 3. CCA tri-plot for all sampling units depicting relationship between sampling units (circles), species (triangles) and measured environmental variables (arrows). Axis 1 is horizontal and axis 2 vertical. Species code names are given in . TEMP = temperature, CND = electrical conductivity, TDO = dissolved oxygen, Aqua veg = aquatic vegetation, Rip veg = riparian vegetation.
Environmental variables at sites
Measured environmental (physico-chemical and biotic) variables across site SUs during the study period are summarized in . Temperature was lowest in winter at Kambi (mean 14, range 9.5–19.5 °C) and highest in summer at the same site (mean 23 °C, range 17.4–28.9). PH varied from acidic (pH 6.2) at the Headwaters in summer to alkaline (pH 9.2) in spring at Kambi and winter at Langeni. Even though dissolved oxygen (TDO) showed little variation across sites, it was high in winter at Kambi. Mean variation of electrical conductivity across sites was high, and ranged from 39 µS/cm (range 27–51) in autumn at the Headwaters to 1643 µS/cm (range 1442–1844) at Ntsaka in autumn. While all vegetation categories (aquatic, riparian and algae) were recorded in Ntsaka, only riparian vegetation occurred in the other SUs across sites and sampling period.
Table 3. Environmental variables (mean, with range in parentheses) at SUs across sites: Headwaters (H), Langeni (L), Kambi (K) and Ntsaka (N).
Response of benthic macroinvertebrates to measured site variables
Eigenvalues for CCA ordination tri-plot and species-environmental variable correlations were strong (). Although Monte Carlo permutation tests for axis 1 was not significant (F = 2.7; P > 0.05), tests for all four canonical axes (Global test) were significant (F = 2.5; P < 0.05). Cumulative percentage variance of species-environmental variable relations for axis 1 and 2 was 63.7%, with species clustered to the center of the CCA ordination tri-plot (). This suggests that no single environmental variable fully explained species composition and distribution pattern across sites. However, intra-set correlation showed that pH, conductivity, TDO, temperature and some vegetation categories accounted for species composition and distribution across sites ().
Table 4. Weights of the first canonical correspondence analysis (CCA) for benthic macroinvertebrate assemblages recorded at Headwaters (H), Langeni (L), Kambi (K) and Ntsaka (NT) in 2015–2016. Variances explained by both axes are given. The results of the Monte Carlo permutation tests are shown for axis 1 and all four axes of the CCA ordination.
Table 5. Correlation between measured environmental variables and benthic macroinverebrates at site sampling units in 2015–2016. CND = conductivity, TDO = Total dissolved oxygen, Aqua veg = aquatic vegetation, Rip veg = riparian vegetation.
Discussion
According to Shannon diversity (H’) and Pielou evenness (J’) indices trends, higher richness and abundance of benthic macroinvertebrates were recorded at the Headwaters, with 11 species (15% of the total number of species recorded) restricted to this site. Five additional species occurred only at Headwaters and Langeni sites probably due to optimal habitat conditions, resource availability and comparatively lower levels of anthropogenic impacts at these two sites (Wolmarans et al. Citation2014; Niba and Mafereka Citation2015). This is not surprising as relatively higher numbers of pollution-sensitive taxa, e.g. Ephemeroptera, Plecoptera, Trichoptera and Odonata (EPTO) occurred mainly at these sites. However, not all species or even families belonging to the EPTO group are highly sensitive (Dickens and Graham Citation2002). Baetis harrrisonii (Baetidae) is probably the most common mayfly in South Africa, occurring at virtually all benthic habitats. Very low counts of the Chironomini sp. (nind = 1–10) representing the habitat-tolerant family Chironomidae occurred at Langeni and Ntsaka SUs (down the Mthatha River) probably as a result of lower biotope quality at these two sites compared to other site SUs up the river.
Temporal trends in species richness and abundance
The use of benthic macroinvertebrates to evaluate water quality allows for detection of temporal episodes that occur during seasons and between sampling stations, which physico-chemical assessments alone cannot establish (Dickens and Graham Citation2002; Niba and Samways Citation2004). Thus, a combination of biological and physico-chemical methods as proposed by Duran (Citation2006) is best suited for determining water quality at different seasons.
Overall lower macroinvertebrate richness in summer may be attributed to higher rainfall, resulting in increased river flow velocity especially in Kambi and Ntsaka (). The high electrical conductivity values recorded at these two sites probably resulted from increased run-off from agricultural, milling and other anthropogenic activities and could explain the overall low species richness and abundance trends here. On the other hand, higher species counts in April at Langeni may have been due to higher habitat complexity, shelter from predators and resource availability, while lower species counts at sites may have been associated with less optimal habitat conditions (Simaika and Samways Citation2011). Seasonal trends in macroinvertebrate occurrence along the Mthatha River will need to be studied further with a closer analysis of species life cycles (Niba and Mafereka Citation2015).
Effects of measured variables on species distribution
Benthic macroinvertebrate species populations respond differently to disturbance regimes and many species have different habitat requirements at each stage of their developmental life cycle (Simaika and Samways Citation2011). Most species in this study clumped at the center of the CCA ordination tri-plot suggesting that no specific environmental variable defined species distribution patterns observed. However, degrees of importance of measured variable gradients denoted by length of arrow on the ordination plot and their related intra-set correlation coefficients could be selected. These were electrical conductivity, pH, temperature, dissolved oxygen (TDO) and vegetation characteristics.
Electrical conductivity across sites ranged from 39 to 1643 µS/cm, and was within the range required for other freshwater bodies in South Africa (De Kock and Wolmarans Citation1998). This environmental variable gradient increased in value from 27 µS/cm at the Headwaters in autumn to 1844 µS/cm downstream in Ntsaka during winter (), and was consistent with the disturbance trends at sites that increased from Headwater to Ntsaka SUs. This variable occurred on axis 1 of the ordination tri-plot, and probably accounted for the occurrence and distribution of Pseudagrion sp, and Ceratogomphus sp at Ntsaka SUs.
Simaika and Samways (Citation2011) have noted the importance of pH in structuring benthic macroinvertebrate assemblages in the naturally acidic Tsitsikama River, compared with the neutral to slightly acidic Mthatha River. Most freshwaters in South Africa are relatively well buffered and more or less neutral, with pH ranges of 6–8 (Thiere and Schultz (Citation2004). Although minimum pH values were never lower than the minimum values of the pH range for African freshwater bodies (Holmes Citation1996), maximum values in this study (mean 8.9, range 7.8–9.2) occurred in spring at Kambi. The pH and temperature gradients in this study were positively correlated with axis 1 of the CCA ordination, and probably determined the composition and distribution of Trichocorixa sp., Hydropsyche sp., Brachythemis leucosticta, B. lacustris and Trithemis dorsalis at Kambi SUs.
Annual rainfall in South Africa ranges from 100to 1200 mm, and this variability is usually magnified in the hydrological cycle of streams and rivers (Eady et al. Citation2013). This phenomenon in turn plays a critically important role in determining the energy dynamics and therefore thermal requirements of benthic fauna (May Citation1976, Citation1984). Higher temperature ranges of 9.5 °C (winter) to 28 °C (summer) at Kambi and similar trends across sites () probably influence biotope requirements and hence the assemblage structure of benthic macroinvertebrates during the study period.
Dissolved oxygen (TDO) is not only influenced by river flow velocity but also the mechanisms of storage, distribution and transport of fine sediments on the river bed (Miserendino and Masi Citation2010). TDO was generally higher at the Headwaters and Langeni SUs that were associated with riffles and run biotopes, respectively. This probably enhanced the recruitment of diverse benthic faunal communities, as a result of optimal habitat conditions (Kefford et al. Citation2010). Lower values of dissolved oxygen and therefore faunal richness were associated with Kambi and Ntsaka. It may be possible that as the Mthatha River flows downstream, more contaminants from the catchments get into the river.
Effects of vegetation
Vegetation plays an important role in aquatic ecosystems by providing habitat complexity, shelter, breeding sites, substrata for periphyton and abundant resources for many aquatic fauna (Ali et al. Citation2007; Valinoti et al. Citation2011). Thus, the replacement of indigenous plant species by exotics in riparian zones can affect the quality of available detritus and colonization by detritivores (Konig et al. Citation2014). Riparian vegetation may also play a role in protecting benthic fauna from the direct effects of UV radiation (Quinn et al. Citation2004). Furthermore, macrophytes produce oxygen through photosynthesis and so create more optimal biotope conditions (Tillin et al. Citation2008).
In this study, even though riparian vegetation was important across sites (especially at Headwaters and Langeni) and accounted for faunal distributions, aquatic and algae vegetation characteristics were positively correlated with axis 1 of the CCA ordination tri-plot in determining benthic macroinvertebrate assemblage composition and distribution at Ntsaka SUs.
Macroinvertebrate sensitivity
Both rare/habitat restricted and common/widespread benthic macroinverebrates were sampled during the study. Of the 71 species recorded across all SUs, seven species occurred across all SUs with population ranges of (nind = 1–338). Eleven species of which 4 (nind = 1) and 7 (nind = 1–10) were restricted to the Headwater SUs while four, three and five species were restricted to Langeni, Kambi and Ntsaka SUs, respectively (). These species can be used as potential indicators for assessing the quality and conservation value of such habitats along the Mthatha River.
Bio-monitoring implications
Habitat patch level management along the Mthatha River system should aim at preserving sufficient indigenous vegetation categories (riparian, aquatic and algae), especially during summer season when habitat requirements are optimal for most growth stages of benthic macroinvertebrate taxa. Higher family and species richness and abundance for pollution-sensitive members of the EPTO group were mostly recorded at Headwaters and Langeni SUs. The habitat at Kambi and Ntsaka, located lower down the river, need to be improved to approach natural conditions.
Both rare/habitat restricted and common/widespread benthic macroinvertebates identified in this study can be used as indicators for assessing the ecological integrity of the Mthatha River system. The practicality of using species-level surveys on a routine basis can be challenging, given the lack of available taxonomic expertise and time constraints. It might be advisable to select a few indicator species identified in this study and to monitor them as surrogates for the whole community.
Acknowledgments
The authors express their appreciation to Helen James, Freshwater Invertebrate Collection, Albany Natural Science Museum, Grahamstown, South Africa for assistance in species identification and for granting access to this facility. The running expenses of this study were covered by the National Research Foundation (NRF) through the Directorate for Research Development, Walter Sisulu University.
Disclosure statement
There is no potential conflict of interest by us.
Additional information
Funding
Notes on contributors
Augustine Niba
Augustine Niba is a senior lecturer and researcher at the Department of Biological & Environmental Sciences, Faculty of Natural Sciences, Walter Sisulu University, Eastern Cape Province, South Africa.
Selunathi Sakwe
Selunathi Sakwe is a masters student at Department of Biological & Environmental Sciences, Walter Sisulu University and researcher with the Ministry of Water Affairs and Sanitation, Nelspruit, Mpumalanga Province, South Africa.
References
- Ali MM, Mageed AA, Heikal M. 2007. Importance of aquatic macrophyte for invertebrate diversity in large subtropical reservoir. Limnologica. 37:155–169.
- Alvarez-Cabria M, Barquin J, Juanes JA. 2010. Spatial and seasonal variability of macroinvertebrate metrics: do macroinvertebrate communities track river health? Ecol Indicators. 10:370–379.
- Appleton CC. 2002. Platyhelminthes. In: Day JA, De Moor IJ, editors. Guide to the freshwater invertebrates of southern Africa, non-arthropods. Pretoria: Water Research Commission (WRC). Report No. TT 182/02; p. 12–15.
- Bray JR, Curtis JT. 1957. An ordination of the upland forest communities of Southern Wisconsin. Ecol Monogr. 27:325–349.
- Buchwald R. 1992. Vegetation and dragonfly fauna-characteristics and examples of biocenological field studies. Vegetatio. 101:99–107.
- Clark KR, Warwick RN. 2001. Change in marine communities: an approach to statistical analysis and interpretation. 2nd ed. Plymouth: PRIMER-E.
- Dallas HF. 2004. Seasonal variability of macroinvertebrate assemblages in two regions of South Africa: implications for aquatic bio-assessment. Afr J Aquat Sci. 29:173–184.
- Dallas HF, Day JA. The effects of water quality variables on river ecosystems: a review. Pretoria: Water Research Commission; 1993. (WRC Report No.TT 61/93).
- De Kock KN, Wolmarans CT. 1998. A re-evaluation of the occurrence of freshwater molluscs in the Kruger National Park. Koedoe. 41(1):1–8.
- De Moor FC, Scott KMF. Trichoptera. In: De Moor IJ, Day JA, De Moor FC, editors. Guide to the freshwater invertebrates of southern Africa, Hemiptera, Megaloptera, Neuroptera, Trichoptera and Lepidoptera. Pretoria: Water Research Commission (WRC). Report No. TT 214/03; p. 6–11.
- Dickens CWS, Graham PM. 2002. The South African Scoring System (SASS) Version 5 rapid bio-assessment system for rivers. Afr J Aquat Sci. 27:1–10.
- Duran M. 2006. Monitoring water quality using benthic macroinvertebrates and physico- chemical parameters of Behzat stream in Turkey. Pol J Environ Stud. 15:709–717.
- Department of Water Affairs and Forestry (DWAF). 1996. South African water quality guidelines. Pretoria; p. 24–26.
- Eady BR, RiversMoore M, Hill TR. 2013. Relationship between water temperature, predictability and aquatic macroinvertebrate assemblages in two South African streams. Afr J Aquat Sci. 38:163–174.
- Fatoki OS, Muyima NYO, Lujiza. 2001. Situation analysis of water in the Umtata River catchment. Water South Africa. 27:467–473.
- Gerber A, Gabriel MJM. 2002. Aquatic invertebrates of South African rivers field guide. Pretoria: Institute for Water Quality Studies, Department of Water Affairs and Forestry.
- Hart R, Stewart BA, Bickton I. 2003. In: Day JA, Steawrt BA, De Moor IJ, Louw AE, editors. Guidlines to the freshwater invertebrates of southern Africa, Crustacea. Pretoria: Water Research Commission (WRC). Report No. TT 141/01; p. 15–22.
- Holmes S. 1996. South African water quality guidelines. Vol.7, Aquatic ecosystems. Pretoria: Department of Water Affairs and Forestry (DWAF). Government Printer. p. 145.
- Jun YC, Kim, N-Y, Park SH, Hwang SJ. 2016. Spatial distribution of benthic macroinvertebrate assemblages in relation to environmental variables in Korean nationwide streams. Water. 8:1–12.
- Kefford BJ, Zalizniak L, Dunlop JE, Nugegoda D, Choy SC. 2010. How are macroinvertebrates of slow flowing lotic systems directly affected by suspended and deposited sediments? Environ Pollut. 158:543–550.
- Konig R, Hepp LU, Santos S. 2014. Colonisation of low- and high quality detritus by benthic macroinvertebrates during leaf breakdown in subtropical streams. Limnologica. 45:61, 68.
- May ML. 1976. Thermoregulation and adaptation to temperature in dragonflies (Odonatologica: Anisoptera). Ecol Monogr. 46:1–32.
- May ML. 1984. Energetics of adult Anisoptera, with special reference to feeding and reproductive behaviour. AdvOdonatol. 2:95–116.
- Miserendino ML, Masi CI. 2010. The effects of land use on environmental features and functional organization of macroinvertebrate communities in Patagonian low order streams. Ecol Indicators. 10:311–319.
- Nelson HG. 2007. Elmidae. In: Stals R, De Moor IJ, editors. Guides to the freshwater invertebrates of southern Africa, Coleoptera. Pretoria: Water Research Commission (WRC). Report No. TT 320/07; p. 6–10.
- Niba AS, Mafereka SP. 2015. Benthic macroinvertebrate assemblage composition and distribution pattern in the upper Mthatha River, Eastern Cape, South Africa. Afr J Aquat Sci. 40(2):133–142.
- Niba AS, Samways MJ. 2004. Significance of temporal changes when designing a reservoir for conserving dragonfly diversity. Biodivers Conserv. 14:165–178.
- Phiri C, Chakona A, Day JA. 2012. Macroinvertebrate associated with two submerged macrophytes, Lagarosiphonilicifolius and Vallisneria aethiopica, in the Sayati Basin, Lake Kariba, Zimbabwe: effect of plant morphological complexity. Afr J Aquat Sci. 37:277–288.
- Quinn JM, Boothroyd IKG, Smith BJ. 2004. Riparian buffers mitigate effect of pine plantation logging on New Zealand streams. Forest Ecol Manage. 191:129–149.
- Simaika JP, Samways M J. 2011. Comparative assessment of indices of freshwater habitat conditions using different invertebrate taxon sets. Ecol Indicators. 11:370–378.
- Ter Braak CJF. 1988. CANOCO - A FORTRAN program for canonical community ordination by partial detrended correspondence analysis, principal component analysis and redundancy analysis (version 2.1). Wageningen: Agricultural Mathematics Group. Technical Report No. LWA 88-03; p. 120–139.
- Ter Braak CJF, Smilauer P. 2002. CANOCO reference manual and canodraw for Windows user's guide: software for canonical community ordination (version 4.5). New York: Microcomputer Power; p. 39–48.
- Thiere G, Schultz R. 2004. Runoff-related agricultural impact in relation to macroinvertebrate communities of the Lourens River, South Africa. Water Res. 38:3092–3102.
- Tillin HM, Rogers SI, Frid CLJ. 2008. Approaches to classifying benthic habitat quality. Mar Policy. 32:455–464.
- Valinoti E, Ho CK, Armitage AR. 2011. Native and exotic submerged aquatic vegetation provide different nutritional and refuge values for macroinvertebrates. J Exp Mar Biol Ecol. 409:42–47.
- Wolmarans CT, Kemp M, De Kock KN, Roets W, Van Rensburg L, Quinn L. 2014. A semi-quantitative survey of macro-invertebrates at selected sites to evaluate the ecosystem health of the Olifants River. Water South Africa. 40:245–254.