
 ?Mathematical formulae have been encoded as MathML and are displayed in this HTML version using MathJax in order to improve their display. Uncheck the box to turn MathJax off. This feature requires Javascript. Click on a formula to zoom.
Abstract
Commercial harvest of White Suckers Catostomus commersonii for bait in the American Lobster Homarus americanus industry is minimally regulated in Maine and there are concerns as to the influence of increasing harvest. We built a population model using parameters (i.e. age-specific mortality, age at maturity, and size-specific fecundity) from literature and field studies to investigate the theoretical effects of harvest mortality on age structure. Because stock-recruitment relations are poorly characterized for this species, we explored the influence of both Beverton-Holt and Ricker recruitment processes. Our base model closely resembled the empirical age structures reported from three unfished lakes in Maine, with four percent of fish in the modeled spawning run being age-10 or older. We assessed the additive effects of harvest mortality on age structure using the full range of possible mortalities. As expected, increased harvest mortality in the model resulted in a decline and disappearance of older age-classes such that few fish greater than age-10 remained in the population under a realistic harvest mortality scenario. This age-truncation was qualitatively comparable to data from aggregate age distributions reported from three commercially harvested lakes in Maine. Because the loss of older fish may compromise population viability, this model is a valuable guidance tool for managers to craft regulation of this growing fishery.
Introduction
The risks of selective harvest through commercial fishing have been a growing concern for managers throughout the world. A major risk is the selective removal of the oldest members of the population which can truncate age distribution. This has been documented in many long-lived marine fish. Large and fecund individuals are often selected, which are usually old females (Anderson et al. Citation2008; Brunel Citation2010). The resulting population may then be dominated by smaller individuals, consisting of disproportionately younger males. Such shifts can be a liability for the population. In the short term, the loss of older individuals can reduce mean age of maturity, thereby reducing total egg production (J⊘rgensen et al. Citation2007; Brown et al. Citation2008; Brunel Citation2010), which can be a risk long term if harvest remains persistent (Trippel Citation1995; Conover et al. Citation2009; Sharpe and Hendry Citation2009).
For freshwater species, little is known about the risks of commercial harvest. In North America, Sucker species (catostomids) have been important for both recreational and commercial harvest, yet the effect on population structure is poorly understood. For more than 100 years, the Missouri, Mississippi, and St. Francis Rivers have supported active commercial fisheries for Buffalo Fish Ictiobus sp. as a food source (Tripp et al. Citation2012; Missouri Department of Conservation Citation2016). In Michigan, several species (e.g. Northern Hogsucker Hypentelium nigricans, Redhorse Moxostoma sp., White Sucker Catostomus commersonii, Ictiobus sp., and Longnose Sucker C. catostomus) have been and remain recreationally popular for spring angling and spearfishing. These species also represent a significant incidental harvest by commercial fisherman (Michigan Department of Natural Resources Citation2016). The Lost River Sucker Deltistes luxatus was recreationally and commercially harvested in the Klamath Basin through the 1970s which is said to have contributed to a population crash in the 1980s (Cooke et al. Citation2005; Janney et al. Citation2008). For catastomid species, research of harvest impacts on age structure is lacking; however, they have similarities to other well studied long-lived exploited fishes and the risks associated with harvest may be comparable.
Since 1991 there has been an active White Sucker fishery in Maine that targets migrating individuals (both pre- and post-spawning). These fish provide an important source of fresh bait for the American Lobster Homarus americanus industry. They are harvested via trap net or dip net, with minimal regulation on the size of the gear. The Maine Department of Inland Fisheries and Wildlife (MDIFW) does not limit permit numbers each season, and does not currently require harvesters to report yearly catch totals. As a result, the scale and potential impacts of this fishery on White Sucker populations and the ecosystem are poorly characterized. To mitigate the possible risks of high harvest effects, MDIFW has closed a number of waterbodies to harvest (Merry Gallagher, MDIFW, Personal Communication, 2016); information as to sensitivity of populations to harvest has been identified as a critical management need for the State of Maine.
Studying the age structure of White Suckers could give managers a better understanding of the significance of harvest rate impacts on the species. Long-term monitoring on a population is most effective in assessing demographic shifts, however, field based approaches can be prohibitively expensive and time consuming (Hubert and Quist Citation2010). Though empirical data on the influence of harvest on White Sucker is sparse, Begley et al. (Citation2017) recently compared the demographics of migrating White Suckers among six lakes in Maine (three harvested and three unharvested) which provides a realistic assessment of fished and unfished waterbodies in Maine. Based on the reported differences in size and age distribution for lakes in this study, greater rates of mortality were attributed to commercial fishing in harvested lakes. The data from Begley et al. (Citation2017) is limited in that it only provides a snapshot of age distributions; however, these data can be a valuable reference to which a heuristic model of fishing mortality or regulation can be compared.
For this study, we investigated the theoretical effects of commercial harvesting on White Suckers by investigating sensitivity of lake populations through a population model. We applied demographic and life history parameters from literature sources, drawing heavily on Begley et al. (Citation2017) for Maine specific biological data (i.e. length at age, recruitment to adulthood, adult survival, and size-fecundity relationships). In addition, we used recent data collected by MDIFW from a White Sucker removal project (Little Moxie Pond) in Maine in order to impose a realistic carrying capacity for the model population. Using these sources to inform life history parameters, we built a deterministic population model of White Suckers ( provides a conceptual diagram). Our objectives were to (i) characterize sensitivity of population age structure to range of realistic harvesting pressures, and (ii) compare modeled mortality rates and age structures with empirically assessed mortality and age-structures reported for White Suckers from fished and unfished field sites reported in Begley et al. (Citation2017). We constructed this model to be used by managers as a valuable guidance tool to craft regulation of this growing fishery.
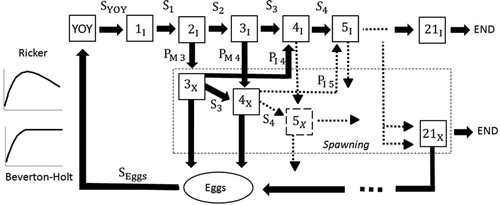
Figure 1. Conceptual model for White Suckers. Stock-recruitment relations were simulated using either Ricker or Beverton-Holt recruitment processes. Each box represents an age-class, YOY is young of the year, S is survival, I represents non-reproductive individuals, P represents probability of maturing at a given age, X represents mature individuals, Eggs is the total number of eggs produced in a season from each mature age-class, and END limits White Sucker life expectancy to 21.
Methods and materials
Design and assumptions
We built a deterministic age-structure model using STELLA ISEE Systems software that advanced on a yearly time step. We note that this is essentially a Leslie matrix based model using STELLA as a platform of convenience for construction and data collection (Caswell Citation2001). This software created a graphical representation of the White Sucker life cycle allowing us to construct and parameterize age-classes with probabilities of mortality, maturity, and length-dependent fecundity (). Under this generalized structure, the initial number of fish in a given age class directly determines the number of fish “alive” in each following age-class for the years that follow. In the construction of this model we made the following simplifying assumptions: (i) the population had equal proportion (50:50) of males and females, (ii) only reproductively mature fish were subject to harvest (though some immature fish may be captured during a spawning migration; Begley et al. Citation2017), (iii) harvesting mortality was additive, (iv) the recruitment of young of year (YOY) was affected solely by reproduction potential, and (v) life history parameters were not influenced by environmental stochasticity. We recognize that natural factors, such as temperature and predation, have been proven to affect recruitment survival, however due to lack of data we were unable to incorporate those in the White Sucker model.
Age-classes and maturation
The maximum life expectancy of White Suckers is poorly characterized but potentially long. Maximum observed ages range from twenty-one (Trippel and Harvey Citation1989) to twenty-three (Smith et al. Citation2008). In Maine, Begley et al. (Citation2017) observed fish as old as twenty-six. We conservatively applied the lowest reported maximum age of twenty-one for our model for simplicity as fish older than twenty years are rare and likely have a minimal biological contribution. Thus a mortality probability of 1.00 was applied to all age-21 fish ().
White Suckers are iteroparous and may reproduce in non-consecutive years if environmental conditions limit available surplus energy (Geen et al. Citation1966; Trippel and Harvey Citation1989; Doherty et al. Citation2010). Maturity occurs between the ages of two to six years (Munkittrick and Dixon Citation1988; Thompson and Beckman Citation1995) and males often mature earlier than females (Chen and Harvey Citation1994; Wakefield and Beckman Citation2005; Smith et al. Citation2008). Begley et al. (Citation2017) observed migrating and reproductively mature male fish as young as age-2 that represented less than two percent of the spawning run; mature females were first captured at age-3 (representing three percent of the total run). Therefore we used age-3 as the first age of maturity and applied probability of spawning to males and females equally.
The age-specific proportion of fish mature (P) during spawning reported in Wakefield and Beckman (Citation2005) was used for age-4 fish (PAge 4 = 0.30) and age-5 fish (PAge 5 = 0.60); a P of 1.00 was attributed to all fish age-6 or older. In the absence of a reported probability of maturity for age-3 fish, but acknowledging that younger age-classes have lower probabilities of maturation (Berkeley et al. Citation2004), we arbitrarily set PAge 3 at 0.20.
To account for intermittent reproduction, we assigned each reproducing class a probability of spawning. Information for this parameter varies greatly. Geen et al. (Citation1966) reported a 0.50 to 0.80 probability spawning sequentially (though individual probability decreased to 0.03 for fish that spawned three consecutive years). In stark contrast, Trippel and Harvey (Citation1989) reported a far lower probability for consecutive spawning based on mark-recapture data (probability = 0.17).
As a compromise, the first year of spawning (age-3 fish) was not assigned a probability of sequential spawning while older fish (age-4 fish through age-21 fish) were assigned a probability of 0.65 (based on Geen et al. Citation1966). To estimate the proportion of spawning fish for each age-class, the joint probability of spawning and sequential spawning was calculated (e.g. for age-4, probability of spawning was calculated as 0.30 · 0.65 = 0.20). Because this was not an agent based model, individuals were not tracked within the population, and the probability of sequential spawning remained consistent for every spawning cycle.
Size and fecundity
Average size at age (201-mm to 474-mm) was assigned based on the estimates provided by Begley et al. (Citation2017) using transverse sections of the lapillus otoliths from spawning adults captured at three lakes not subject to commercial harvest (n = 444). This study also provided a fork length-fecundity relationship for females (n = 437) as an exponential function between fecundity (E) and fork length (FL). This regression was used to determine the number of eggs produced by each spawning individual during the season (Guy and Brown Citation2007) so that:
where a and b are derived constants (R2 = 0.57, p = 0.29; ). For this model the number of eggs produced per individual ranged from 3,910 to 26,060 eggs. We note that this may be a conservatively low estimate as White Suckers have been reported to produce 5,000 to 59,000 eggs during a spawning season (Wakefield and Beckman Citation2005; McPhee Citation2007). We defined the total number of eggs () as the sum of individual fecundity for a spawning season:
Table 1. Parameters used in the population model for White Suckers in Maine. Equations are provided and explained in the Methods section.
which was used as the stepwise input into the YOY recruitment function.
Recruitment of YOY
Recruitment of YOY White Suckers is poorly characterized. Because of this we explored two possible egg to YOY recruitment relations with fundamentally distinct ecological assumptions: Beverton-Holt (Beverton and Holt Citation1957) and Ricker (Ricker Citation1968) recruitment models. Model parameters () were used to define density-dependence (β) and density-independence (α) and their effect on recruitment numbers (Guy and Brown Citation2007). The Beverton-Holt model describes a pattern where YOY compete for limited resources and incorporates compensatory mortality. As such, increased egg production has a diminishing return and YOY approaches an asymptotic level under high production of eggs (Guy and Brown Citation2007):
YOY refers to the number of recruits (at six months), α is the recruitment rate coefficient, is the total egg abundance, and β is the coefficient of density-dependence. In contrast, use of the Ricker curve also assumes intraspecific competition and is dome-shaped. Thus abundance of YOY declines with high egg counts (Guy and Brown Citation2007):
where e is the base of the natural logarithm.
In the absence of comprehensive recruitment data, we used two sources to estimate the recruitment function constants. To estimate α which describes the rate of increase in recruitment in the absence of density effects, data from Johnson (Citation1975) were used. Johnson (Citation1975) recorded both the number of spawning White Suckers and the number of YOY (at six months) after the near complete removal of spawners from a small Minnesota lake (area = 2.45 km2, max. depth = 14.0 m) for two years. Johnson (Citation1975) did not provide age class data for spawners so we assumed the age distribution based on our stabilized base model and prorated year-class egg contributions. Average fork length at age was used to estimate the number of eggs per spawner by employing the fecundity relationship described above (average of 21,513 eggs per individual). We assumed at low density recruitment would be linear due to an absence in intraspecific competition. A line of best fit was generated for the total number of eggs and the total number of YOY (n = 2) with a forced intercept of 0.00. The slope of the line (0.0035) was then used for the α-parameter.
The β-parameter (the capacity parameter) defines the pattern by which a population levels off with increased egg abundance. To estimate β for each recruitment model, we used unpublished data from a MDIFW ten-year White Sucker removal project at Little Moxie Pond (area = 0.30 km2, max. depth = 2.7-meters; Tim Obrey MDIFW, unpublished data). The first three years of removal via trap net (beginning in 1994) resulted in the capture of 11,003, 7,100, and 188 fish. The total number of spawners in the population was estimated using multiple-pass depletion procedures described in Lockwood and Schneider (Citation2000). The maximum likelihood estimate was computed as 19,141 spawning individuals for the Little Moxie Pond population. This was used as our target population for our stabilized base models (unfished). β was estimated by iteration for each of the Beverton-Holt and Ricker curves and two coefficients were estimated. Each recruitment model was run with a set α-parameter (after mortality and YOY recruits were “fixed”) so that the population stabilized at the target of 19,141-spawning individuals by adjusting the β-parameter (as described in Myers et al. Citation1999).
Natural mortality
The estimated natural mortality (M) of White Suckers reported in the literature varies greatly among studies. For the model we used age-1 fish M = 0.97 (McPhee Citation2007) and age-2 through age-21 fish M = 0.25 (; McPhee Citation2007; Miller et al. Citation2013; Begley et al. Citation2017). All mortalities were converted from instantaneous (Z) to interval (A) for each time step in the model (Guy and Brown Citation2007):
where Z = natural mortality (M) + harvesting mortality (F). The recruitment curves defined mortality for the first six months of life for YOY. Mortalities for months six through twelve for first year recruits were estimated by using M for age-1+:
We did this because Johnson (Citation1975) catch numbers for YOY at 6-months of age were used to estimate the α-parameter in the above section. YOY mortality over the remaining six month period was estimated at M = 0.37.
Harvesting mortality
Harvesting mortality (F) was included as an additive source of mortality and impacted only spawning individuals. Catchability of spawning fish was assumed to be equal among age-classes (i.e. age-3 to age-21 fish) though incomplete recruitment to gear is likely for age-3 to age-5 fish in the field (Begley et al. Citation2017). Our model was manipulated with a range of harvesting mortalities (F = 0.00 to 1.00 with no variance) to assess low and high harvest level influence on age structure.
Populating the model
The starting population and age structure were based on a stabilized and unharvested population sampled during spring spawning in 2014 (Begley et al. Citation2017) The Beverton-Holt and Ricker models were run sufficiently long enough (300 years) so that populations were well stabilized at 19,141 spawning individuals (). The proportion of fish in each age-class at the terminal simulation time step were then used to define the initial proportional age structure in the model prior to manipulation. When parameters were changed to assess sensitivity and harvesting effects, the models were also run for 300 years to ensure model stabilization.
Assessing sensitivity
Local sensitivity of the model outputs was evaluated by altering input life history parameters by 1% (Haefner Citation2005; Risley and Zydlewski Citation2010; Bailey and Zydlewski Citation2013). Assessed parameters included α, β, natural mortality (M), the fecundity-fork length relationship constants (a and b), probability of spawning of young age-classes (where recruitment was less than 1.0), was assessed in aggregate (i.e., a 1% change was imposed on PAge 3, PAge 4, and PAge 5, for the analysis). The change in outputs of ET, YOY, spawner number and total population size for a given year were compared with outputs for the base model. Sensitivity (Se) was calculated as:
where is the model result for the altered parameter,
is the model result for the unaltered parameter,
is the altered parameter, and
is the nominal parameter. A measurement was considered sensitive if |Se| was greater than 1.00.
Comparison of model outputs to empirical data
As a general assessment of model performance, the age structure from the stabilized base model was compared to the age structure of White Suckers pooled across unfished lakes (n = 3) and fished lakes (n = 3) reported in Begley et al. (Citation2017). While individual lakes were qualitatively different in age distributions, we chose to use pooled data simply to increase observations as coarse reference for model assessment. Age frequency distributions from unfished lakes were compared with the base model (no imposed fishing mortality) using a Kolmogorov-Smirnov two-sample test (K-S). We assessed the ability of the model to predict individual age-class proportions by regressing model outputs against empirically derived proportions from the unfished lakes.
We also assessed the predictability of both recruitment models by comparing them to harvested lakes in Maine. The model was run using the average harvest mortality (F = 0.466) reported in Begley et al. (Citation2017). As with the unfished lakes, age structures were compared between empirical and theoretical data using the K-S test. Individual age-class proportions from the harvested model were also regressed against empirically derived proportions from the harvested lakes.
Comparison of recruitment models on theoretical harvest
We modeled change in the biomass (kg) of White Suckers harvested under varying levels of additive mortality (F = 0.00 to 1.11). This was calculated for both the first year of harvest and when the population had stabilized to provide an estimate of sustained total biomass yield. The mass of fish harvested was estimated for both Beverton-Holt and Ricker recruitment models (parameters shown in ).
Results
General pattern
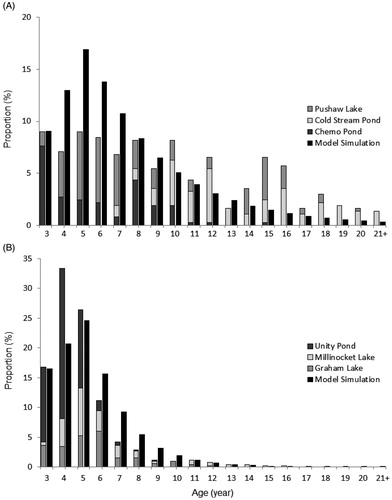
The age structure of the base model (a population not subject to harvest) had a high number of spawning fish in the younger age-classes (i.e. age-3 to age-8) with a slow decline in proportion of fish as age-class increased (). The modeled age distribution was dominated by age-4 through age-8 fish (approximately 50% of the population) with less than 10% of the population consisting of age-18 fish or greater. The output of age distribution from our model is generally consistent with field observations. When the proportion of fish per age-class was compared to empirical data from unfished lakes, both age structures were similar (; D-statistic = 0.135, p = 0.325). This model explained a high proportion of the variation in age class distribution from empirical data from unfished lake (R2 = 0.601, p = 0.175). However deviation from model predictions are notable for several age classes from unfished lakes (e.g age-15 and age-16) that are represented by strong year classes ().
Figure 2. Comparison of actual and model data age structures of White Sucker populations (a) closed to harvest and (b) open to harvest. The field data in panel A consist of three unfished lakes combined, and the field data in panel B consist of three fished lakes combined (F = 0.466; see Begley et al. Citation2017). Gray bars represent actual data, black bars represent model data.
Sensitivity
Sensitivities in the base model varied between parameters. As would be expected, change in α-parameter resulted in a positive effect on all density outputs, while egg production and spawner output were negatively affected with a natural mortality change (; Se−1.00). Egg production was also sensitive to changes in fecundity constants (a, b; Se
1.00). A 1% increase on the probability of spawning for early age classes had little to no effect on the modeled population, reflecting the relatively greater contribution of older age classes.
Table 2. Sensitivity (Se) analysis of White Sucker population density after a 1% increase in the α-parameter, β-parameter, natural mortality (M), fecundity function constants (a and b), and probability of recruitment to spawning for young spawners (PAges4-6). Sensitivities were run for both the Ricker and Beverton-Holt recruitment curves. ET represents the total number of eggs produced in a spawning season, YOY is recruitment to six months, and Spawner is total number of predicted spawning adults.
Harvesting mortality
The output of the model revealed age truncation under harvest scenarios that increased in severity as harvest levels increased. When the model was subject to the average estimated harvesting mortality reported by Begley et al. (Citation2017; F = 0.466), the age distribution visually followed the same approximate pattern, however the K-S test revealed a difference (; D-statistic = 0.222, p = 0.015). That withstanding, nearly ninety percent of the variation in age-class proportions was explained when regressing the output of the harvested model and empirically derived proportions from harvested lakes (R2 = 0.887, p = 0.118). With harvesting mortality, both the simulated results and field data experienced a strong truncation of the age-distribution. The age-distribution was dominated by age-3 to age-6 fish (more than 70% of the spawning run) with less than 5% of the spawners older than age-10.
Recruitment curves
Because all other parameters were the same, the Ricker base model produced the same proportional age-class distribution as the Beverton-Holt base model when stabilized. As expected, the Ricker model had different parameter sensitivities than the Beverton-Holt model (). YOY, spawners, and population density outputs were negatively affected by a change in β-parameter (; Se −1.00). Egg production was sensitive to a fecundity constant increase in b (Se
1.00), while the density of YOY, spawners, and population were negatively affected (Se
−1.00). YOY output had a positive response to an increase in mortality (Se
1.00).
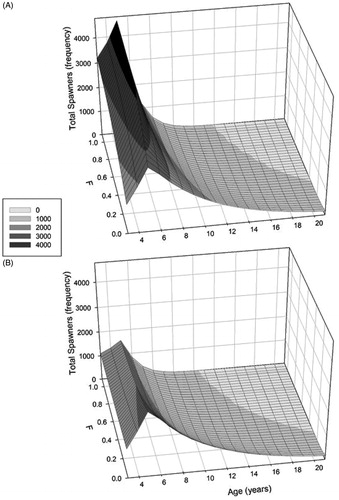
With harvesting pressure, models incorporating either recruitment curve produced the same proportions of fish by age structure, however the magnitude of the spawning runs differed (). The Ricker model produced a greater population size and conversely the Beverton-Holt model had a lower number of spawners (). Under high harvest, the Ricker model had higher numerical values of remaining fish in the younger age class with a steep decline in spawners as harvesting increased ().
Figure 3. The age structure of a White Sucker population post harvesting (F) using the Ricker (a) and Beverton-Holt recruitment models (b).
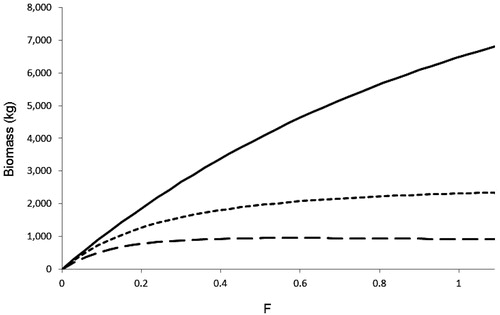
The biomass of White Suckers harvested during the first year was the same for both recruitment curves () but under chronic harvest, the dynamics of the two models differed. The projected harvests diverged noticeably even at low fishing mortality (i.e. F of 0.05; ). The Beverton-Holt recruitment based model experienced a greater impact of harvest over a range of fishing pressures, reaching an asymptote as F approached 0.3. In contrast, the Ricker recruitment based model imposes a strong positive feedback on recruitment as adults were removed, increasing younger age-classes relative to the Beverton-Holt model. Under this recruitment function, overall sustained harvest is lower at all levels of fishing than initial harvest, though the maximum sustained harvest was twice that of the Beverton-Holt recruitment based model at all but the lowest fishing rates.
Figure 4. Modeled change in the biomass (kg) of White Suckers harvested under varying levels of additive mortality (F = 0.00 to 1.11). Solid line represents the biomass of fish harvested at the first year of harvest for both the Beverton-Holt and Ricker models. The long dashed line represents the amount harvested after values stabilized in the Beverton-Holt model, and the small dashed line represents the amount harvested after values stabilized in the Ricker model.
Discussion
Using input from a number of sources, we designed a population model for White Sucker that has demographic outputs consistent with field observations. By comparing our base model data with aggregate reference data from Begley et al. (Citation2017), we increased our confidence that the model outputs were a reasonable portrayal of patterns seen in nature. We highlight deviations between our simplified model and field datasets (i.e. strong or weak year-classes) that incorporate stochastic influences on recruitment and survival (Larkin Citation1977; Hilborn and Walters Citation1992; Winemiller Citation2005). Additionally, we note that many of our parameters were derived from limited and imperfect data, thus this model framework can be improved upon as more appropriate field data are available. These limitations withstanding, this model provides an appropriate means to assess the theoretical influence of harvest pressure on White Sucker demographics.
With the incorporation of harvest mortality into the model, we were able to predict a clear truncation of age distribution in White Sucker populations subjected to a range of imposed fishing mortalities. This is consistent with field observations in lakes open to harvest. Begley et al. (Citation2017) reported that harvested populations had markedly younger age structures than populations of White Suckers in lakes closed to harvest. Age truncation has been documented and widely recognized as a demographic outcome of high exploitation in a number of fish species. Ricker (Citation1981) reported decreases in age structures for five species of Pacific Salmon (Oncorhynchus spp.) in British Columbia. The Atlanic Cod Gadus morhua fishery was forced to close after 350 years of prolonged truncation effects that culminated in a population crash (Trippel Citation1995). In addition, European Hake Merluccius merluccius populations have shown the same signs of age truncation (Durant et al. Citation2013).
When we incorporated the average harvest mortality reported in Begley et al. (Citation2017), model predictions visually approximated field observations from the harvested lakes, but the output deviated from the aggregate demography. This was likely due to the high variability seen in estimated mortality among harvested lakes. It is not unreasonable to assume that each lake might respond differently based on both environmental conditions and harvesting practices, making a site-specific analysis more appropriate. In the absence of sufficient field data from each site to accomplish this, however, our comparison to the aggregate reference demonstrates a strong level of predictive power at a coarse scale. As such we are confident that this model can inform managers as to the potential influence of harvest on White Sucker populations.
It is unclear whether the Beverton-Holt or Ricker recruitment model better describes the early survival of White Suckers in nature, but the differing assumptions implicit in each approach fundamentally changes the theoretical scope for sustained harvest () and total population size under harvest scenarios (). The Ricker curve is often used for species that compete for space during spawning or whose young are extremely territorial (e.g. Pacific salmon, Oncorhynchus spp.). While spawning habitat may be limiting, White Suckers are not aggressive and opportunistically broadcast spawn in areas that have small gravel and flowing water (Geen et al. Citation1966; McManamay et al. Citation2012). Regardless of the actual recruitment pattern, the stabilized modeled age distributions for White Sucker populations do not change and therefore predicted shifts in demography are robust with respect to early recruitment assumptions.
However, model outputs using a Ricker recruitment curve predict a greater sustained harvest potential over a range of fishing pressures () while a Beverton-Holt recruitment curve based model stabilizes at a lower levels of harvest. For both approaches, there are greatly diminished levels of harvest subsequent to the initiation of harvest. In the absence of empirical evidence, these two models produced a range of harvesting responses a population might experience in the field. The Beverton-Holt approach provides a more conservative method for projecting changes in harvest biomass.
Model limitations are important to consider when interpreting and applying recruitment simulations for harvest management (Beverton and Holt Citation1957; Ricker Citation1968). This is a concern when analyzing high harvest levels because simulations may produce results that are overly optimistic with respect to population responses (Hilborn and Walters Citation1992; Hubert and Quist Citation2010) or fail to incorporate fishery-induced selection. Other critical factors (e.g. predator density, temperature, pH, precipitation, spring flow, and food availability) influence population responses and these are often stochasitic (Haefner Citation2005; Hubert and Quist Citation2010). Age truncation may influence spawner recruitment in complex ways. The persistence of old, highly-fecund females are important in habitats that experience high environmental variability because they aid in producing strong year-classes. Simply put, demographic complexity can be important for population resilience in long lived catastomids.
Heavy harvest is implicated as a major factor in the population collapse of the Lost River Sucker on the northwest coast of the United States (though this is a complex story, see Cooke et al. Citation2005; Janney et al. Citation2008). This species mature at age-7 and is long-lived (up to age-43; Janney et al. Citation2008). When the fishery closed in 1987, the total harvest had declined from more than 10,000 spawners to 687 in less than twenty years. Two decades after the fishery closed, there was still no significant recruitment within harvested populations (Janney et al. Citation2008). This case study provides a cautionary tale of a catostomid species that was actively harvested with minimal regulation.
In the United States, there has been limited interest in the White Sucker and in many cases the species is not highly regarded. To the contrary it has been perceived as a threat to game fish and subjected to eradication (Tremblay and Magnan Citation1991; Holey et al. Citation2014) based on the assertion that White Suckers feed on the eggs and fry of recreationally important fish (e.g. Brook Trout Salvelinus fontinalis). However, there has been no evidence to support the claim (see Cooke et al. Citation2005; Holey et al. Citation2014). In spite of this, managers actively engage in White Sucker removal projects (e.g. Little Moxie Pond removal project, MDIFW, unpublished) in an effort to enhance sportfish (Holey et al. Citation2014). This management direction is in stark conflict with a plethora of ecological evidence that White Sucker spawning in spring headwaters delivers critical energy to a number of species within the food web (Hall Citation1972; Sanderson et al. Citation2009; Childress et al. Citation2014). This negative view may also provide an impedement for active management of White Suckers fisheries.
The deterministic model presented here serves as a simple tool for informing decision making in White Sucker harvest management. It provides predictions of age structure response, and isolates the effects of harvesting pressure on population demography. It also provides a thorough review of relevant literature to date. This tool, in conjuction with field data, may be effective in assessing the viability, productivity, and resilience of White Sucker populations. Region specific information would likely improve its utility. Currently lake specific demographic information is limited and in the State of Maine fishing effort and harvest data are not collected. Effective management of White Sucker harvest would benefit from systematic collection of both demographic and fishery data. Additionally parameters such as spawning probability, spawning frequency, and early survival are poorly characterized for this species and remain conspicuous needs for informed White Sucker management.
Acknowledgments
Special thanks to Tim Obrey from MDIFW and the Minnesota Department of Natural Resources for providing data for the analysis. All data generated or analyzed during this study are included in the main text of this publication. Any use of trade, firm, or product names is for descriptive purposes only and does not imply endorsement by the U.S. government.
Disclosure statement
No potential conflict of interest was reported by the authors.
Additional information
Funding
References
- Anderson C, Hsieh C, Sandin S, Hewitt R, Hollowed A, Beddington J, Sugihara R, Sugihara G. 2008. Why fishing magnifies fluctuations in fish abundance. Nature. 452:835–839.
- Bailey M, Zydlewski J. 2013. To stock or not to stock? Assessing the restoration potential of a remnant American Shad spawning run with hatchery supplementation. N Am J Fish Manag. 33:459–467.
- Begley M, Coghlan S, Zydlewski J. 2017. A comparison of age, size, and fecundity of harvested and reference White Sucker populations. N Am J Fish Manag. 37:510–523.
- Berkeley S, Hixon M, Larson R, Love M. 2004. Fisheries sustainability via protection of age structure and spatial distribution of fish populations. Fisheries. 29(8):23–32.
- Beverton R, Holt S. 1957. On the dynamics of exploited fish populations. London: Her Majesty’s Stationary Office.
- Brown C, Hobday A, Ziegler P, Welsford D. 2008. Darwinian fisheries science needs to consider realistic fishing pressures over evolutionary time scales. Mar Ecol Progr. 369:257–266.
- Brunel T. 2010. Age-structure-dependent recruitment: A meta-analysis applied to northeast Atlantic fish stocks. ICES J Mar Sci. 67:1921–1930.
- Caswell H. 2001. Matrix populations models: construction, analysis, and interpretation. Oxford: Sinauer Associates.
- Chen Y, Harvey H. 1994. Maturation of White Sucker, Catostomus commersonii, populations in Ontario. Aquat Sci. 51:2066–2076.
- Childress E, Allan J, McIntyre P. 2014. Nutrient subsidies from iteroparous fish migrations can enhance stream productivity. Ecosystems. 17:522–534.
- Conover D, Munch S, Arnott S. 2009. Reversal of evolutionary downsizing caused by selective harvest of large fish. Proc R Soc. 3:1–6.
- Cooke S, Bunt C, Hamilton S, Jennings C, Pearson M, Cooperman M, Markle D. 2005. Threats, conservation strategies, and prognosis for suckers (Catostomidae) in North America: insights from regional case studies of a diverse family of non-game fishes. Biolo Conservat. 121:317–331.
- Doherty C, Curry R, Munkittrick K. 2010. Spatial and temporal movements of White Sucker: implications for use as a sentinel species. Trans Am Fish Soc. 139:1818–1827.
- Durant J, Hidalgo M, Rouyer T, Hjermann D, Ciannelli L, Eikeset A, Yaragina N, Stenseth N. 2013. Population growth across heterogeneous environments: effects of harvesting and age structure. Mar Ecol Progr. 480:277–287.
- Geen G, Northcote T, Hartman G, Lindsey C. 1966. Life histories of two species of Catostomid fishes in Sixteenmile Lake, British Columbia, with particular reference to inlet stream spawning. J Fish Res Board Can. 23:1761–1788.
- Guy C, Brown M. 2007. Analysis and interpretation of freshwater fisheries data. Bethesda, MA: American Fisheries Society.
- Haefner J. 2005. Modeling biological systems: principles and applications. 2nd ed. New York: Springer.
- Hall C. 1972. Migration and metabolism in a temperate stream ecosystem. Ecol Ecol Soc Am. 53:585–604.
- Hilborn, R., Walters, C. 1992. Quantitative fisheries stock assessment: choice, dynamics, and uncertainty. New York: Chapman and Hall.
- Holey M, Hollender B, Imhof M, Jesien R, Konopacky R, Toneys M, Cobble D. 2014. Never give a sucker an even break. Fisheries. 4:2–6.
- Hubert W, Quist M. 2010. Inland fisheries management in North America. 3rd ed. Maryland: American Fisheries Society.
- Janney E, Shively R, Hayes B, Barry P. 2008. Demographic analysis of Lost River Sucker and Shortnose Sucker populations in upper Klamath Lake, Oregon. Trans Am Fish Soc. 137:1812–1825.
- Johnson F. 1975. Interspecific relationships of Walleye, White Sucker and associated species in a northeastern Minnesota Lake with an evaluation of White Sucker removal for increased Walleye yield. Minn Dept Nat Res Div Fish Wildl Sect Fish Investig Rep. 338:2–49.
- Jørgensen C, Enberg K, Dunlop E, Arlinghaus R, David S, Brander K, Rijnsdorp A. 2007. Ecology: managing evolving fish stocks. Science. 318:1247–1248.
- Larkin P. 1977. An epitaph for the concept of maximum sustained yield. Trans Am Fish Soc. 106:1–11.
- Lockwood R, Schneider J. 2000. Stream fish population estimates by mark-and-recapture and depletion methods. Manual of Fisheries Survey Methods II. 7:1–16.
- McManamay R, Young J, Orth D. 2012. Notes and discussion: spawning of White Sucker (Catostomus commersonii) in a stormwater pond inlet. Am Midland Nat. 168:466–476.
- McPhee M. 2007. Age, growth, and life history comparisons between the invasive White Sucker (Catostomus commersonii) and native Rio Grande Sucker (C. plebeius). SW Nat. 52:15–25.
- Michigan Department of Natural Resources. 2016. Fishing [accessed 2016 November]. www.michigan.gov
- Miller D, Tietge J, McMaster M, Munkittrick K, Xia S, Ankley G. 2013. Assessment of status of White Sucker (Catostomus commersonii) populations exposed to bleached kraft pulp mill effluent. Environ Toxicol Chem. 32:1592–1603.
- Missouri Department of Conservation. 2016. Fishing [accessed 2016 November]. http://mdc.mo.gov
- Munkittrick K, Dixon D. 1988. Growth, fecundity, and energy stores of White Sucker (Catostomus commersonii) from lakes containing elevated levels of copper and zinc. Can J Fish Aquat Sci. 45:1355–1365.
- Myers R, Bowen K, Barrowman N. 1999. Maximum reproductive rate of fish at low population sizes. Can J Fish Aquat Sci. 2419:2404–2419.
- Ricker W. 1968. Handbook of computation for biological statistics of fish populations. Fish Res Board Can Bull. 119:1–301 (Reprinted).
- Ricker W. 1981. Changes in average size and average age of Pacific Salmon. Can J Fish Aquat Sci. 38:1636–1656.
- Risley C, Zydlewski J. 2010. Assessing the effects of catch-and-release regulations on a Brook Trout population using an age-structured model. N Am J Fish Manag. 30:1434–1444.
- Sanderson B, Coe H, Tran C, Macneale K, Harstad D, Goodwin A. 2009. Nutrient limitation of periphyton in Idaho streams: results from nutrient diffusing substrate experiments. J N Am Benthol Soc. 28:832–845.
- Sharpe D, Hendry A. 2009. Life history change in commercially exploited fish stocks: an analysis of trends across studies. Evol Appl. 2:260–275.
- Smith N, Krueger C, Casselman J. 2008. Growth chronologies of White Sucker, Catostomus commersonii, and Lake Trout, Salvelinus namaycush: a comparison among lakes and between trophic levels. Environ Biol Fishes. 81:375–386.
- Thompson K, Beckman D. 1995. Validation of age estimates from White Sucker otoliths. Trans Am Fish Soc. 124:637–639.
- Tremblay S, Magnan R. 1991. Interactions between two distantly related species, Brook Trout (Salvelinus fontinalis) and White Sucker (Catostomus commersonii). Can J Fish Aquat Sci. 48:857–867.
- Tripp S, Herzog D, Reinagel S, McMullen J. 2012. Final report: Missouri commercial fish harvest 2000-2012. Missouri: Missouri Department of Conservation; pp. 1–58.
- Trippel E. 1995. Age at maturity as a stress indicator in fisheries. BioScience. 45:759–771.
- Trippel E, Harvey H. 1989. Missing opportunities to reproduce: an energy dependent or fecundity gaining strategy in White Sucker (Catostomus commersonii)? Can J Zool. 67:2180–2188.
- Wakefield C, Beckman D. 2005. Life history attributes of White Sucker (Catostomus commersonii) in Lake Taneycomo and associated tributaries in southwestern Missouri. SW Nat. 50:423–434.
- Winemiller K. 2005. Life strategies, population regulation, and implications for fisheries management. Can J Fish Aquat Sci. 62:872–885.