
 ?Mathematical formulae have been encoded as MathML and are displayed in this HTML version using MathJax in order to improve their display. Uncheck the box to turn MathJax off. This feature requires Javascript. Click on a formula to zoom.
Abstract
Several studies have shown that lake littoral zones often support high methane (CH4) emissions. In this study, we measured CH4 emissions from two vegetation meadows in the littoral zone of Poyang Lake, China, from October 2014 to May 2015. CH4 emissions in the meadow dominated by Carex cinerascens were 11.27 ± 11.29 mg CH4 m−2 h−1, which were significantly higher than emissions in the meadow dominated by Artemisia selengensis (2.99 ± 1.67 mg CH4 m−2 h−1). Between-species differences in CH4 emission were caused by differences in belowground biomass. The results also showed distinct seasonal variation in CH4 emissions in this area; fluxes reached a maximum at the peak of the growing season and reached a minimum after the summer flood, when plants began to germinate. There were two peak values in the Carex meadow, and belowground biomass controlled the seasonality of CH4 emissions. Our results suggest that plant biomass may be a key factor controlling CH4 emissions in the littoral zone of Poyang Lake, highlighting that CH4 fluxes vary with vegetation type in littoral wetlands and demonstrating that spatial variation in CH4 emissions must be considered when estimating regional CH4 emissions in Poyang Lake. Considering climate change and the operations of a proposed hydraulic engineering project, changes to the hydrologic regime in this region may significantly affect CH4 emissions.
Introduction
Methane (CH4) is an important greenhouse gas with a global warming potential approximately 28 times higher than that of CO2 over a one hundred-year timescale (IPCC Citation2013). High CH4 emissions from lakes, with a contribution of 8 to 48 Tg CH4 yr−1, have attracted increasing interest from the scientific community (Bastviken et al. Citation2004), and freshwater environments contribute over 20% of total CH4 emissions to the atmosphere (Khalil and Shearer Citation1993). However, limited documentation of CH4 emissions from lakes exist (Bastviken et al. Citation2004; Kankaala et al. Citation2004), and most existing studies have looked at boreal lakes (Huttunen et al. Citation2002; Kankaala et al. Citation2004; Walter et al. Citation2007). Littoral zones are biogeochemically active ecotones of lake ecosystems and have high productivity (Juutinen et al. Citation2001; Wang et al. Citation2006). High emissions of CH4 from boreal lake littoral zones have been reported (Nykänen et al. Citation1998; Juutinen et al. Citation2001). China has more than 2721 lakes greater than 1 km2 in area, with a total area of approximately 75,340 km2 (Yang and Lu Citation2014). However, few studies have focused on the littoral zones of lakes in China, especially those that exhibit distinct hydrological variation.
As China’s largest freshwater lake and one of the most important international wetlands, Poyang Lake is a typical subtropical shallow-water lake characterized by dramatic seasonal water level fluctuations. The combined effects of watershed inflows and interactions with the Yangtze River result in significant seasonal variation of approximately 10 m in lake water level (Zhang et al. Citation2014). When the water level recedes in autumn, the lake littoral zone is dominated by adjacent Carex and Artemisia meadows that account for approximately 20% of the total lake area (Tang et al. Citation2016). Carex meadows show two distinct growing seasons, one in the spring and the other occurring in autumn after the previous summer’s flooding (Hu et al. Citation2010), while Artemisia meadows are characterized by only one growing season.
In recent years, the changing climate and operation of the Three Gorges Dam have dramatically altered Poyang Lake’s hydrological regime, particularly by reducing water levels during the drawdown period (Zhang et al. Citation2012a). The flux in methane from the littoral zone of Poyang Lake will be influenced by these variations, and the distinct hydrologic regimes of Poyang Lake offer scientists a unique opportunity to study the exchange of CH4 between the lake ecosystem and the atmosphere. However, to our knowledge, carbon fluxes from Poyang Lake have been poorly documented, with only a small number of studies showing greenhouse emissions in this large subtropical lake. Hu et al. (Citation2015a, 2015Citationb) reported the components of ecosystem respiration from a Carex-dominated meadow in Southern Poyang Lake and evaluated CH4 and N2O emissions during drawdown periods, and Wan et al. (Citation2010) investigated CH4 fluxes and ecosystem respiration in a Carex meadow in Banghu (a region of Poyang Lake). Liu et al. (Citation2013; Citation2017) found that the spatial variability of greenhouse gas effluxes was inhomogeneous in four subregions of Poyang Lake. Limited field measurements of greenhouse gas emissions exist in this region, especially during drawdown periods. Therefore, precise estimation of CH4 budgets at the regional and national levels requires more observations from the field, and CH4 effluxes from largely unexplored subtropical lakes are helpful for re-estimating global wetland CH4 emissions.
The objectives of this study were as follows: (1) to understand CH4 fluxes and their controlling factors in the littoral zone of Poyang Lake during drawdown periods and (2) to explore the implications for large-scale hydraulic engineering.
Methods
Study sites
This study was conducted in northern Poyang Lake, located in Xingzi County (29°26′40″N, 116°3′24″E), Jiangxi Province, China. This study site features a typical subtropical humid monsoon climate; the annual mean air temperature is 18 °C, with a January average of 5.1 °C and a July average of 29.5 °C. The annual rainfall is 1654 mm, 55% of which occurs between March and June.
The lake receives inflows from five main rivers (the Raohe, Xinjiang, Fuhe, Ganjiang and Xiushui) and discharges into the Yangtze River by a narrow passage. The annual drawdown periods range from 165 to 271 days, depending on local rainfall as well as the hydrologic characteristics of the Yangtze River (Liu et al. Citation2006; Hu et al. Citation2010). During drawdown periods, Carex and Artemisia meadows are distributed zonally along an altitude gradient with extremely obvious borders (). Carex meadows experience two unique growing seasons, one in the spring and the other during the autumn after the summer floods recede. Carex cinerascens is the dominant species, with a coverage of over 95%, and is accompanied by a few species, including Potentilla limprichtii, Cardamine lyrata, Polygonum hydropiper, Polygonum japonicum, Panicum bisulcatum, Viola philippica and Paris polyphylla. Artemisia meadows are characterized by one growing season, and the dominant plant is Artemisia selengensis. Their coverage surpasses 95%, and accompanying species include Polygonum hydropiper and Carex cinerascens. Detailed information about the study area is provided in .
Figure 1. Vegetation medows showing by field photographs (a, b).

Table 1. Main characteristics of the sampling sites.
CH4 flux measurements
Three plots were established in each plant meadow to measure the CH4 flux. The interval between any two plots was more than 5 m and less than 10 m, depending on the distribution of the Carex cinerascens and Artemisia selengensis meadows in the study area. CH4 fluxes were measured approximately two or three times per month during the drawdown period from October 2014 to May 2015.
CH4 fluxes were measured by static dark chamber and gas chromatography methods (Wang and Wang Citation2003). The sample chambers were made of polyvinyl chloride (PVC) pipe with a top chamber and a base collar. One battery-driven (12 V) fan was fixed inside the upper chamber (0.5 m × 0.5 m × 0.5 m) to ensure good air mixing during the measurements. The base frame (0.5 m × 0.5 m × 0.2 m) had a gutter on the top rim that could be filled with water to make an airtight seal with the upper chamber. The base frames were driven 8-10 cm into the soil (depending on soil stability) two days prior to the flux measurements to maintain balance of the system, and they were permanently placed into the soil during the entire experiment. To minimize heating from solar radiation, white adiabatic aluminum foil was used to cover the entire aboveground portion of the chamber. Air in the chamber was sampled using a 60 ml syringe at 0, 10, 20 and 30 min. Gas sampling usually occurred between 9:00 and 11:00. The gas samples were stored in air sampling bags (multilayer polymer with aluminum foil, volume 0.1 L) and taken to the laboratory for CH4 concentration analysis using a gas chromatograph (GC; Agilent 4890 D, Agilent Co., Santa Clara, CA, USA) within 24 h. The chromatograph was equipped with a flame ionization detector (FID) operating at 200 °C. CH4 was separated with a 2 m stainless steel column (2 mm inner diameter) packed with 13 XMS (60/80 mesh, Sigma-Aldrich Co., St. Louis, MO, USA). The column temperature was maintained at 55 °C, and the carrier gas was N2 with a flow rate of 30 ml min−1. The calculations for CH4 emissions were based on the slope of the linear increase in gas concentrations over time in the chamber during the sampling period. A negative flux value indicated CH4 uptake from the atmosphere, and a positive flux value indicated CH4 emissions to the atmosphere (Song et al. Citation2008).
We calculated the methane flux using the following equation:
(1)
(1)
where F is CH4 emissions (mg CH4 m−2 h−1); dc/dt is the slope of gas concentration change with time; M is the molar mass of CH4; P is the atmospheric pressure in sampling site; T is the absolute temperature during sampling; H is the height of chamber over the water surface; and V0, P0, and T0 are gas mole volume, atmospheric pressure and air absolute temperate under standard conditions.
Environmental factors
The soil surface temperature and soil temperature at 5 cm depth were measured by a thermometer (JM624 digital thermometer, Jin Ming Instruments, China) during gas sampling. Air temperature outside the chambers was provided by a meteorological station located at the laboratory of Poyang Lake and Wetland Ecosystem Research, Chinese Academy of Sciences. Soil moisture at a depth of 10 cm was recorded using a time domain reflectometer (JS-TDR300, Meridian Measurement, USA). Water level data for the sampling dates were obtained from the website (http://www.jxsl.gov.cn).
The aboveground biomass was measured by harvesting plants from three randomly selected 1 m × 1 m quadrats each month during the drawdown period. The first plant biomass surveys in autumn in the Carex and Artemisia meadows were conducted 10 days after the drawdown area emerged, and biomass measurements in spring for Carex meadows were conducted in early February. Belowground biomass was excavated to a 40 cm depth from three 1 m × 1 m quadrats, which were the same as the aboveground biomass measurement quadrats. All plant samples were measured after drying at 85 °C for 48 h to a constant weight. Plant density, canopy height and root length in the quadrats were also recorded.
Soil samples were randomly collected at a depth of 10 cm from each of the plots in November 2014. Soil samples were sieved (< 2 mm) to remove any visible plant crowns, stones, and fine roots. Samples were air dried and analyzed for TP by a UV-1601 spectrophotometer following H2SO4-HClO4 digestion (Lu Citation1999). Soil organic carbon (SOC) and total nitrogen (TN) were analyzed by combustion with an elemental analyzer (Model CNS, Elementar Analysen Systeme GmbH, Germany). Soil pH was determined in a 1:2.5 soil-water suspension using a glass electrode. Soil samples for the analysis of soil bulk density were extracted via a steel cylinder with a volume of 100 cm3 (5 cm in diameter, 5 cm in height).
Statistical analysis
The flux data and environmental variables were tested for normality by the Kolmogorov-Smirnov test. We found that the CH4 flux data did not have a normal distribution. Therefore, all the CH4 flux data were normalized using a natural logarithm transformation. The mean CH4 emissions, surface and soil temperatures, soil moisture, and aboveground and belowground biomass for each vegetation type were calculated by averaging the three replicates from each sampling date. We used the nonparametric Mann-Whitney U test to test for differences in CH4 fluxes between different plant meadows. We used Pearson correlation analysis to analyze the relationships between CH4 emissions and environmental variables. Additionally, Pearson correlations were used to examine the autocorrelations between the different environmental variables. We used principal component analysis (PCA) to identify the mutual relationships among different variables. Furthermore, stepwise multiple linear regression analysis was used to examine the associations between CH4 emissions and the principal components. All analyses were conducted using Sigma Plot 11.0 (Systat Software, Inc., San Jose, CA, USA).
Results
Spatial and temporal variations of CH4 emissions
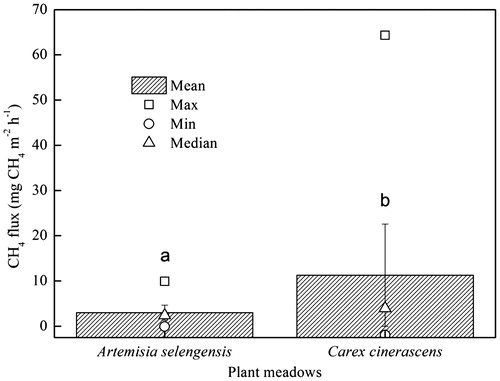
Spatial variation in CH4 emissions was found between the two different meadow types in the littoral zone of Poyang Lake (). CH4 emissions were highest from the Carex meadows (11.27 ± 11.29 mg CH4 m−2 h−1) and lowest from the Artemisia meadows (2.99 ± 1.67 mg CH4 m−2 h−1). Emissions from the Artemisia meadows were significantly lower than those from the Carex meadows (p < 0.05).
Figure 2. Methane emissions from different plant meadows from October 2014 to May 2015. The different letters above the boxes indicate significant differences in CH4 emissions between meadows (nonparametric test followed by Mann–Whitney U test, p < 0.05, n = 45).
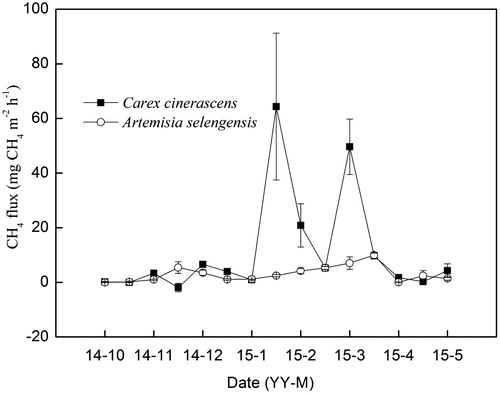
CH4 emissions in the Artemisia and Carex meadows showed similar temporal variations. The maximum CH4 fluxes occurred at the peak of the growing season, and the minimum fluxes were recorded after the summer flooding when plants began to germinate. CH4 influxes were observed in October and November 2014 for the Artemisia and Carex meadows, respectively. Two extreme CH4 emission events were observed for the Carex meadows, with fluxes of 64.34 and 49.63 mg CH4 m−2 h−1 in January and March 2015, respectively ().
Figure 3. Temporal variation in CH4 fluxes from October 2014 to May 2015. The error bars show standard error based on three replicates.
Relationships between CH4 emissions and key factors
The ln(CH4, flux) values from the two littoral vegetation meadows were plotted against environmental variables (). Significant positive relationships were observed between the CH4 fluxes and belowground biomass and total biomass. Because of the mutual correlations among these environmental variables, PCA was used to identify the relationships among these environmental factors in the littoral zone. The principal component analysis of physical variables resulted in two components with eigenvalues larger than 1. The two components explained 76% of the total variance. Furthermore, the first component explained approximately 51% of the variance, and several variables (soil temperature at 5 cm, air temperature, water level and ground surface temperature) were significantly positively correlated with the first component. The second component explained approximately 25% of the observed variance. Belowground biomass and total biomass were found to be significantly positively correlated with the second component, which could be influenced by biomass ().
Figure 4. Relationships between methane emissions and biomass (a, b) in the littoral zone.
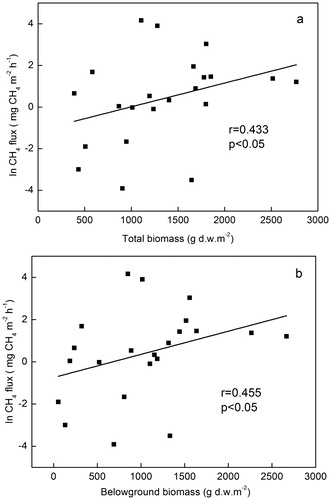
Table 2. Results of the principal component analysis (PCA) of physical variables in the littoral zone of Poyang Lake.
The stepwise multiple linear regression analysis between the PCA components and CH4 emissions in the littoral zone indicated that the second component had a significant influence (r2 = 0.3091, p < 0.05) and could be described as ln(CH4, flux) = −0.0417 + 0.7936 × component 2.
Discussion
Spatial and temporal variations in CH4 emissions from the Littoral zone
The mean CH4 emission rate from the littoral zone of Poyang Lake was 7.13 ± 8.29 mg CH4 m−2 h−1 (ranging from −1.93 to 64.34 mg CH4 m−2 h−1) during the drawdown period. This rate was much higher than the rates in the Nanji Wetlands (Southern Poyang Lake) during the drying period, Bang Lake, the pelagic zone of Poyang Lake and many boreal lakes (), comparable to the rate in the Nanji Wetlands during the drying-wetting period, and lower than the rates from rice paddy fields (ranging from 10.88 to 53.01 mg CH4 m−2 h−1) in the same region (Cai et al. Citation2000). On the basis of a four-year study of CH4 emissions from the surface of Poyang Lake (Liu et al. Citation2017), we determined that the CH4 emissions from the water surface of Poyang Lake were 0.36 mg CH4 m−2 h−1. Based on the surface area (3618 km2) (Tang et al. Citation2016), we further calculated the total CH4 emissions from the surface as 1.3 Mg CH4 h−1. With a mean CH4 emission value of 7.13 ± 8.29 mg CH4 m−2 h−1 from the littoral zone of Poyang Lake (715 km2 in area) (Tang et al. Citation2016), the total CH4 emissions from the littoral zone of Poyang Lake could be estimated to be approximately 5.1 Mg CH4 h−1, nearly four times the value of the surface. Considering that it represents only approximately 20% of the surface area, the littoral zone of Poyang Lake could be a ‘hotspot’ of CH4 emissions, which is a finding consistent with other reports (Chen et al. Citation2009, Citation2013).
Table 3. Comparison among previously reported CH4 emissions from the littoral and pelagic zones.
Our study showed positive correlations between CH4 emissions and total plant biomass and belowground biomass (), but there was no significant relationship with aboveground biomass. This finding suggests that plant roots primarily contributed to the CH4 emissions of the littoral zone during drawdown periods, and a similar result was reported by Hu et al. (Citation2015b). Plant biomass affects CH4 emissions, as organic material from plant roots via root decay and root exudation may serve as a substrate for methanogens. Additionally, plant species with aerenchyma may directly transport CH4 from the anaerobic zone of the soil to the atmosphere (Schimel Citation1995). The higher belowground biomass in the Carex meadows than in the Artemisia meadows explained the difference in the CH4 fluxes in the littoral zone of Poyang Lake (, ).
In our study, the beginning of the growing season showed comparatively low CH4 emissions, while peak emission rates appeared in the peak growing season. This temporal pattern of CH4 emissions was consistent with that in other studies (Alm et al. Citation1999; Kankaala et al. Citation2004; Chen et al. Citation2008). The reason for this pattern may be that plant biomass controls the temporal variations in methane emissions. Two extreme CH4 emission events were observed in the Carex meadows during the drawdown period in our study. In Poyang Lake, there was no obvious standing water on the soil surface of the littoral zone, there was relatively low soil moisture during the drawdown period, and drying is known to cause the episodic release of entrapped CH4 due to changes in soil structure (Windsor et al. Citation1992; Denier van der Gon et al. Citation1996). This flush of CH4 may have contributed to the observed peak in CH4 flux during the drawdown period in our study. Similarly, Hu et al. (Citation2015b) observed extreme CH4 emission events for a Carex meadow in Poyang Lake during the soil drying-wetting transition periods, and the ecosystem CH4 emission rate for drying-wetting periods was approximately 228 times that for the drying transition periods. However, we did not detect this change in our study. CH4 fluxes differed considerably even within a short (1-50 m) distance in the littoral wetlands (Juutinen et al. Citation2001; Kaki et al. Citation2001). This large spatial variation suggests that a fine-scale investigation should be performed. The shorelines of the lake are not regular, and the sediment quality and density, biomass and species composition of the littoral vegetation vary with short distances, thus impacting the spatial variation in CH4 fluxes (Kankaala et al. Citation2003). Moreover, Poyang Lake has been characterized by dramatic annual and interannual water level fluctuation, and hydrology is a major variable controlling many complicated biogeochemical processes in wetlands. Dramatic changes in hydrological conditions should result in considerable differences in processes such as greenhouse gas fluxes (Altor and Mitsch Citation2008). Therefore, long-term multisite methane flux monitoring studies are urgently needed to more reliably estimate the methane flux from the littoral zone of Poyang Lake.
Implications for large-scale hydraulic engineering
In this study, we made a preliminary estimation that the CH4 emissions from the littoral zone (covering only 20% of the surface area) were approximately four times the total CH4 emissions of the surface of Poyang Lake. Therefore, the littoral zone could be an important source of CH4. In recent years, changing climate conditions and operation of the Three Gorges Dam have dramatically altered Poyang Lake’s hydrological regime, particularly by reducing the water level during the drawdown period (Zhang et al. Citation2012a). In addition, hydrarch succession in Poyang Lake wetlands may expand wetland vegetation communities in the littoral zone (Zhang et al. Citation2012b). In our study, the littoral zone showed high emission rates of CH4 from the soil (7.13 mg CH4 m−2 h−1), and the pelagic zone emitted 0.36 mg CH4 m−2 h−1. Therefore, variability in vegetation zones as a result of a rapid decrease in water level during the drawdown period might increase the CH4 flux from the Poyang Lake wetland in the future.
The construction of a dam at the outlet of Poyang Lake has been proposed for maintaining the lake water level by controlling the flow between Poyang Lake and the Yangtze River and partially resolving the seasonal dryness of the lake. Scientists have argued that this project will fundamentally change the ecosystem of Poyang Lake (Li 2009). However, the vast littoral zone of the lake will be submerged once hydraulic engineering is implemented, and methane emissions from the littoral zone will decrease significantly when the lake water level is high enough to submerge the structures of the plants involved in gas exchange (Juutinen et al. Citation2003). Considering that the littoral zone is a ‘hotspot’ of CH4 emissions in Poyang Lake, the proposed dam might help reduce methane emissions from Poyang Lake. To precisely predict this scenario, long-term studies of CH4 fluxes in the littoral zone, vegetation changes with climate change and the effects of hydraulic engineering projects are needed. In addition, we should pay more attention to lakes such as Poyang Lake that have distinct hydrological variations because climate change and proposed hydraulic projects could influence regional greenhouse gas emissions.
Our results showed that greater spatial variation in methane emissions existed in the littoral zone of Poyang Lake during the dry season, with the lowest emissions (2.99 ± 1.67 mg CH4 m−2 h−1) in the Artemisia selengensis meadow and the greatest (11.27 ± 11.29 mg CH4 m−2 h−1) in the Carex cinerascens meadow. In addition, spatial variation in CH4 emissions must be considered when estimating regional CH4 emissions from Poyang Lake. The littoral meadow showed distinct seasonal variation in CH4 emissions; the fluxes reached a maximum at the peak of the growing seasons, and the minimum occurred after the summer flood, when plants began to germinate. Belowground biomass controlled the spatial and seasonal variations in CH4 emissions. Climate change and hydraulic engineering projects might significantly influence CH4 emissions from Poyang Lake. We noted that adequate sampling for methane fluxes is difficult to perform and has an important influence for adequate evaluation of methane emissions. Future efforts are needed to fully understand the spatial variation in CH4 emissions and long-term temporal changes.
Notes on contributors
Sheng Liu, Yuwei Chen, Jinfu Liu are research field is wetland ecology, and they are from the Poyang Lake Laboratory for Wetland Ecosystem Research CAS.
Acknowledgments
We are grateful to all staff members from the Poyang Lake Laboratory for Wetland Ecosystem Research (PLWER) program who collected and processed samples for monitoring.
Disclosure statement
No potential conflict of interest was reported by the authors.
Funding
This work was supported by the National Basic Research Program under Grant (2012CB417000) and the National Natural Science Foundation of China under Grants (41671096, 41501100).
References
- Alm J, Saarnio S, Nykänen H, Silvola J, Martikainen PJ. 1999. Winter CO2, CH4 and N2O fluxes on some natural and drained boreal peatlands. Biogeochemistry. 44: 163–196.
- Altor AE, Mitsch WJ. 2008. Pulsing hydrology, methane emissions and carbon dioxide fluxes in created marshes: a 2-year ecosystem study. Wetlands. 28(2):423–438.
- Bastviken D, Cole J, Pace M, Tranvik L. 2004. Methane emissions from lakes: dependence of lake characteristics, two regional assessments, and a global estimate. Global Biogeochem Cycles. 18:GB4009.
- Cai ZC, Tsuruta H, Minami K. 2000. Methane emission from rice fields in China: Measurements and influencing factors. J Geophys Res. 105(D13):17231–17242.
- Chen H, Wu YY, Yuan XZ, Gao YH, Wu N, Zhu D. 2009. Methane emissions from newly created marshes in the drawdown area of the Three Gorges Reservoir. J Geophys Res. 114:D18301.
- Chen H, Yao SP, Wu N, Wang YF, Luo P, Tian JP, Gao YH, Sun G. 2008. Determinants influencing seasonal variations of methane emissions from alpine wetlands in Zoige Plateau and their implications. J Geophys Res. 113:D12303.
- Chen H, Zhu Q, Peng C, Wu N, Wang Y, Fang X, Jiang H, Xiang W, Chang J, Deng X, et al. 2013. Methane emissions from rice paddies natural wetlands, lakes in China: synthesis new estimate. Glob Change Biol. 19(1):19–32.
- Denier van der Gon HAC, van Breemen N, Neue HU, Lantin RS, Aduna JB, Alberto MCR, Wassmann R. 1996. Release of entrapped methane from wetland rice fields upon soil drying. Global Biogeochem Cycles. 10(1):1–7.
- Hu QW, Wu Q, Yao B, Xu XL. 2015. Ecosystem respiration and its components from a Carex meadow of Poyang Lake during the drawdown period. Atmos Environ. 100:124–132.
- Hu QW, Cai JY, Yao B, Wu Q, Wang YQ, Xu XL. 2015b. Plant-mediated methane and nitrous oxide fluxes from a Carex meadow in Poyang Lake during drawdown periods. Plant Soil. 400(1–2):367–380.
- Hu ZP, Ge G, Liu C, Chen FS, Li S. 2010. Structure of Poyang Lake wetland plants ecosystem and influence of lake water level for the structure. Resour Environ Yangtze Basin. 19(6):597–605. (in Chinese).
- Huttunen JT, Väisänen TS, Hellsten SK, Heikkinen M, Nykänen H, Jungner H, Niskanen A, Virtanen MO, Lindqvist OV, Nenonen OS, et al. 2002. Fluxes of CH4, CO2, and N2O in hydroelectric reservoirs Lokka and Porttipahta in the northern boreal zone in Finland. Global Biogeochem Cycles. 16(1):1003.
- IPCC. 2013. Climate Change 2013: The Physical Science Basis. In: Stocker TF Qin D, Plattner GK, Tignor M, Allen SK, Boschung J, Nauels A, Xia Y, Bex V, Midgley PM, editors. Contribution of Working Group I to the Fifth Assessment Report of the Intergovernmental Panel on Climate Change. Cambridge: Cambridge University Press.
- Juutinen S, Alm J, Larmola T, Huttunen JT, Morero M, Saarnio S, Martikainen PJ, Silvola J. 2003. Methane (CH4) release from littoral wetlands of boreal lakes during an extended flooding period. Global Change Biol. 9(3):413–424.
- Juutinen S, Alm J, Martikainen P, Silvola J. 2001. Effects of spring flood and water level drawdown on methane dynamics in the littoral zone of boreal lakes. Freshwater Biol. 46:855–869.
- Kankaala P, Käki T, Mäkelä S, Ojala A, Pajunen H, Arvola L. 2005. Methane efflux in relation to plant biomass and sediment characteristics in stands of three common emergent macrophytes in boreal mesoeutrophic lakes. Global Change Biol. 11(1):145–153.
- Kankaala P, Mäkelä S, Bergström I, Huitu EK, Käki T, Ojala A, Rantakari M, Kortelainen P, Arvola L. 2003. Midsummer spatial variation in methane efflux from stands of littoral vegetation in a boreal meso-eutrophic lake. Freshwater Biol. 48(9):1617–1629.
- Kankaala P, Ojala A, Käki T. 2004. Temporal and spatial variation in methane emissions from a flooded transgression shore of a boreal lake. Biogeochemistry. 68(3):297–311.
- Khalil MAK, Shearer MJ. 1993. Sources of methane: an overview. In: Mak K, editor. Atmospheric Methane: sources, sinks, and role in global change. Berlin: Springer Verlag; p. 180–198.
- Kaki T, Ojala A, Kankaala P. 2001. Diel variation in methane emissions from stands of Phragmites australis (Cav.) Trin. ex Steud. and Typha latifolia L. in a boreal lake. Aquat Bot. 71(4):259–271.
- Li J. 2009. Scientists line up against dam that would alter protected wetlands. Science. 326:508–509.
- Liu LX, Xu M, Lin M, Zhang X. 2013. Spatial variability of greenhouse gas effluxes and their controlling factors in the Poyang Lake in China. Pol J Environ Stud. 22: 749–758.
- Liu LX, Xu M, Shao R. 2017. Timescale dependence of environmental controls on methane efflux in Poyang Lake, China. Biogeosciences. 14(8):2019–2032.
- Liu XZ, Fan SB, Hu BH. 2006. Comprehensive and Scientific Survey of Jiangxi Nanjishan Wetland Nature Reserve. Beijing: Chinese Forestry Press. (in Chinese)
- Lu RK. 1999. Analytical methods of soil agrochemistry. Beijing: Chinese Agriculture Science and Technology Press.
- Nykänen H, Alm J, Silvola J, Tolonen K, Martikainen P. 1998. Methane fluxes on boreal peatlands of different fertility and the effect of long-term experimental lowering of the water table on flux rates. Global Biogeochem Cycles. 12(1):53–69.
- Rasilo T, Prairie YT, Del Giorgio PA. 2015. Large-scale patterns in summer diffusive CH4 fluxes across boreal lakes, and contribution to diffusive C emissions. Global Change Biol. 211124–1139.
- Song CC, Zhang JB, Wang YY, Wang YS, Zhao ZC. 2008. Emission of CO2, CH4 and N2O from freshwater marsh in northeastern of China. J Environ Manage. 88428–436.
- Schimel JP. 1995. Plant transport and methane production as controls on methane flux from arctic wet meadow tundra. Biogeochemistry. 28(3):183–200.
- Tang ZQ, Zhang Q, Li MF, Li YL, Xu XL, Jiang JH. 2016. A study of the relationship between wetland vegetation communities and water regimes using a combined remote sensing and hydraulic modeling approach. Hydrol Res. 47(S1):278–292.
- Walter KM, Smith LC, Chapin FS. 2007. Methane bubbling from northern lakes: present and future contributions to the global methane budget. Philos Trans A Maths Phys Eng Sci. 365(1856):1657–1676.
- Wan HX, Qin ZH, Liu YB, Xu YM. 2010. Estimates of carbon fluxes from Poyang Lake wetlands vegetation in the growing season. In: Frouin RJ, Yoo HR, Won J-S, Feng A, editors. Remote sensing of the coastal ocean, land, and atmosphere environment. Proceeding of SPIE Vol.7858; November 4; New York: SPIE.
- Wang HJ, Lu JW, Wang WD, Yang LY, Yin CQ. 2006. Methane fluxes from the littoral zone of hypereutrophic Taihu Lake, China. J Geophys Res. 111:D17109.
- Wang YS, Wang YH. 2003. Quick measurement of CH4, CO2 and N2O emissions from short-plant ecosystems. Adv Atmos Sci. 20:842–844.
- Windsor J, Moore TR, Roulet NT. 1992. Episodic fluxes on methane from subarctic fens. Can J Soil Sci. 72(4):441–452.
- Yang XK, Lu XX. 2014. Drastic change in China's lakes and reservoirs over the past decades. Sci Rep. 4:6041.
- Zhang LL, Yin JX, Jiang YZ, Wang H. 2012. Relationship between the hydrological conditions and the distribution of vegetation communities within the Poyang Lake National Nature Reserve, China. Ecol Inform. 11:65–75.
- Zhang Q, Li L, Wang YG, Werner AD, Xin P, Jiang T, Barry DA. 2012a. Has the three-gorges dam made the Poyang lake wetlands wetter and drier? Geophys Res Lett. 39(20):L20402.
- Zhang Q, Ye XC, Werner AD, Li YL, Yao J, Li XH, Xu CY. 2014. An investigation of enhanced recessions in Poyang Lake: comparison of Yangtze River and local catchment impacts. J Hydrol. 517:425–434.
- Zhu RB, Liu YS, Xu H, Huang T, Sun JJ, Ma ED, Sun LG. 2010. Carbon dioxide and methane fluxes in the littoral zones of two lakes, east Antarctica. Atmos Environ. 44(3):304–311.