
 ?Mathematical formulae have been encoded as MathML and are displayed in this HTML version using MathJax in order to improve their display. Uncheck the box to turn MathJax off. This feature requires Javascript. Click on a formula to zoom.
Abstract
Per-recruit analyses, with consideration for uncertainty in growth, natural mortality and maturity, were conducted for European bream Abramis brama in the downstream section of the Irtysh River in China to assess its status. The Chapman-Robson method produced an estimate of total mortality rate (Z) of 0.65 year−1. The natural mortality rates (M) were estimated as 0.13 and 0.26 year−1, resulting in corresponding estimates of current fishing mortality rate (Fcur) of 0.52 and 0.39 year−1, respectively. All the estimates of yield per recruit (YPR), spawning stock biomass per recruit (SSB/R) and corresponding biological reference points (BRPs) were sensitive to M. The uncertainty of growth and maturity parameters had limited impacts on the estimates of BRPs, but had a large effect on the YPR and SSB/R outputs. Our findings indicate that A. brama may be at higher risk of growth overfishing than those of recruitment overfishing. In addition, increasing the tc to nine years might ensure that the spawning potential ratios (SPRs) are above the management targets under all ranges of F with comparatively small impacts on YPR regardless of M. In addition to providing a basic assessment for A. brama in the downstream of the Irtysh River in China, our study presents a comprehensive approach that may be useful for data-limited species in other fisheries.
Introduction
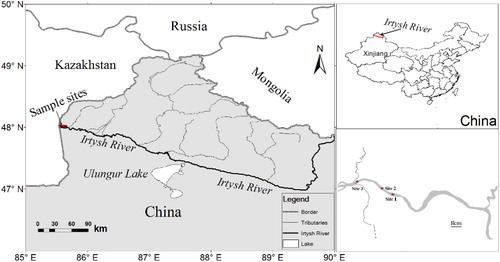
The Irtysh River originates on the southwestern slope of the Altai Mountains, flowing through Lake Zaysan (Kazakhstan), meeting the Ishim and Tobol rivers before merging with the Ob River (Russia) and terminating at the Arctic Ocean (Zhang et al. Citation2016). The river spans a total of 4,248 km, of which 633 km are in China. The drainage area of the Irtysh River within China is 57,000 km2, with a mean annual runoff of 119 × 109 m3. It remains the second longest river in Xinjiang (Xinjiang Geographic Society Citation1983). The climate in Xinjiang is cold temperate continental and arid. In comparison with coastal areas of the same latitude, the region has less rain, drier air, longer winters and shorter summers. The rich flora on the banks of the Irtysh River tend to be flooded by rising waters during the flood season each year (Zhang et al. Citation2016).
The European bream (Abramis brama) is a freshwater fish species in the family Cyprinidae, and it is now considered to be the only species in the genus Abramis. A. brama originated in Europe north of the Alps and Pyrenees, as well as the Balkans. It was introduced in Lake Balkhash of Central Asia from the Ob River basin in 1949, gradually spread into Xinjiang along the Irtysh River in 1963, and became one of the most important commercial and recreational fish of this area (Adakbek et al. Citation2003). Every spring, a large number of A. brama cluster are formed in the downstream section of the Irtysh River in China for breeding; this cluster is readily available to commercial and recreational fishermen. Recent studies indicate that this species is in decline and has been classified as a near threatened fish on the IUCN Red List of Threatened Species (Freyhof and Kottelat Citation2008). Hence, close attention should be paid to the conservation status of natural populations of A. brama.
The biology of A. brama has been extensively studied (e.g. Goldspink Citation1978; Kangur Citation1996; Treer et al. Citation2003; Zhang et al. Citation2016; Zhang et al. Citation2017). To date, no stock assessment has been conducted for A. brama in the Irtysh River nor in its European home range. The surplus production model is regarded as the most convenient and simplest method for the stock assessment of a species (Hilborn and Walters Citation1992). However, the requirement of long-term catch and relative abundance indices (such as catch per unit effort, CPUE) limits the use of this model to data-poor fisheries (Peixer et al. Citation2007). The yield per recruit (YPR) and spawning stock biomass per recruit (SSB/R) models offer a valuable alternative for determining the fishery status of a fish stock for which the growth and maturity parameters are available.
Several fishing mortality rate (F)-based biological reference points (BRPs) derived from per-recruit analysis have been used to evaluate whether the YPR is optimum or the SSB/R is sufficient for the population to persist. It also provides fisheries managers with the ability to develop harvest policies (Aprahamian et al. Citation2006; Lin et al. Citation2015; Huo et al. Citation2015). The BRPs usually appear in three forms: targets (target reference points, TRPs), thresholds (threshold reference points, ThRPs) and limits (limit reference points, LRPs). The TRPs are F values that enable fisheries to achieve their desirable states; the LRPs are the upper limits of F values; if exceeded, fisheries development would be slower or even stagnant, and management actions should be taken immediately. ThRPs are F values between the TRPs and LRPs and generally used to prevent recruitment overfishing (Williams and Shertzer Citation2003; Cooper Citation2006; Tong et al. Citation2010; Braccini et al. Citation2015). The combination of these three concepts enables managers to assess the states of fish stocks and fisheries, and to implement the corresponding management measures to ensure continuity in fisheries (Prager et al. Citation2003).
The BRPs often reflect the combination of several stock dynamics (such as growth, reproduction and mortality) as a single value, which is called a point estimate (Gabriel and Mace Citation1999). However, point estimates present only the most possible values, whereas a wide range of values and alternative models may exist. Ignoring uncertainties in biological parameters in per-recruit analysis may yield an incorrect estimation of BPRs, and consequently, the estimation of the fish stock status could be misleading (Chen and Wilson Citation2002; Lin et al. Citation2015). Caddy (Citation1993) suggested that the imprecision or uncertainty should be taken into consideration when a per-recruit analysis is developed.
The objectives of this study were to (1) estimate the mortality rates of A. brama, (2) evaluate the impacts of uncertainty in per-recruit analyses on the determination of the stock status of A. brama and (3) investigate the effectiveness of age at first capture (tc) for conservation of A. brama stock in the downstream of the Irtysh River in China.
Materials and methods
Sample collection
A total of 464 specimens were randomly selected from commercial fishing in the downstream section of the Irtysh River in China from April to October 2013 and April to May 2014 (). Fish were caught using trammel nets (inner mesh size 10 cm, outer 23 cm). For each sampled individual, the standard length (L) was measured to the nearest 1 mm and body weight (W) to the nearest 0.01 g. Specimens were macroscopically classified as male, female or unsexed. Lapillus otoliths were extracted from each fish for age analysis.
Figure 1. The sampling locations of A. brama in the downstream of the Irtysh River in China.
Estimation of mortality
The Chapman-Robson (CR) method was used to estimate the total mortality rate (Z) of A. brama and all ages after the age where the peak catch occurred were used (Chapman and Robson Citation1960).
Two empirical equations were applied to estimate the natural mortality rate (M), with the recommendation of Then et al. (Citation2015):
where the parameters of the von Bertalanffy growth function are as follows: K, the growth coefficient of 0.123 year−1, t0, the age at zero length of −0.205 year, and L∞, the asymptotic length of 348.6 cm (). In addition, tmax is the longevity of A. brama, which is estimated using the following formula (Taylor Citation1958):
Table 1. Models and parameters for which uncertainties were considered in the per-recruit analysis of A. brama in the downstream section of Irtysh River in China.
Fishing mortality rate (F) was calculated as F= Z – M. The estimates of M and F were assumed to be constant throughout the fish lifespan.
Per-recruit analysis
Based on the previous study, there was no significant difference between the growth and maturation of males and females, and the sex ratio (M/F) was 1.06:1, which showed no significant deviation from 1:1 (Zhang et al. Citation2017). Hence, yield per recruit (YPR) and spawning stock biomass per recruit (SSB/R) models were developed for the pooled data. The YPR and SSB/R were calculated using the following models (Huo et al. Citation2015):
where tλ is the maximum observed age; tr is the age at recruitment, which was the youngest age in the catch; tc is the age at first capture (tλ, tr and tc are obtained from age frequency distribution analysis); K is the growth coefficient; t0 is the hypothetical age at zero length; L∞ is the asymptotic length in the von Bertalanffy growth function; a and b are parameters in the weight–length relationship; Pt is the proportion of mature fish at age t; F and M refer to fishing and natural mortality rates, respectively (the parameters used in per-recruit analysis are given in ). SPR is the spawning potential ratio, defined as the ratio of spawner per recruit with a fishing mortality relative to spawners per recruit without fishing; St is the gear selectivity coefficient for fish of age t and is set to a ‘knife edge’ selectivity as follows:
Biological reference points
To determine the fishery status of A. brama stock in the downstream of the Irtysh River, the current fishing mortality (Fcur) was compared with four F-based BRPs: Fmax, where the fishing mortality rate produces the maximum YPR; F0.1, refers to fishing mortality where the slope of the YPR curve is 10% of the slope at the origin (Gulland and Boerema Citation1973); and F25% and F40%, are fishing mortality rates at which the SPR is respectively 25% and 40% (Goodyear Citation1993).
Sensitivity and management simulations
The sensitivity of the YPR and SSB/R computations to the variation of M were examined in consideration of the difficulty in obtaining reliable estimates of M for exploited fish populations (Sun et al. Citation2002; Huo et al. Citation2015). To evaluate the impact of uncertainty of growth and maturity parameters on per-recruit analysis, new parameters were randomly selected from a normal distribution defined by the mean and standard error for each parameter (Zischke and Griffiths Citation2015). The selected parameters included K, L∞ and t0 in the von Bertalanffy growth function (VBGF); a and b in the weight–length relationship and r and A50 in the logistic function of first maturity at age (). A total of 100 model iterations were conducted to investigate uncertainty in stock assessment outputs under the current harvesting scenario (Zischke and Griffiths Citation2015). Moreover, four different fishery management scenarios from current harvesting were simulated to evaluate the impact of tc on A. brama fishery. These four scenarios were 3, 5, 9 and 11 years at first capture, respectively. All potential management scenarios were explored with the iterative approach described previously.
Changing YPR and SPR were also investigated under various combinations of tc and F using isopleth plot (mean parameters were used), to obtain the best compromise between the conservation of A. brama stock and maximizing YPR and SPR (Huo et al. Citation2015).
Results
Mortality
The age frequency distribution of A. brama in the downstream of the Irtysh River in China is presented in . The Chapman-Robson method produced an estimate of Z of 0.65 year−1 (). Estimates of M obtained from the use of mean biological parameters in the two empirical equations were 0.13 and 0.26 year−1, and the corresponding estimates of Fcur were 0.52 and 0.39 year−1, respectively.
Figure 2. The estimation of total mortality (Z) from Chapman-Robson of A. brama in the downstream of the Irtysh River in China.
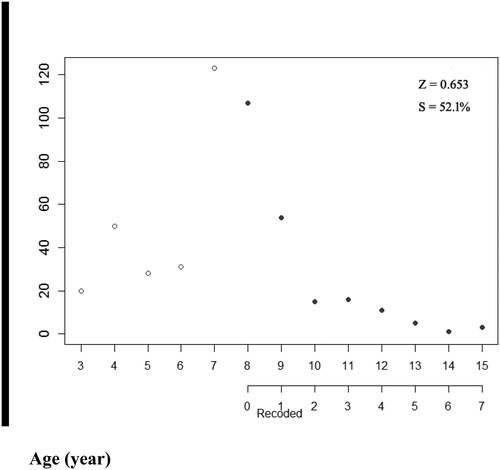
Table 2. The age frequency distribution of A. brama in the downstream section of the Irtysh River in China.
Sensitivity and management simulations
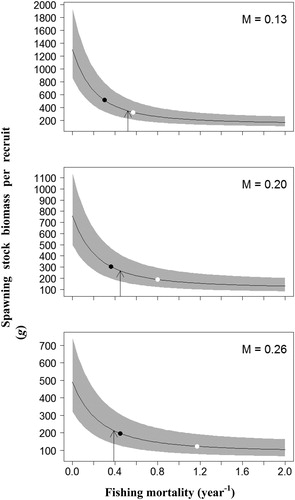
Per-recruit analysis was conducted at three alternative values of M (0.13, 0.20 and 0.26 year−1) within the estimated range. All the estimates of YPR, SSB/R and corresponding biological references points (BRPs) fluctuated widely with M (). Under the current harvesting scenario and the three corresponding M, the ranges of YPRcur and SSB/Rcur were 58.0–129.9 g and 212.5-346.2 g, respectively, and both the estimates significantly decreased with the increase of M. Nevertheless, an increased trend in the BPRs with the increase of M was observed. The estimates of F0.1 were 0.24–0.35 year−1, and Fmax was 0.48 year−1 with M of 0.13, and greater than 2 year−1 with M of 0.20 and 0.26; the ranges of F40% and F25% were 0.30–0.45 year−1 and 0.57–1.18 year−1, respectively.
Figure 3. Mean estimates (solid line) and 95% confidence intervals (gray shaded area) of yield per recruit (YPR). Arrows indicate current fishing mortality (Fcur). Black dots represent target reference points (F0.1). White dots represent target reference points (Fmax).
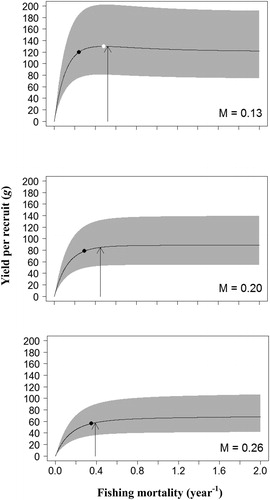
Figure 4. Mean estimates (solid line) and 95% confidence intervals (gray shaded area) of spawning stock biomass per recruit (SSB/R). Arrows indicate current fishing mortality (Fcur). Black dots represent target reference points (F40%). White dots represent target reference points (F25%).
The uncertainty of growth and maturity parameters had limited impact on the BRPs, but had significant effect on the YPR and SSB/R (, and ). Most of the BRPs fluctuated over a relatively small range, especially the BRPs for YPR model. The maximum fluctuation of BRPs for YPR analyses was in S2 with M of 0.26, the Fmax fluctuates within the range of 0.59 to 0.73 year−1, and BRPs for SSB/R in current harvesting scenario with M of 0.26, the F25% fluctuates within the range of 1.09 to 1.29 year−1. However, the estimates of YPRcur and SSB/Rcur fluctuated widely under all simulated scenarios, and the maximum fluctuation of YPRcur and SSB/Rcur was 32.2–129.7 g and 47.6–799.7 g, respectively.
Table 3. Estimates of YPR, SSB/R and corresponding biological reference points (BRPs) under different fishery management scenarios of A. brama in the downstream section of Irtysh River in China.
It is apparent that the tc could significantly influence the per-recruit analysis, and all estimates of YPR, SSB/R and BPRs increased with increasing tc under the scenarios simulated in this study () . For the current harvesting scenario, the Fcur was higher than all TRPs (F0.1 and F40%) at almost all levels of M, with the exception of F40% with M of 0.26, whereas the Fcur was lower than the F25% and Fmax under almost all levels of M, with the exception of Fcur slightly higher than Fmax with M of 0.13. For scenarios S1 and S2, the Fcur was higher than all BRPs at almost all levels of M, with the exception of Fmax in S2 with M of 0.26. In scenarios S3 and S4, the Fcur was lower than both the F25% and F40% under all levels of M; and the Fcur was lower than the Fmax under all levels of M, but larger than the F0.1 in S3 with M of 0.13 and 0.20, and in S4 with M of 0.13.
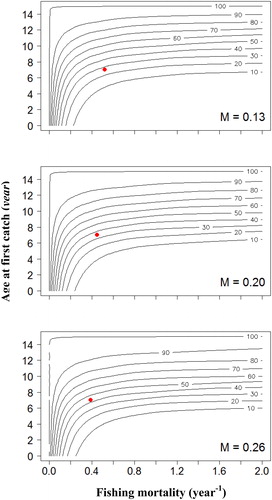
The response of YPR and SPR to varying tc and F under three corresponding levels of M is demonstrated in and . With increasing F within the low levels, YPR rapidly increased for most of the range of tc, and the SPR rapidly decreased for low values of tc. The YPR isopleths showed that, under the current F, increasing the tc to between 7 and 9 years would enable YPR to be at relatively high levels regardless of M. Maximum YPR could not be obtained by decreasing the tc to between 1 and 5 years, or increasing the tc to relatively high levels, even if F is increased to infinity (). Moreover, the SPR would be maintained above SPR40% under all ranges of F, when increasing the tc to nine years (). Hence, the tc to nine years might be able to ensure that the SPR remains above the management targets under all ranges of F with comparatively small impact on YPR regardless of M.
Figure 5. Isopleths describing the response of yield per recruit (YPR) to various fishing mortalities (F) and age at first capture (tc) for A. brama stock in the downstream section of Irtysh River in China. Red dots represent the current YPR.
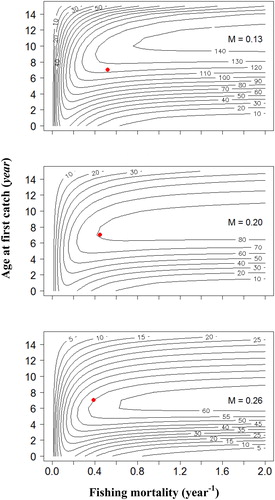
Figure 6. Isopleths describing the response of spawning potential ratio (SPR) to various fishing mortalities (F) and age at first capture (tc) for A. brama stock in the downstream section of Irtysh River in China. Red dots represent the current SPR.
Discussion
Natural mortality (M) is one of the most important parameters to understanding the population dynamics of a fish species. It directly influences the productivity of a stock and the optimum yield that can be obtained, and is generally believed to be exceptionally difficult to estimate reliably and directly (Kenchington Citation2014; Then et al. Citation2015). A number of studies suggested that M is strongly age and size dependent, and may differ significantly among subpopulations (e.g. Lorenzen Citation1996; Gislason et al. Citation2010; Kenchington Citation2014). Nevertheless, most fishery scientists would agree that an invariant M can be an effective representation of mortality across exploited age classes, as obtaining a single value with useful accuracy is challenging enough (Kenchington Citation2014). Among the M estimators, the direct methods such as mark and recapture, and following individuals through telemetry are considered to be more reliable, whereas these methods are often data intensive and expensive to implement, limiting their application only to those relatively data-rich stocks (Hoenig et al. Citation1998; Knip et al. Citation2012; Then et al. Citation2015). Although the indirect empirical methods are often regarded as being less reliable than those direct estimators, a consensus is that empirical estimators are useful and important, especially for data-limited populations (Brodziak et al. Citation2011). In this study, we used two empirical methods recommended by Then et al. (Citation2015), three possible values of M, believed to encompass the predicted range of target species, were used in per-recruit analysis.
The cross-sectional catch-curve analyses are one of the most commonly used methods for determining the total mortality rate (Z) from age-frequency distribution data of a fish population (Dunn et al. Citation2002). Among these methods, the Chapman and Robson (Citation1960) estimator and catch-curve regression are generally preferred over the other proposed methods (Ricker Citation1975), and the Chapman–Robson estimator using all ages after the age of maximum catch occurred was verified to be the most precise and least biased (Smith et al. Citation2012).
Per-recruit analysis is often used to yield fishing mortality-based biological refernece points and can be helpful when the historical fisheries data are unobtainable (Zischke and Griffiths Citation2015). In this study, we used per-recruit analysis to estimate a traditional target biological reference point F0.1 and a limit reference point Fmax to compare them with Fcur estimated from the catch-curve method. However, a YPR model only reflects schedules of growth and mortality, and both Fmax and F0.1 are BRPs in the context of growth overfishing (Gabriel and Mace Citation1999). Hence, BRPs based on YPR model may not be sufficient to ensure sustainability (Gabriel and Mace Citation1999). As an addition to the YPR analysis, the SSB/R analysis was conducted to estimate reference points (such as F40% and F25%) to compare them with the Fcur to evaluate whether recruitment overfishing may occur (Goodyear Citation1993).
The estimates of YPR, SSB/R and corresponding BRPs fluctuated widely with M, which indicated that the current stock status of A. brama in the downstream of the Irtysh River was sensitive to the levels of M. The sensitivity of per-recruit analysis to the level of M has been reported in a large number of documents (e.g. Sun et al. Citation2002; Huo et al. Citation2015). The situations where both the YPR and SSB/R decreased with increasing M, and the BRPs increased with increasing M might be attributed to higher M leaving fewer fish to be captured, reducing the yield and mitigating the impact of fishing on the survival of spawners (Sun et al. Citation2002).
BRPs such as F0.1, Fmax, F25% and F40% have been widely used in developing fisheries management policies. For YPR analysis, the F0.1 was recommended as TRP by many authors (e.g. Mace Citation1994; Gabriel and Mace Citation1999; Kirchner Citation2001; Zischke and Griffiths Citation2015), and the Fmax was a recognized limit reference point (LPR). Griffiths (Citation1997) and Huo et al. (Citation2015) used F25% as ThRP and F40% as TRPs for SSB/R analysis. Under the current harvesting scenario, our results based on per-recruit analyses suggested that the Fcur are higher than almost all TRPs (F0.1 and F40%) and lower than the F25% and Fmax at almost all levels of M. In addition, the recreational fishery was not considered in the calculation of F, indicating that the Fcur might be underestimated. Therefore, the A. brama population in the downstream of the Irtysh River might be under overfishing. The findings also indicate that, under the current harvesting scenario, A. brama may be at higher risk of growth overfishing than of recruitment overfishing, and this phenomenon may be attributed to their slow growth and high selectivity of juvenile fish by fisheries (Zhang et al. Citation2016; Zischke and Griffiths Citation2015).
To obtain relatively high yields and spawning stocks, the tc should be maintained within reasonable ranges, and these ranges should be determined according to the specific circumstance. The current tc of 7 years is approximately equal to the age at first sexual maturity (6.23 years, ), and this might lead to a risky recruitment stock. Our results indicated that increasing the tc to 9 years could ensure that the SPR is above the management targets under all ranges of F with comparatively small impact on YPR regardless of M. The enhancing of the tc to 9 years would not increase the YPR to any extent compared with the current YPR, but this measure allows more fish into the age classes which contribute to the spawning stock of this species (Kirchner et al. Citation2001).
In most fisheries, managers can adjust the level of fishing effort and age or size at first capture (adjust the mesh size in fishery) to achieve the optimum yield or spawning stock (Zhang and Campbell Citation2002). Although decreasing the fishing effort and increasing the age or size at first capture could be effective measures to conserve the A. brama stock in the downstream region of the Irtysh River, increasing age at first capture is preferred. Compared with decreasing the fishing effort, increasing the age or size at first capture may be more efficient and easier to implement, in consideration of the local economic and social conditions. Fishing and grazing are the main sources of income for people who live in this region, and the economy and education in these remote areas are still relatively backward, making it difficult to let them reduce the fishing effort consciously.
Conclusions
We collated biological and fishery information for A. brama and provided the first quantitative evaluation of the status of fishery of this species. Our findings indicate that A. brama may be at higher risk of growth overfishing than that of recruitment overfishing. Although decreasing both the fishing effort and increasing the age at first capture could be effective measures to conserve the A. brama stock in the downstream region of the Irtysh River, we suggest increasing the minimum age limits (increasing mesh sizes of fishing nets) for A. brama fishery. Moreover, the fishery should be re-assessed periodically, because its dynamics (e.g. biological characteristic, fishing effort, catch or management measures) might be changing with time. In addition to providing a basic assessment for A. brama in the downstream region of the Irtysh River in China, our study provides an approach that may be useful for data-limited species in other fisheries.
Notes on contributors
Huiping Ding is formerly a master student at Huazhong Agricultural University, but now a PhD student at Nanjing Institute of Geography & Limnology, Chinese Academy of Sciences with research interests in biological invasion, molecular genetics and fish ecology.
Zhiming Zhang is formerly a PhD student at Huazhong Agricultural University, but now a research assistant at Institute of Hydroecology, MWR & CAS with research interests in fish ecology, fisheries population dynamics and fisheries stock assessment.
Congxin Xie is a professor at College of Fisheries, Huazhong Agricultural University with research interests in freshwater fisheries resource science, fish resource survey and assessment, and fish ecology.
Chengjie Liu is formerly a master student at Huazhong Agricultural University with research interests in fish ecology.
Feng Chen is an associate fellow at Institute of Hydroecology, MWR & CAS with research interests in fish ecology, and biological invasion.
Daoming Huang is a research fellow at Institute of Hydroecology, MWR & CAS with research interests in freshwater aquatic ecosystems, and environmental impact assessment.
Zengguang Li is formerly a PhD student at College of Fisheries, Ocean University of China with research interests in fisheries population dynamics, and fisheries stock assessment.
Yan Guo is a research fellow at Institute of Fisheries Research of Xinjiang Uygur Autonomous Region with research interests in fish resource survey and assessment and fish ecology.
Yong Chen is a professor at School of Marine Sciences, University of Maine, Orono, USA, with research interests in fish ecology, fisheries population dynamics and fisheries stock assessment.
Acknowledgments
The authors gratefully acknowledge financial support from China Scholarship Council. The authors would like to thank Feng Wang and Peng Xie for help in sample collection. The authors also thank Kisei Tanaka for his constructive review of the manuscript. This experiment complies with the current laws of the country in which they were performed.
Disclosure statement
No potential conflict of interest was reported by the authors.
Funding
This research was financially supported by National Science Foundation for Young Scientists of China (No. 31800391), and Special Funds for the Foundation Work of Science and Technology (No. 2012FY112700).
References
- Adakbek KJ, Liu J, Chen QY. 2003. Study on the biology and exploitation of Abramis brama Berg in the Ulungur Lake. Shanghai, China: J Shanghai Fish Univ; p. 366–370.
- Chapman DG, Robson DS. 1960. The analysis of a catch curve. Biometrics. 16(3):354–368.
- Xinjiang Geographic Society. 1983. Xinjiang Geography Manual. Urumqi: Xinjiang People Press; p. 90–98.
- Gulland JA, Boerema LK. 1973. Scientific advice on catch levels. Fish Bull. 71:325–335.
- Prager MH, Porch CE, Shertzer KW, Caddy JF. 2003. Targets and limits for management of fisheries: a simple probability-based approach. N Am J Fish Manage. 23(2):349–361.
- Tong YH, Chen XJ, Tian SQ, Zhang YY, Chen Y. 2010. Therory and application of biological reference points in fisheries management. J Fish Chin. 34:1040–1050.
- Aprahamian MW, Wyatt RJ, Shields BA. 2006. Use of biological reference points for the conservation of Atlantic salmon, Salmon salar, in the River Lune, North West England. Fisheries Manage. 13(1):21–30.
- Braccini M, Brooks EN, Wise B, McAuley R. 2015. Displaying uncertainty in the biological reference points of sharks. Ocean Coast Manage. 116:143–149.
- Brodziak J, Ianelli J, Lorenzen K, Methot RD. Jr 2011. Estimating natural mortality in stock assessment applications. U.S. Dep. Commer., NOAA Tech. Memo. NMFS–F/SPO. 119:38p.
- Caddy JF. 1993. Background concepts for a rotating harvesting strategy with particular to the Mediterranean red coral. Corallium Rubrum. Mar Fish Rev. 55:10–18.
- Chen Y, Wilson C. 2002. A simulation study to evaluate impacts of uncertainty on the assessment of American lobster fishery in the Gulf of Maine. Can J Fish Aquat Sci. 59(8):1394–1403.
- Cooper AB. 2006. A guide to fisheries stock assessment: from data to recommendations. University of New Hampshire, NH Sea Grant College Program, p 44.
- Dunn A, Francis RICC, Doonan IJ. 2002. Comparison of the Chapman-Robson and regression estimators of Z from catch-curve data when non-sampling stochastic error is present. Fish Res. 59(1–2):149–159.
- Freyhof J, Kottelat M. 2008. Abramis brama. IUCN Red List of Threatened Species.
- Gabriel WL, Mace PM. 1999. A review of biological reference points in the context of the precautionary approach. 5th NMFS NSAW. NOAA Tech. Memo. NMFS–F/SPO–40.
- Gislason H, Daan N, Rice JC, Pope JG. 2010. Size, growth, temperature and the natural mortality of marine fish. Fish Fish. 11(2):149–158.
- Goldspink CR. 1978. The population density, growth rate and production of bream, Abramis brama, in Tjeukemeer, the Netherlands. J Fish Biol. 13(4):499–517.
- Goodyear CP. 1993. Spawning stock biomass per recruit in fisheries management: foundation and current use. Can Spec Pub Fish Aquat Sci. 120:67–82.
- Griffiths MH. 1997. The application of per-recruit models to Argyrosomus inodorus, an important South African sciaenid fish. Fish Res. 30(1–2):103–115.
- Hilborn R, Walters CJ. 1992. Quantitative fisheries stock assessment. Choice, dynamics, and uncertainty. Chaman and Hall, New York.
- Hoenig JM, Barrowman NJ, Hearn WS, Pollock KH. 1998. Multiyear tagging studies incorporating fishing effort data. Can J Fish Aquat Sci. 55(6):1466–1476.
- Huo B, Ma BS, Xie CX, Duan YJ, Yang XF, Huang HP. 2015. Stock assessment and management implications of an endemic fish, Oxygymnocypris stewartii in the Yarlung Zangbo River in Tibet, China. Zool Stud. 54:1–15.
- Kangur P. 1996. On the biology of bream, Abramis brama (L.) in Lake Peipsi in 1994. Hydrobiologia. 338(1–3):173–177.
- Kenchington TJ. 2014. Natural mortality estimators for information-limited fisheries. Fish Fish. 15(4):533–562.
- Kirchner CH, Holtzhausen JA, Voges SF. 2001. Introducing size limits as a management tool for the recreational line fishery of silver kob, Argyrosomus inodorus (Griffiths and Heemstra), in Namibian waters. Fisheries Manage. 8(3):227–237.
- Kirchner CH. 2001. Fisheries regulations based on yield-per-recruit analysis for the linefish silver kob Argyrosomus inodorus in Namibian waters. Fish Res. 52(3):155–167.
- Knip D, Heupel M, Simpfendorfer C. 2012. Mortality rates for two shark species occupying a shared coastal environment. Fish Res. 125–126:184–189.
- Lin YJ, Sun CL, Chang YJ, Tzeng WN. 2015. Sensitivity of yield-per-recruit and spawning-biomass-per-recruit models to bias and imprecision in life history parameters: an example based on life history parameters of Japanese eel (Anguilla japonica). FB. 113(3):302–312.
- Lorenzen K. 1996. The relationship between body weight and natural mortality in juvenile and adult fish: a comparison of natural ecosystems and aquaculture. J Fish Biol. 49(4):627–642.
- Mace PM. 1994. Relationships between common biological reference points used as thresholds and targets of fisheries management strategies. Can J Fish Aquat Sci. 51(1):110–122.
- Peixer J, Catella AC, Petrere Júnior M. 2007. Yield per recruit of the pacu Piaractus mesopotamicus (Holmberg, 1887) in the pantanal of Mato Grosso do Sul, Brazil. Braz J Biol. 67:561–567.
- Ricker WE. 1975. Computation and interpretation of biological statistics of fish populations. Bull Fish Res Bd Can. 191:1–382.
- Smith MW, Then AY, Wor C, Ralph G, Pollock KH, Hoenig JM. 2012. Recommendations for catch-curve analysis. N Am J Fish Manage. 32(5):956–967.
- Sun CL, Ehrhardt NM, Porch CE, Yeh SZ. 2002. Analyses of yield and spawning stock biomass per recruit for the South Atlantic albacore (Thunnus alalunga). Fish Res. 56(2):193–204.
- Taylor CC. 1958. Cod growth and temperature. J Cons Int Explor Mer. 23(3):366–370.
- Then AY, Hoenig JM, Hall NG, Hewitt DA. 2015. Evaluating the predictive performance of empirical estimators of natural mortality rate using information on over 200 fish species. ICES J Mar Sci. 72(1):82–92.
- Treer T, Opačak A, Aničić I, Safner R, Piria M, Odak T. 2003. Growth of bream, Abramis brama in the Croatian Section of the Danube. Czech J Anim Sci. 48:251–256.
- Williams EH, Shertzer KW. 2003. Implications of life-history invariants for biological reference points used in fishery management. Can J Fish Aquat Sci. 60(6):710–720.
- Zhang Z, Campbell A. 2002. Application of a stochastic spawning stock biomass per recruit model for the horse clam fishery in British Columbia. Fishe Res. 57(1):9–23.
- Zhang ZM, Xie CX, Ding HP, Liu CJ, Ma XF, Cai LG. 2016. Age and growth of bream Abramis brama (Linnaeus, 1758) in the downstream section of Irtysh River in China. J Appl Ichthyol. 32(1):105–109.
- Zhang ZM, Liu CJ, Ding HP, Xie P, Ma XF, Guo Y, Xie CX. 2017. Reproductive biology of bream Abramis brama, (L.) in the lower reaches of the Irtysh River, China. Chin J Ocean Limnol. 35(6):1471–1481.
- Zischke MT, Griffiths SP. 2015. Per-recruit stock assessment of wahoo (Acanthocybium solandri) in the southwest Pacific Ocean. FB. 113(4):407–418.