
Abstract
Flooding duration is a major factor determining wetland plant growth and community composition. While there have been extensive studies on how direct effects of flooding duration on plant functional traits, very few have tested the indirect effects on these traits, including those arising from competition. We hypothesized that there would be a shift in importance of competition ability and flooding tolerance to functional traits along the flooding duration gradient. We investigated plant functional traits along a flooding duration gradient for two-dominant wetland plant species (Carex cinerascens and Phalaris arundinacea) in a lakeshore meadow of Poyang Lake, China. We found that these two species tended to have different strategies to adapt to flooding stress. P. arundinacea tended to adopt escape strategy with high growth rate (e.g. greater height, specific leaf area, and leaf N and P content) at longer flooding duration, while C. cinerascens tended to adopt more quiescence strategy, with only 5 of 13 of its traits showing a significant response. With shorter flooding duration, both species tended to have lower leaf N and P content, indicating greater nutrient limitation. Meanwhile, relative abundance of C. cinerascens with relatively higher belowground nutrient competition ability (i.e. greater root/shoot biomass ratio) decreased with flooding duration. These results suggest that belowground competition intensifies at shorter flooding duration, because of increased nutrient limitation with increased productivity. Therefore, our study indicates that both flooding stress and nutrient competition could affect plant functional traits along a flooding duration gradient.
Introduction
Flooding regime is one of the key factors affecting wetland biodiversity (Nilsson and Svedmark Citation2002). In recent decades, climate change and human activities have significantly changed the flooding regimes of most wetlands in the world (Carpenter et al. Citation1992; Nilsson and Berggren Citation2000; Lehner et al. Citation2006). By the turn of the 21st century, over 45,000 large dams with the capacity of withholding around 15% of the total annual river runoff were spread across half of the world’s river systems (WCD Citation2000; Nilsson et al. Citation2005), increasing to over 50,000 today (Goodwin et al. Citation2014). Changes in natural flooding regimes, as a consequence of these engineered structures, has become one of the major drivers of aquatic diversity loss (Bunn and Arthington Citation2002). Therefore, it is important to study the mechanisms underlying species’ responses to these changes (Bunn and Arthington Citation2002; Jardine et al. Citation2015).
In both terrestrial and aquatic ecosystems, plant functional traits play an important role in species’ responses to environmental changes (Boutin and Keddy Citation1993; Violle et al. Citation2007). In lakeshore meadows, which represent an interface between terrestrial and aquatic ecosystems, wetland plants need to maintain growth during dry season and adapt to submergence during flooding season (Keddy Citation2010). Therefore, there should be a suite of distinct traits for wetland plants compared with terrestrial or submerged aquatic plants (Garssen et al. Citation2015). However, most studies focus on the direct effects of flooding by physical stress on plant functional traits (Colmer and Voesenek Citation2009; Garssen et al. Citation2015), but rarely tested the effects of other processes (e.g. competition) with decreased flooding duration.
Wetland plants could have several strategies to flooding stress (Colmer and Voesenek Citation2009; Garssen et al. Citation2015). In response to flooding stress, species could adopt the escape strategy and grow faster to retain or develop structures that facilitate gas exchange between the plants and their submerged environment (Colmer and Voesenek Citation2009). These species would, therefore, have greater height, individual biomass, specific leaf area (Mommer et al. Citation2006; Panda et al. Citation2008; Fu et al. Citation2015, Garssen et al. Citation2015; Luo et al. Citation2016) (). In contrast, some species adopt the quiescence strategy, in which all plant materials remain submerged underwater, while their traits show much smaller responses to flooding than those adopting an escape strategy (Colmer and Voesenek Citation2009; Shi et al. Citation2015) (). However, there is still uncertainty regarding the relationship between trait responses to flooding and species’ distribution along the flooding gradient (Garssen et al. Citation2015; Lou et al. Citation2016). In some studies, if species had greater trait responses to flooding, they tended to distribute to areas with longer flooding durations (van Eck et al. Citation2004; Huber et al. Citation2009; Garssen et al. Citation2015; Luo et al. Citation2016). But such relationships become insignificant for some physiological traits, e.g. photosynthetic rate, transpiration rate (Luo et al. Citation2016).
Table 1. Responses of variables to flooding duration gradient according to different hypotheses.
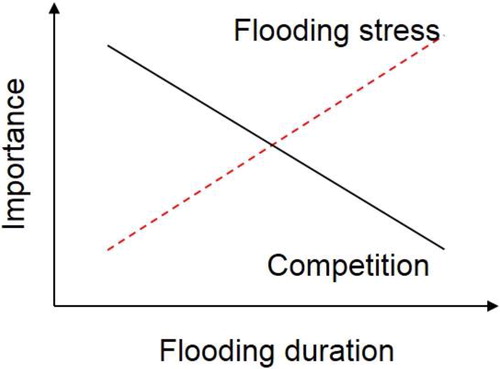
Competition is also a major factor of wetland plant community assembly (Keddy Citation2010). With decreasing flooding duration, the importance of flooding stress on wetland plant growth decreases and plant productivity increases (; Lan et al. Citation2018). Because competition intensity usually increases with productivity (Lan and Bai Citation2012; Lan et al. Citation2015), it would decrease with flooding duration (Emery et al. Citation2001; Fu et al. Citation2015; Lou et al. Citation2016). With increased productivity, nutrient limitation and competition usually increases, and plant N and P content decrease (Tilman Citation1982; Schoolmaster and Stagg Citation2018). In other words, reduced flooding duration would decrease leaf N and P content because of increased productivity (Lan et al. Citation2018) and favor species with strong belowground resource-competition ability. Meanwhile, increased productivity usually intensifies aboveground light competition and favors species that are strong at competing for light (Hautier et al. Citation2009; Lan and Bai Citation2012). If the intensity of both belowground and aboveground competition increases with productivity, decreased productivity with increased flooding duration would favor the most competitive species (). According to the total competition hypothesis, species with greater competitive ability should have higher growth rates with greater plant N and P content (Grime Citation1973; Suding et al. Citation2005). It is still uncertain whether total competition, or only belowground resource competition, or only aboveground light competition intensify with decreased flooding duration, which might have different effects on plant functional traits ().
Figure 1. A conceptual model of the ‘shift of flooding stress-competition’ hypothesis. With the flooding duration increasing, plant growth and productivity decrease through intensified flooding stress, resulting in decreased competition intensity.
Poyang Lake is the largest freshwater lake in China and has significant intra-annual water level variations (Hu et al. Citation2015; Fu et al. Citation2015). In recent years, the wetland vegetation of Poyang lake has significantly changed (Hu et al. Citation2015). The distribution area of community dominated by Carex species increased from 428 km2 in the 1980s to 723 km2 in the 2010s, but the underlying reasons for this change are still unclear. One possible reason is that water level is low in recent years (Zhang et al. Citation2012; Hu et al. Citation2015), which decreases flooding duration and promotes the dominance of species with lower flooding tolerance. To address the above uncertainties, we select two-dominant wetland species (Carex cinerascens, Phalaris arundinacea) with different hydrological niches along flood duration gradient of Poyang Lake. We aim to address the question: how do plant functional traits respond to flooding duration gradient, and what are the underlying mechanisms (e.g. flooding stress and competition)? We also test how species traits and trait responses related to species adaptation to flooding duration gradient.
Materials and methods
Study sites
This study was carried out in Nanji Wetland National Nature Reserve (28°52’21’’N-29°06’46’’N,116°10’24’’E-116°23’50’’E and 12-16 m a.s.l), which was located in the southern part of Poyang Lake in Jiangxi Province, China. Mean annual temperature in the study area is 17.6 °C, with mean monthly temperature ranging from 5.1 °C (January) to 29.5 °C (July). Mean annual precipitation is 1599.6 mm and mainly happens during April–June. During the flooding season (May–October), all of the wetlands are submerged at depths of 2–8 m, while during the dry season (November–April), most wetlands emerge and plant species sprout and grow. Thus, water level and flooding duration greatly influence community composition and productivity and generate significant zonation patterns along lakeshore meadow (Hu et al. Citation2015). Field investigation was carried out in a Carex meadow, which was dominated by C. cinerascens, P. arundinacea, Cardamine lyrata, Polygonum japonicum and Heleocharis valleculosa.
Field sampling
During April 10–14, 2015, we set a sampling transect of six sites along an elevation gradient of lakeshore meadow (Lan et al. Citation2018). The distance between neighboring sites ranged from 100 m to 150 m. There was a gradient of flooding duration along the elevation gradient from 105 to 122 flooding days.
At each sampling site, ten 2 × 2 m plots, at about 10 m- intervals, were arranged at the same elevation as one another in the geographic information system (Arc-GIS; ESRI, Redlands, CA, USA). Then, we fixed the position of each plot in the field using electronic tachometer total station (RTK systems, S86, South surveying and Mapping Instrument Company) and collected the elevation data. In each plot, we put a 0.5 × 0.5 m quadrat randomly and clipped all plants at the soil surface; and sorted all living vascular plants by species, to get the plant materials for aboveground biomass (AGB) of plant community as a whole and AGB of C. cinerascens and P. arundinacea. To estimate belowground biomass (BGB), we randomly selected 5 of 10 quadrats at each site and dug out one 0.25 × 0.25 × 0.25 m soil core in each quadrat. We cleaned the soil cores with tap water in the laboratory to get the BGB samples. All plant materials were oven-dried at 70 °C for 24 h and weighed. Species’ relative abundance was calculated as the percentage of species’ AGB to community AGB.
Plant functional traits
According to the hypotheses about traits response to flooding and competition (), plant functional traits in our study included whole-plant traits (e.g. plant height, individual biomass, stem: leaf biomass ratio), morphological traits (e.g. stem density, specific leaf area, leaf density, specific root length and root density) and leaf nutrient content (N and P content). Although some of the response variables could be correlated with each other (e.g. height and individual biomass), they related to different ecological functions and hypotheses (), and so we still kept these traits in the list of target traits.
To determine changes of plant functional traits along the flooding duration gradient, at each 2 × 2 m plot, we selected one individual plant, including both the aboveground plant materials and belowground roots for each dominant species (C. cinerascens and P. arundinacea). All of these plant materials were taken back to the laboratory for stem and leaf separation.
Plant height was measured as the distance from the basal stem to the natural crown. All leaves of an individual plant were picked and determined the projected leaf area with a portable leaf area meter (Li-3100C; Li-COR, Lincoln, NE, USA); and the number of leaves were recorded isochronously. Densities of stem, leaf and root were calculated from the oven-dry mass of the organs divided by the volume. The volume of plant organ was determined by the water-displacement method (Pérez-Harguindeguy et al. Citation2013). Then, the plant material samples were oven-dried at 70 °C for 24 h to constant mass and weighed. Hence, stem biomass, leaf biomass and individual biomass could be calculated, while specific leaf area (the ratio of leaf area to dry mass, cm2·g−1) and stem: leaf ratio were calculated separately.
After specific leaf area and leaf density measurement, leaf samples were oven-dried, weighed and ground to 80-mesh screen. Leaf N content was analyzed using a Kjeltec analyzer (Kjeltec 2300 Analyzer Unit; Foss, Sweden) and leaf P content was analyzed using the molybdenum blue colorimetric method with a UV/visible spectrophotometer (Beckman Coulter DU 800, USA).
The length of fresh roots was analyzed with a root analysis system (Delta-T Scan; Cambridge, UK). The specific root length (m·g−1) was determined by the ratio of total length of 1 order root (> 2 mm) to its dry mass (Shi et al. Citation2015).
Root/shoot biomass ratio in the pot experiment
Because it is very difficult to collect a whole root system in the field, we collect the data of species’ root biomass, shoot biomass and root/shoot biomass ratio in a pot experiment. In February 2017, during the period of plant turning green, we collected the rhizomes of C. cinerascens, P. arundinacea and soils at Nanji Wetland National Nature Reserve. In each plastic pot (16 cm in diameter and 20 cm in height, with one 1 cm-diameter hole at the bottom), we planted 5 rhizomes (5 cm in length) of a single species, with 9 pots for each species. We placed all these pots in the open area of Nanchang university campus and added tap water to keep the soil moisture during the experiment. All plants grew under the sunlight with no additional equipment. At the beginning of June 2017, when the Carex meadows were submerged by flooding water in the Poyang Lake, we collected whole plant individuals from each pot. All plant materials were cleaned by tap water and separated into shoots, rhizomes and roots. Then, the plant material samples were oven-dried at 70 °C for 24 h to constant mass and weighed, to determine root biomass, shoot biomass and root/shoot biomass ratio.
Data analysis
For each sampling plot, flooding duration or calculation of flooding days (the days when water level was greater than elevation) was calculated based on the mean daily water level during the year 2004–2014 in the Xingzi monitoring station in Poyang Lake (Lan et al. Citation2018).
Regression models were used to determine the relationships between flooding duration and different variables. These variables include whole-plant traits (height, individual biomass, stem biomass, leaf biomass, stem: leaf biomass ratio and leaf area), morphological traits (leaf density, stem density, root density, specific leaf area and specific root length), leaf nutrient content (N and P content), community properties (AGB, BGB and BGB/AGB), AGB and relative abundance of the two-dominant species. Each relationship was separately fitted by linear model, logarithm model, exponential model and quadratic model, with the final fitted model being that which had the highest fitness (greatest R2 and lowest AIC value) among all models (Table S1). Effects of species identity, flooding duration and their interaction on each plant functional trait were tested by two-way ANOVAs. Statistical analyses were performed using SAS Version 9.2 (SAS Institute, Cary, NC, USA, 2003).
Results
Responses of plant functional traits
Whole-plant trait values, including height, individual biomass, stem biomass, leaf biomass, stem: leaf biomass ratio and leaf area were all significantly different between P. arundinacea and C. cinerascens (). For C. cinerascens, height, individual biomass, stem biomass and other whole-plant traits were significantly different among different sites, but none of them had consistent response pattern along the flooding duration gradient (; ). For P. arundinacea, height increased from 105 to 119 cm with flooding duration (). Individual biomass, stem biomass and leaf biomass of P. arundinacea showed hump-shaped relationships with flooding duration and peaked at the flooding duration of 116 days (). Stem: leaf biomass ratio of P. arundinacea increased from 4.65 to 6.60 along the flooding duration gradient (). Leaf area per individual had no consistent response to the flooding duration gradient for P. arundinacea ().
Figure 2. Responses of whole-plant traits to flooding duration (error bars demote SEM, n = 10). Actual regressions were done on the unaveraged data points (n = 60).
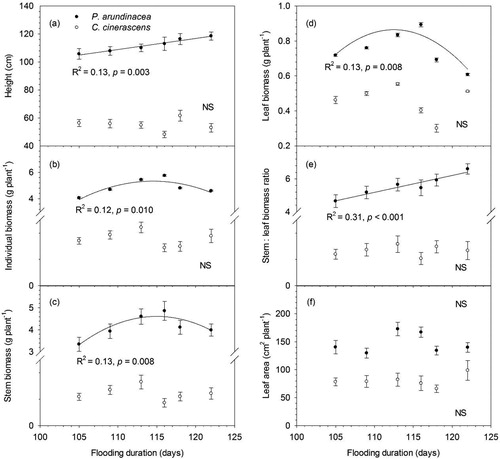
Table 2. p values of two-way ANOVAs of variance for each plant functional trait using species identity, flooding duration and their interaction as fixed-effects.
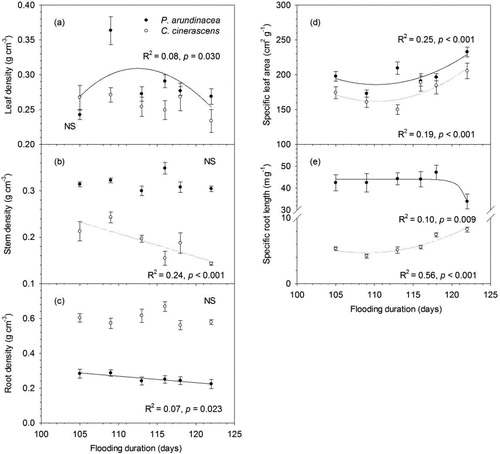
In terms of morphological traits, compared with C. cinerascens, P. arundinacea had greater leaf density, stem density, specific leaf area and specific root length but had lower root density (; ). Leaf density of P. arundinacea showed a hump-shaped response to flooding duration, while leaf density of C. cinerascens showed no consistent response to flooding duration (). Stem density of C. cinerascens linearly decreased with flooding duration from 0.21 to 0.14 g·cm−3, but stem density of P. arundinacea showed no consistent response to flooding duration (). Root density of P. arundinacea linearly decreased with flooding duration from 0.29 to 0.22 g·cm−3, while root density of C. cinerascens had no consistent response to the flooding duration gradient (). For both species, specific leaf area showed U-shaped relationship with flooding duration (). Specific root length of C. cinerascens showed U-shaped relationship with flooding duration, while specific root length of P. arundinacea only significantly decreased at longest flooding duration ().
Figure 3. Responses of leaf, stem and root traits to flooding duration (error bars demote SEM, n = 10). Actual regressions were done on the unaveraged data points (n = 60).
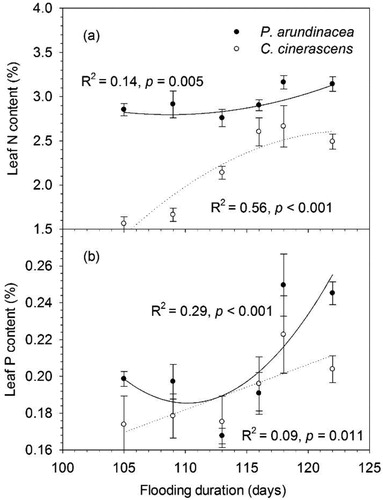
P. arundinacea had significantly greater (p < 0.05) leaf N and P content than C. cinerascens (; ). Leaf N and P content of P. arundinacea showed U-shaped relationship with flooding duration (). Leaf N and P content of P. arundinacea significantly increased with flooding duration ().
Figure 4. Responses of leaf N and P content to flooding duration (error bars demote SEM, n = 10). Actual regressions were done on the unaveraged data points (n = 60).
Response of community biomass and composition
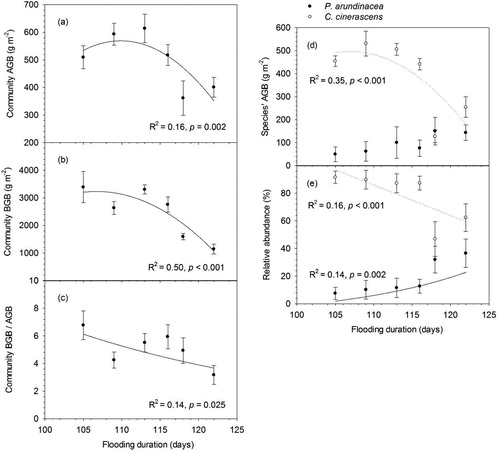
Community aboveground biomass (AGB) and belowground biomass (BGB) showed hump-shaped responses to the flooding duration gradient (), while Community BGB/AGB ratio decreased with flooding duration (). AGB of C. cinerascens significantly (p < 0.001) decreased at flooding duration of 118 days comparing with AGB at flooding duration <116 days, while AGB of P. arundinacea had no significant response to flooding duration (). Relative abundance of C. cinerascens significantly decreased with flooding duration, but relative abundance of P. arundinacea increased with flooding duration ().
Figure 5. Responses of (a) community aboveground biomass (AGB); (b) community belowground biomass (BGB); (c) community BGB/AGB ratio; (d) species’ AGB of P. arundinacea and C.cinerascens. (e) relative abundance of P. arundinacea and C.cinerascens to flooding duration (error bars demote SEM, n = 60). Actual regressions were done on the unaveraged data points (n = 60).
Biomass partition in the pot experiment
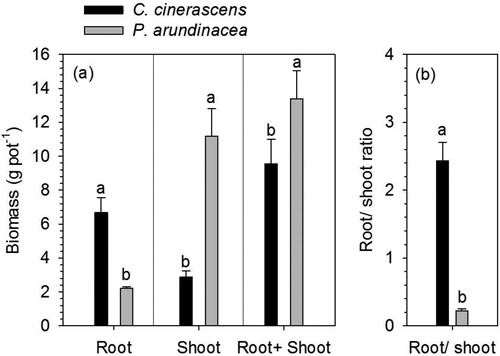
In the pot experiment, root biomass of C. cinerascens was significantly greater than that of P. arundinacea, while the shoot biomass of C. cinerascens was significantly lower than that of P. arundinacea (). Root + shoot biomass of C. cinerascens was significantly lower than for P. arundinacea (). Root/shoot biomass ratio of C. cinerascens was significantly greater than that of P. arundinacea ().
Figure 6. Shoot biomass, root biomass, root + shoot biomass, root/shoot biomass ratio of P. arundinacea and C.cinerascens (error bars demote SEM, n = 9). Bars with different letters represent significant differences between these two species (T-test, p < 0.05).
Discussion
Our study supports the idea that there are two different plant strategies to flooding stress (Colmer and Voesenek Citation2009). P. arundinacea tended to adopt escape strategies with greater growth rate while C. cinerascens tended to adopt the quiescence strategies. Firstly, P. arundinacea had greater trait values related to fast growth rate than C. cinerascens, including greater height, individual biomass, stem/leaf biomass ratio, specific leaf area, specific root length and leaf N and P content. Secondly, P. arundinacea had greater trait response to flooding duration than C. cinerascens. As a result, P. arundinacea could grow higher at longer flooding duration and increase the duration of top leaves being above the water surface than C. cinerascens (Figure S1), which not only facilitates gas diffusion between aerated and submerged organs, but also enhances leaf area of photosynthesis (Voesenek et al. Citation2004; Colmer and Voesenek Citation2009). In contrast, C. cinerascens had much fewer traits (only 5 of 13) significantly responding to the flooding duration gradient.
Our study found that with decreasing flooding duration, plant growth increased and, thereby, resource demand and intensity of resource competition increased. Firstly, consistent with the belowground competition hypothesis (Tilman Citation1982), leaf N and P content increased with flooding duration for both species. Contrary to the predictions of the aboveground competition hypothesis and total competition hypothesis (Lan and Bai Citation2012), height and stem: leaf biomass ratio of P. arundinacea increased with flooding duration. Secondly, consistent with the belowground competition hypothesis (Pan et al. Citation2011), community BGB and BGB/AGB ratio decreased with increased flooding duration. Thirdly, belowground competition hypothesis predicts that dominance of species with greater belowground competition will increase at the short flooding duration (Lan and Bai Citation2012). In the pot experiment, C. cinerascens had greater root biomass and root/shoot biomass ratio. Therefore, in their natural environment, C. cinerascens would have greater belowground competition ability than P. arundinacea (Pan et al. Citation2011; Lan et al. unpublished data). Belowground competition hypothesis was supported by the increased dominance of C. cinerascens and decreased dominance of P. arundinacea during shorter flooding duration.
Our study generally supports the idea that both flooding stress and competition affect plant functional traits along the flooding duration gradient. Responses of some functional traits (e.g. height of P. arundinacea) supported the escape strategy of flooding stress, while responses of some other traits (e.g. specific root length of P. arundinacea) supported the belowground competition hypothesis. Furthermore, some traits (e.g. specific root length of C. cinerascens) showed U-shaped relationship with flooding duration, indicating that functional traits at shorter flooding duration were affected by competition, and the importance of flooding stress on functional traits increased at longer flooding duration. Therefore, our study supports the hypothesis of a shift in importance between flooding stress and competition to plant community along the flooding duration gradient (Lan et al. Citation2018). Moreover, we found that plant biomass at both individual- and community- level showed hump-shaped relationship with flooding duration, suggesting negative effects of flooding on plant growth at longer flooding duration. Positive effects of flooding at relatively short flooding duration could be due to decreased resource limitation (Lan et al. Citation2018).
Some studies found correlations between trait response to flooding and species distribution along the flooding duration gradient (Shi et al. Citation2015; Luo et al. Citation2016). In one study, species with an escape strategy distributed to areas at high elevation and with short flooding duration (Hough-Snee et al. Citation2015). But in our study, P. arundinacea showed escape strategy to flooding stress and distributed at long flooding duration, because belowground competition ability of P. arundinacea was relatively low and belowground competition intensified at short flooding duration. Meanwhile, in another study, responses of performance traits affected species distribution along flooding duration gradient, but responses of physical traits did not have such effect (Luo et al. Citation2016). Therefore, responses of traits to flooding stress might not determine species distribution along the flooding duration gradient. Instead, we found that both flooding stress and competition affect plant functional traits. Since wetland plant community composition depended on flooding stress and competition (Keddy Citation2010), our study suggests that trait responses to flooding stress and competition, rather than trait responses to flooding stress, relate to species distribution along the flooding duration gradient.
In previous studies, wetland ecosystems could be only N limited (Ket et al. Citation2011), P limited (Paludan and Morris Citation1999) or a combination of N and P limitation (Verhoeven et al. Citation1996; Güsewell et al. Citation2003). As an index of nutrient limitation (Güsewell et al. Citation2003), in our study, leaf N and P content increased at long flooding duration, suggesting decreased nutrient limitation. In a study from the same area as this study, both N and P limitation intensified at higher elevation with shorter flooding duration, because soil N and P content showed much smaller incremental change to elevation than the increase of N and P storage in plant biomass (Lan et al. Citation2018). Therefore, limitation of N and P to plant growth could both decrease with flooding duration gradient because of the shift in importance between flooding stress and nutrient limitation to plant community. Moreover, leaf N content of C. cinerascens showed greater incremental change with flooding duration gradient than that of P. arundinacea, suggesting that N limitation of C. cinerascens was more sensitive to flooding duration than P. arundinacea.
Our study has important implications for wetland ecosystems management under global change and human activities. Firstly, in our study, C. cinerascens tended to adopt quiescence strategy and most of its functional traits were insensitive to the flooding duration gradient. Since C. cinerascens is the mostly dominant species in Poyang Lake (Hu et al. Citation2015), it is very important in maintaining the stability of wetland ecosystems subject to inter-annual variations of flooding duration. Secondly, we found that belowground competition intensified with decreasing flooding duration. Given that most wetlands in the world now experience changes in flooding regime due to human activities and climate changes (Carpenter et al. Citation1992; Nilsson and Berggren Citation2000; Lehner et al. Citation2006), such changes will affect wetland vegetation through affecting flooding stress and competition intensity. For example, water level becomes lower and flooding duration becomes shorter in the recent decades in Poyang Lake (Hu et al. Citation2015), which are predicted to favor species with high belowground competition ability (e.g. C. cinerascen), and the observations support this prediction (Hu et al. Citation2015). Our study therefore supports the hypothesis that low water level and short flooding duration are responsible for changes in the wetland vegetation of Poyang Lake (Zhang et al. Citation2012; Hu et al. Citation2015). Thirdly, many wetland ecosystems are now experiencing eutrophication of N and P (Smith et al. Citation1999; Le et al. Citation2010; Sinha et al. Citation2017). Eutrophication usually decreases belowground competition and intensifies light competition (Hautier et al. Citation2009; Lan and Bai Citation2012), thus could mediate the effects of changes in flooding regimes on wetland vegetation (Johnson et al. Citation2016; Sinha et al., Citation2017).
Notes on contributors
Zhichun Lan is currently a wetland ecologist and assistant professor at Nanchang University.
Hao Huang is currently a graduate student at East China Normal University and had completed his BS degree in Ecology at Nanchang University.
Yasong Chen is a graduate student in Ecology at Nanchang University.
Jiasheng Liu is a biology teacher and has completed his BS degree in Biology at Nanchang University.
Jianguo Chen is a hydraulic engineer at Guangxi Key laboratory of Water Engineering materials and structures, Guangxi Hydraulic Research Institute.
Lin Li is a hydraulic engineer at Guangxi Key laboratory of Water Engineering materials and structures, Guangxi Hydraulic Research Institute.
Lei Li is currently a wetland ecologist and assistant professor at Nanchang University.
Binsong Jin is currently a fish ecologist and associate professor at Nanchang University.
Jiakuan Chen is currently wetland ecologist and professor at Fudan University.
Supplemental Material
Download MS Word (126.8 KB)Acknowledgements
We thank Jianbo Ma, Songxian Wan, Xuren Hu, Wei Shi, Yingzheng Wan and many others in the Nanchang University and Nanji Wetland National Nature Reserve for their help with field experiments. We also thank Shuchao Wang, Li Li and many others at the Inner Mongolia grassland Ecosystem research Station, Chinese Academy of Sciences for their help with laboratory determination.
Disclosure statement
No potential conflict of interest was reported by the authors.
Additional information
Funding
Related Research Data
References
- Boutin C, Keddy PA. 1993. A functional classification of wetland plants. J Veg Sci. 4(5):591–600.
- Bunn SE, Arthington AH. 2002. Basic principles and ecological consequences of altered flow regimes for aquatic biodiversity. Environ Manage. 30(4):492–507.
- Carpenter SR, Fisher SG, Grimm NB, Kitchell JF. 1992. Global change and freshwater ecosystems. Annu Rev Ecol Syst. 23(1):119–139.
- Colmer TD, Voesenek LCJ. 2009. Flooding tolerance: suites of plant traits in variable environments. Functional Plant Biol. 36(8):665–681.
- Emery NC, Ewanchuk PJ, Bertness MD. 2001. Competition and salt-marsh plant zonation: stress tolerators may be dominant competitors. Ecology. 82(9):2471–2485.
- Fu H, Zhong J, Yuan G, Guo C, Ding H, Feng Q, Fu Q. 2015. A functional-trait approach reveals community diversity and assembly processes responses to flood disturbance in a subtropical wetland. Ecol Res. 30(1):57–66.
- Garssen AG, Annette B-P, Voesenek LCJ, Verhoeven JTA, Soons MB. 2015. Riparian plant community responses to increased flooding: a meta-analysis. Glob Change Biol. 21(8):2881–2890.
- Goodwin RA, Politano M, Garvin JW, Nestler JM, Hay D, Anderson JJ, Weber LJ, Dimperio E, Smith DL, Timko M. 2014. Fish navigation of large dams emerges from their modulation of flow field experience. Proc Natl Acad Sci USA. 111(14):5277–5282.
- Grime JP. 1973. Competitive exclusion in herbaceous vegetation. Nature. 242(5396):344–347.
- Güsewell S, Koerselman W, Verhoeven JTA. 2003. Biomass N: P ratios as indicators of nutrient limitation for plant populations in wetlands. Ecol Appl. 13(2):372–384.
- Hautier Y, Niklaus PA, Hector A. 2009. Competition for light causes plant biodiversity loss after eutrophication. Science. 324(5927):636–638.
- Hough-Snee N, Nackley LL, Kim S-H, Ewing K. 2015. Does plant performance under stress explain divergent life history strategies? The effects of flooding and nutrient stress on two wetland sedges. Aquat Bot. 120:151–159.
- Hu Z, Ge G, Liu C. 2015. Cause analysis and early warning for wetland vegetation degradation in Poyang Lake. Resources and Environment in the Yangtze Basin. 24:381–386.
- Huber H, Jacobs E, Visser EJW. 2009. Variation in flooding-induced morphological traits in natural populations of white clover. Trifolium repens. and their effects on plant performance during soil flooding. Ann Bot-London. 103(2):377–386.
- Jardine TD, Bond NR, Burford MA, Kennard MJ, Ward DP, Bayliss P, Davies PM, Douglas MM, Hamilton SK, Melack JM, et al. 2015. Does flood rhythm drive ecosystem responses in tropical riverscapes? Ecology. 96(3):684–692.
- Johnson DS, Warren RS, Deegan LA, Mozdzer TJ. 2016. Saltmarsh plant responses to eutrophication. Ecol Appl. 26(8):2647–2659.
- Keddy PA. 2010. Wetland ecology: principles and conservation. Cambridge: Cambridge University Press.
- Ket WA, Schubauer-Berigan JP, Craft CB. 2011. Effects of five years of nitrogen and phosphorus additions on a Zizaniopsis miliacea tidal freshwater marsh. Aquat Bot. 95(1):17–23.
- Lan Z, Bai Y. 2012. Testing mechanisms of N-enrichment-induced species loss in a semiarid Inner Mongolia grassland: critical thresholds and implications for long-term ecosystem responses. Philos T Roy Soc. B. 367(1606):3125–3134.
- Lan Z, Jenerette GD, Zhan S, Li W, Zheng S, Bai Y. 2015. Testing the scaling effects and mechanisms of N-induced biodiversity loss: evidence from a decade-long grassland experiment. J Ecol. 103(3):750–760.
- Lan Z, Chen Y, Li L, Li F, Jin B, Chen J. 2018. Testing mechanisms underlying elevational variations of lakeshore plant diversity in Lake Poyang, China. J Plant Ecol. doi:10.1093/jpe/rty027
- Le C, Zha Y, Li Y, Sun D, Lu H, Yin B. 2010. Eutrophication of lake waters in China: cost, causes, and control. Environ Manage. 45(4):662–668.
- Lehner B, Döll P, Alcamo J, Henrichs T, Kaspar F. 2006. Estimating the impact of global change on flood and drought risks in Europe: A continental, integrated analysis. Climatic Change. 75(3):273–299.
- Lou Y, Pan Y, Gao C, Jiang M, Lu X, Xu YJ. 2016. Response of plant height, species richness and aboveground biomass to flooding gradient along vegetation zones in floodplain wetlands, Northeast China. PLos One. 11(4):e0153972.
- Luo F, Huang L, Lei T, Xue W, Li H, Yu F, Cornelissen JHC. 2016. Responsiveness of performance and morphological traits to experimental submergence predicts field distribution pattern of wetland plants. J Veg Sci. 27(2):340–351.
- Mommer L, Lenssen JPM, Huber H, Visser EJW, De Kroon H. 2006. Ecophysiological determinants of plant performance under flooding: A comparative study of seven plant families. J Ecology. 94(6):1117–1129.
- Nilsson C, Berggren K. 2000. Alteration of riparian ecosystems caused by river regulation. BioScience. 50(9):783–792.
- Nilsson C, Svedmark M. 2002. Basic principles and ecological consequences of changing water regimes: riparian plant communities. Environ Manage. 30(4):468–480.
- Nilsson C, Reidy CA, Dynesius M, Revenga C. 2005. Fragmentation and flow regulation of the world's large river systems. Science. 308(5720):405–408.
- Paludan C, Morris JT. 1999. Distribution and speciation of phosphorus along a salinity gradient in intertidal marsh sediments. Biogeochem. 45(2):197–221.
- Pan Q, Bai Y, Wu J, Han X. 2011. Hierarchical plant responses and diversity loss after nitrogen addition: Testing three functionally-based hypotheses in the Inner Mongolia grassland. PLoS One. 6(5):e20078.
- Panda D, Sharma SG, Sarkar RK. 2008. Chlorophyll fluorescence parameters, CO 2 photosynthetic rate and regeneration capacity as a result of complete submergence and subsequent re-emergence in rice. Oryza sativa L. Aquat Bot. 88(2):127–133.
- Pérez-Harguindeguy N, Díaz S, Garnier E, Lavorel S, Poorter H, Jaureguiberry P, Bret-Harte MS, Cornwell WK, Craine JM, Gurvich DE, et al. 2013. New handbook for standardised measurement of plant functional traits worldwide. Aust J Bot. 61(3):167–234.
- Schoolmaster DR, Stagg CL. 2018. Resource competition model predicts zonation and increasing nutrient use efficiency along a wetland salinity gradient. Ecology. 99(3):670–680.
- Shi F, Song C, Zhang X, Mao R, Guo Y, Gao F. 2015. Plant zonation patterns reflected by the differences in plant growth, biomass partitioning and root traits along a water level gradient among four common vascular plants in freshwater marshes of the Sanjiang Plain, Northeast China. Ecol Eng. 81:158–164.
- Sinha E, Michalak AM, Balaji V. 2017. Eutrophication will increase during the 21st century as a result of precipitation changes. Science. 357(6349):405–408.
- Smith VH, Tilman GD, Nekola JC. 1999. Eutrophication: impacts of excess nutrient inputs on freshwater, marine, and terrestrial ecosystems. Environ Pollut. 100(1–3):179–196.
- Suding KN, Collins SL, Gough L, Clark C, Cleland EE, Gross KL, Milchunas DG, Pennings S. 2005. Functional- and abundance-based mechanisms explain diversity loss due to N fertilization. Proc Natl Acad Sci USA. 102(12):4387–4392.
- Tilman D. 1982. Resource competition and community structure. Princeton, NJ: Princeton University Press.
- Van Eck WHJM, Van De Steeg HM, Blom CWPM, De Kroon H. 2004. Is tolerance to summer flooding correlated with distribution patterns in river floodplains? A comparative study of 20 terrestrial grassland species. Oikos. 107(2):393–405.
- Verhoeven JTA, Koerselman W, Meuleman AFM. 1996. Nitrogen- or phosphorus-limited growth in herbaceous, wet vegetation: relations with atmospheric inputs and management regimes. Trends Ecol Evol (Amst). 11(12):494–497.
- Violle C, Navas ML, Vile D, Kazakou E, Fortunel C, Hummel I, Garnier E. 2007. Let the concept of trait be functional! Oikos. 116(5):882–892.
- Voesenek LACJ, Rijnders JHGM, Peeters AJM, van de Steeg HM, de Kroon H. 2004. Plant hormones regulate fast shoot elongation under water: from genes to communities. Ecology. 85(1):16–27.
- World Commission on Dams (WCD). 2000. Dams and development: A new framework for decision-making. London, UK: Earthscan Publications Ltd.
- Zhang L, Yin J, Jiang Y, Wang H. 2012. Relationship between the hydrological conditions and the distribution of vegetation communities within the Poyang Lake National Nature Reserve, China. Ecol Inform. 11:65–75.
- Zheng S, Lan Z, Li W, Shao R, Shan Y, Wan H, Taube F, Bai Y. 2011. Differential responses of plant functional trait to grazing between two contrasting dominant C3 and C4 species in a typical steppe of Inner Mongolia, China. Plant Soil. 340(1–2):141–155.