
Abstract
Resources utilization and trophic structure in aquatic food webs play important roles in the ecosystem stability and functioning. Silver carp (SC, Hypophthalmichthys molitrix) and bighead carp (BC, Hypophthalmichthys nobilis) are intensively stocked in lakes and reservoirs in China and share similar food resources and trophic positions in water bodies. To better understand the ecological roles of SC and BC in natural freshwater, two mesotrophic reservoirs (Nanwan and Nianyushan) were selected to compare resource utilization and the trophic niche of these two fish species. Data analysis using Bayesian mixing model showed that SC was more like a fine particulate organic matter (fPOM) feeder, while BC consumed more coarse particulate organic matter (cPOM) and displayed a higher trophic position in both reservoirs. In contrast, niche breadths represented by the corrected standard ellipse area (SEAC) were essentially the same for SC and BC in Nanwan (SEAC = 6.1 for SC and BC), but much larger for silver carp in Nianyushan (SEAC for SC: 11.6, SEAC for BC: 4.2). The high stocking ratio of SC/BC in Nianyushan was the probable reason for the large SEAC of silver carp, which suggested that silver carp could use more food resources and become more competitive with a higher stocking biomass ratio. The results indicated that the trophic partitioning of filter feeders might be regulated by the stocking biomass ratio of the fish to some extent.
Introduction
Understanding the ecological mechanisms of the resources utilization and trophic niche of two or more species is an important objective of ecological studies. Niche breadth is a fundamental parameter for the evaluation of the level of dietary specialization. Species with narrow niches are always more specialized than typical generalists with larger trophic niches (Newsome et al. Citation2007). These generalists could coexist despite occupying similar niches when differences in relative competitive ability are minor. Furthermore, researchers usually use trophic niche overlap to predict the intensity of resource competition (Chase and Leibold Citation2003; Corrêa et al. Citation2011). For two species with minor differences in competitive ability, higher niche overlap is always due to more source utilization but may not cause competitive exclusion (Bulleri et al. Citation2016).
The trophic filter feeders play important roles in the structure and dynamics of food webs (Thompson et al. Citation2007; Yao et al. Citation2016). Filter-feeding fish is defined as feeding suspended food, mostly phytoplankton, detritus and small zooplankton (Vadeboncoeur et al. Citation2005). To some extent, filter-feeding fish could stabilize consumer-resource interactions, alter the strength of top-down regulation, and play different ecological roles in water bodies (McCann and Hastings Citation1997; Loeuille and Loreau Citation2004). However, ecological role is not always expressed similarly in aquatic ecosystems because different filter feeders partition various trophic niches according to their species, densities and stocking ratios in a water body, and competition with other species (Vadeboncoeur et al. Citation2005; Xu et al. Citation2012; Yao et al. Citation2016). Therefore, it is important to understand how filter-feeding consumers partition their trophic niches in a single food chain.
In tropic and subtropic regions of China, silver carp (SC, Hypophthalmichthys molitrix) and bighead carp (BC, Hypophthalmichthys nobilis) are the most dominant species and are of economic importance. Both SC and BC have been intensively stocked in lakes and reservoirs in China since the 1970s (Han Citation2010). By 2010, these two species accounted for more than 6.5 million tons and over 19.3% of the total freshwater fish production all over the world (Fisheries and Aquaculture Department (US) Citation2012). They are also stocked together into lakes and reservoirs to utilize food sources and are used as a tool to control cyanobacteria in many highly eutrophic lakes (Ke et al. Citation2008; Xu et al. Citation2012; Guo et al. Citation2015). However, these carp species are considered invasive species that could compete with native species sharing similar trophic positions for natural resources in the United States (Irons et al. Citation2007). Whatever their ecological roles, they always coexist in a single water body and use similar food resources. Previous findings have suggested that SC and BC share a similar trophic niche for natural resources (Gu et al. Citation1996a; Zhou et al. Citation2009; Chen et al. Citation2011). They also share a similar diet, but a different food composition because of different meshes of their gill rakers (Li et al. Citation2013). Jayasinghe et al. (Citation2015) indicated that SC is more considered as a phytoplankton feeder, while BC is more likely a zooplankton feeder.
In general, both silver and bighead carps consume particulate foods of many types in the 10–1000 micrometer-range particles, including phytoplankton, zooplankton, plant pollen, detritus and incidental sediment (Cremer and Smitherman Citation1980; Kolar et al. Citation2005; Li et al. Citation2013). Lazzaro (Citation1987) pointed out that they are particulate feeders in larval and prejuvenile stages, with a body length smaller than 30 mm, while adult fish are omnivorous filter feeders (Spataru and Gophen Citation1985; Vörös et al. Citation1997). Past dietary studies of the two species were mostly based on analysis of gut contents, which may not represent the growth of the fishes and did not provide insight into the magnitude of stocking ratio between the two species.
Stable isotopes of carbon (δ13C) and nitrogen (δ15N) can be used in measuring trophic niche since the stable isotope values in consumer tissues are closely related to their food resources (Gu et al. Citation1996a; Citation1996b; Citation1997; Jayasinghe et al. Citation2015). Hence, the SI technique has been used to analyze the trophic dynamics of SC and BC (Gu et al. Citation1996b, Li et al. Citation2013), as well as the dietary overlap between both species (Gu et al. Citation1996a; Li et al. Citation2013; Jayasinghe et al. Citation2015; Yao et al. Citation2016). Most researches indicated that food resources were responsible to the trophic niche and overlap. For example, Jayasinghe et al. (Citation2015) pointed out that niche overlap was variable with food resources but in general clear size-based resource partitioning was observed, with bighead carp preying more on zooplankton and occupying a higher trophic position. However, except food resources, their trophic niche and overlap may be affected by fish stocking ratio either. To elucidate whether the trophic niche width and overlap of the two carps affected by fish stocking ratio, seasonal samples (including four food sources and fish muscle tissue) were taken over two full annual cycles in two deep and meso-eutrophic reservoirs in China. Selecting two reservoirs with similar habitats provides different fish stocking ratio, which in turn allows for the observation of their trophic niche in the food web. The main objectives of the present study are to: (i) examine the degree of trophic niche and dietary overlap between the two species in the two reservoirs, and (ii) check whether the fish stocking ratio has effect on trophic niche of the two carps.
Materials and methods
Study sites
The Nanwan (32°4′N, 113°57′E) and Nianyushan (31°47′N 115°20′ E) Reservoirs are monomictic meso-eutrophic reservoirs, with a 130 km distance from each other. The basic features and trophic states of the two reservoirs are shown in . Private business for fishery were prohibited from 2004 instead of governments management, leading to fish density increasing in the two reservoirs. Fish feeding on natural food and resources because bait is also forbidden in the reservoirs. SC and BC have been intensively stocked by governments in the past 15 years, so that they are the dominant fishes (more than 85% of the fish yield) in the two reservoirs. But the specific fish densities and yields are unknown. The dry season runs from October to May; about 60% of annual precipitation occurs in the wet season, from June to September. In addition, the watersheds of the two reservoirs are covered with pine forest (mainly Pinus massoniana). In spring, when pine forests blossom, the surface water is covered with pine pollen. All water samples were collected in the lacustrine zone, including three sampling sites in each of the reservoirs shown in .
Figure 1. Location of the Nanwan and Nianyushan reservoirs and sampling sites (★).
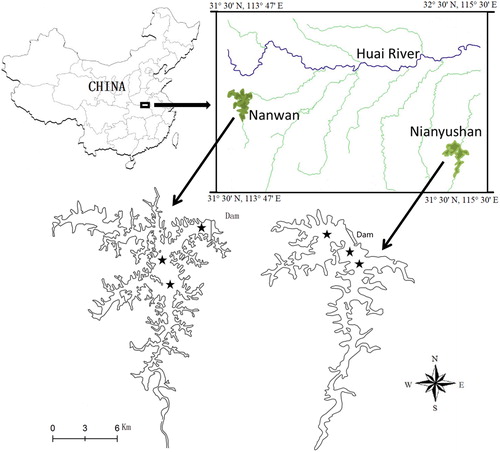
Table 1. Basic features and trophic states (mean values during 2014–2016) of the two reservoirs.
Sample collection and plankton analysis
Sampling was carried out seasonally (four times in one year) at three sites in both reservoirs from 21 August 2014 to 31 June 2016. Water samples for nutrients were collected with a 5 L sampler from the 0.5 m below the surface. Total phosphorus (TP), total nitrogen (TN), and chlorophyll-a (Chl-a) concentrations in the water samples were determined according to the Chinese National Standards for water quality and the USA Environmental Protection Agency standards (APHA Citation1989). Fish density and stocking ratio between the two fishes were estimated from fish yield information (Dick and MacCall Citation2011) provided by the reservoirs’ administration in Xinyang, China.
Fish samples for isotope analysis were collected by fishermen by net casting (with same pore size) from the three sites at each reservoir. Individuals of each species from ages 4 to 5 were selected from each site to reduce the age variance. We collect samples from full annual cycles because they could better represent trophic niche of fish. Of the eight sampling occasions, 24 SCs and 24 BCs (every sampling occasion has three samples) were chosen from each reservoir. Body length was measured with a ruler with an accuracy of 1 mm. Body weight was measured with a balance with an accuracy of 1 g. After measuring the body length and weighing each fish, white dorsal muscle tissue was collected. The muscle tissue samples were freeze-dried, ground to a fine homogeneous powder and encapsulated into tin capsules for isotope analysis.
Previous research showed SC and BC are filter feeders based on the structure of gill rakers and the size of suspending food particles (Zhou et al. Citation2009). Therefore, we categorized potential food particles as follows: suspending particles of >64 μm as coarse particulate organic matter (cPOM, mainly consisting of phytoplankton), suspending particles of 0.45–64 μm as fine particulate organic matter (fPOM), zooplankton (Zoopl) and pollen of Pinus massoniana. We collected cPOM from 5 L of 0.5 m underwater filtered with a 64-μm nylon mesh and concentrated to 10–20 ml. This procedure can guarantee what we collecting was particles >64-μm. Then we filtered the concentrated liquor on Whatman GF/F filters (pore size = 0.45 μm) and dried at 60 °C in an oven. For fPOM of 0.45–64 μm, we collected 3–5 L of water from the surface and passed it through a 64-μm nylon net to remove plankton and greater debris; the filtered water was then filtered on Whatman GF/F filters (pore size = 0.45 μm) and were also dried at 60 °C in an oven. Both cPOM and fPOM samples were scraped from the filters and loaded into tin capsules for mass spectrometer analysis. Zooplanktons were sampled with a 120 μm mesh net in vertical tows through the whole water column. The mixed zooplankton was kept alive about 6–8 hours for gut clearance and was then picked out one by one under a microscope. Zooplankton samples were then put into tin capsules and oven dried at 60 °C to a constant weight for stable isotope analysis. Pollen can only be collected in spring. In spring, we collected pollen for stable isotope analysis from Pinus massoniana trees on the islands inlayed in the reservoirs.
Stable-isotope analysis
All isotope samples were analyzed with a Carlo Erba EA-1110 elemental analyzer accompanied by a Delta Plus Finnigan Mat isotope ratio mass spectrometer via continuous flow II interface by Zhengzhou Customs of the People’s Republic of China. Isotopic ratios were expressed relative to international standards. Stable isotope values were defined as: δR (‰) = [(Xsample − Xstandard)/Xstandard] × 103, where R = 13C or 15N, and X is the corresponding ratio 13C/12C or 15N/14N. The precision of measurements was ±0.1 ‰ for 13C and ±0.2 ‰ for 15N.
Zooplankton biomass analysis
A total of 30 L of water was collected by a 5 L iron sampler for a zooplankton sample from the surface to a 15 m depth at 3 m intervals at the sampling sites (Zhang et al. Citation2015). For rotifers and protozoa were present but in low biomass in the reservoirs (Zhang et al. Citation2015), we can almost ignore their ecological roles in our experiment. Therefore, the water was filtered into a net with a 120 μm mesh, and then concentrated to 10–20 ml and preserved with 4% formaldehyde. Counts were made under a microscope at magnification of 5× (Nikon Corp SMZ645). The biomass of each species was estimated by measuring the length of at least 20 specimens whenever a sufficient number of animals were available. Individual body wet weight (μg) was estimated following the equations from Dumont et al. (Citation1975) and Zhang and Huang (Citation1991).
Data analysis
We carried out statistical analyses of stable-isotope data using the ‘SIAR’ package (Parnell et al. Citation2010; Parnell and Jackson Citation2013) in the R language environment. The Bayesian mixing model uses standard Markov Chain Monte Carlo fitting algorithms and Dirichlet prior distributions to estimate the posterior distribution of proportional dietary intake for consumers (Parnell et al. Citation2010). For the SIAR mixing model, we produced a source table of δ13C and δ15N in cPOM, fPOM, zooplankton and pollen (mean and standard deviation). The consumer table included all sampled individuals of δ13C and δ15N in SC and BC, using Group 1 and Group 2 as replacements. Trophic enrichment factors of 0.8 ± 0.5% for carbon and 3.4 ± 1% were used for nitrogen as correlations for both carp species (Post Citation2002). Consequently, we launched two ‘SIAR’ models using SIAR matrix plots and correlation values to identify the contributions from four food sources separately for the two reservoirs. We assessed the percentage contribution from each food source of both carps by running the model.
To quantify the extent of isotope niche overlap between the two fish, we used the SIBER approach available in SIAR, which is built on Layman metrics and computes the standard ellipse area (SEA). The SEA, reflecting the mean core population isotope niche, was used to evaluate the isotope niche breadth of SC and BC. The SEA is calculated based on the δ13C and δ15N values and contains about 40% of the data, which reveals the core niche area (Jackson et al. Citation2011). Moreover, the corrected standard ellipse area (SEAc) was used to estimate the fish niche overlap, following a Bayesian approach to estimate a 95% confidence interval (Jackson et al. Citation2011). Explicitly, SEAc = SEA × (n − 1)/(n − 2).
The differences in the nutrient concentrations, Chl-a concentration, zooplankton biomass and SI values between the two reservoirs were tested by one-way non-parametric analyses of variance (NPANOVA). The assumed significance level was α = 0.05. The statistical analyses were run with SPSS (SPSS for Windows, version 24.0).
Results
Both reservoirs were meso-eutrophic according to the TN, TP, SD and Chl-a concentrations (). Our results showed that no significant differences were observed in TN, TP, SD and Chla (NPANOVA, p > 0.05), compared to those in the Nianyushan Reservoir.
No differences in the body length of the SC and BC samples between the two reservoirs were found (, NPANOVA, p > 0.05). In the Nanwan Reservoir, the biomass ratio between SC and BC was 1:3, and the total fish density was 5.7 g/m3, estimated from reservoir volume and fish harvests during 2011–2015. The biomass ratio between SC and BC was 1:2, and total fish density was 6.2 g/m3 in the Nianyushan Reservoir. The actual isotope values of the four food sources are shown in . The δ13C and δ15N of each food source and two carp species were presented separately on isotopic biplots from the two reservoirs (). When comparing the same species in the different reservoirs, the SC in the Nanwan Reservoir showed significantly lower δ13C values than those in the Nianyushan Reservoir (NPANOVA, SC: p = 0.003; BC: p = 0.115). When comparing the different species in a single reservoir, the δ15N in the BC showed significantly higher than those in the SC in both of the reservoirs (NPANOVA, Nanwan: p = 0.003, Nianyushan: p = 0.005). Higher δ15N in BC than those of SC, displaying a higher trophic position in the food web. Meantime, the muscle δ15N values of SC and BC were 2.97‰ and 4.59‰ higher than those in cPOM in the Nanwan Reservoir, and were 2.92‰ and 4.28‰ higher than those in cPOM in the Nianyushan Reservoir.
Figure 2. Isotopic biplots showing δ15N (‰) and δ13C (‰) values (mean ± SD) of silver carp, bighead carp, and their food sources in the Nanwan (a) and Nianyushan (b) reservoirs. fPOM: fine particulate organic matter, cPOM: coarse particulate organic matter, Zoopl: zooplankton, and pollen: pollen of Pinus massoniana.
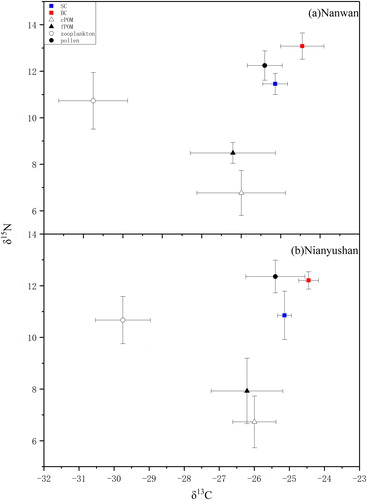
Table 2. Biomass density and total body length of two carp species (Silver carp: SC, Bighead carp: BC) sampled from two reservoirs.
Table 3. Mean and standard deviation of stable isotopes of four food sources. cPOM: coarse particulate organic matter, fPOM: fine particulate organic matter, Zoopl: zooplankton, and pollen: pollen of Pinus massoniana.
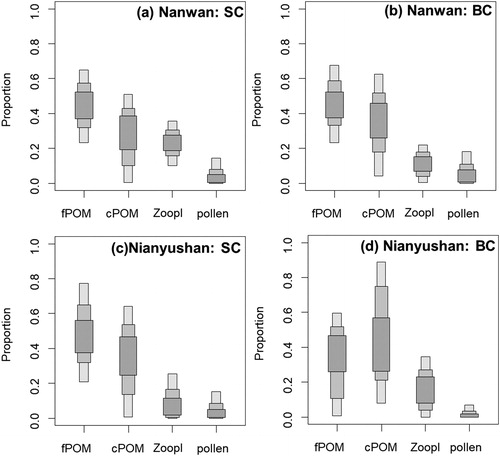
Box plots based on the Bayesian mixing model showed that fish had similar diet compositions in the two reservoirs (). In the Nanwan Reservoir, fPOM, cPOM, zooplankton and pollen constituted 46.7, 24.5, 23.2 and 5.5% for the SC diet, and 49.1, 31.5, 11.6 and 7.7% for the BC diet, respectively (). In the Nianyushan Reservoir, the four food sources contributed 48.0, 34.8, 11.1 and 6.0% for the SC diet, and 32.9, 47.3, 17.5 and 2.4% for the BC diet, respectively (). SC showed a higher proportional contribution from fPOM (the lowest δ15N in the four food sources) than that of BC in both reservoirs, corresponding to the lower trophic position of SC in the food web.
Figure 3. Proportional contribution from fine particulate organic matter (fPOM), coarse particulate organic matter (cPOM), zooplankton (Zoopl) and pollen of Pinus massoniana to the diet of silver carp (SC) and bighead carp (BC) in the two reservoirs (Nanwan and Nianyushan). Box levels show 50, 75 and 95% confidence intervals.
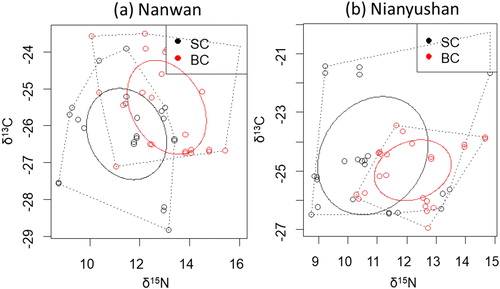
Corrected standard ellipse areas (SEAc) for SC and BC showed different isotopic niche overlaps in the two reservoirs (). The isotope niche overlaps were 22.8% of SEAc for SC and 23.1% for BC in the Nanwan Reservoir, and were 22.3% for SC and 62.2% for BC in the Nianyushan Reservoir. Niche breadths represented by SEAc were same in the SC and BC in the Nanwan Reservoir (SEAc for SC: 6.1, SEAc for BC: 6.1), but were much larger for silver carp in the Nianyushan Reservoir (SEAc for SC: 11.6, SEAc for BC: 4.2).
Figure 4. Isotope niche breadths marked with corrected standard ellipse areas (SEAC) for the silver carp (SC with black circles) and bighead carp (BC with red circles).
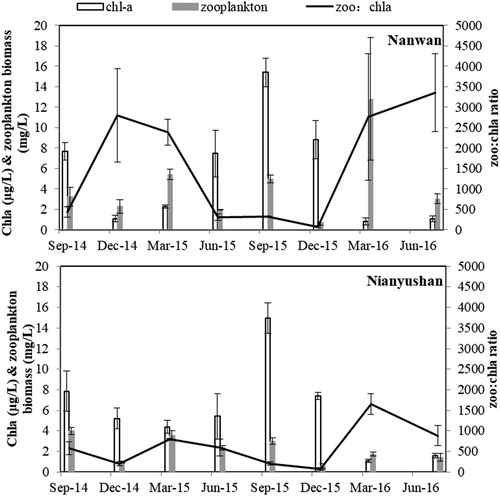
Seasonal data showed that no significant difference in the Chl-a concentration between the two reservoirs was found (, NPANOVA, p = 0.483). However, compared to the Nianyushan Reservoir, the zooplankton biomass was significantly higher in the Nanwan Reservoir (NPANOVA, p = 0.048), leading to a ratio of zooplankton biomass to Chla concentration (zoo:chla ratio), which were also significantly higher (NPANOVA, p = 0.024), especially in the season of spring.
Figure 5. Seasonal data of chla concentration and zooplankton biomass (mean ± SD) in the Nanwan (a) and Nianyushan (b) reservoirs. Zoo:Chla ratio: ratio of zooplankton biomass to chla concentration.
Discussion
Diet of SC and BC
Zhou et al. (Citation2009) observed ontogenetic changes in the isotopic values of SC and BC, which indicates that the changes in SI values stabilized when the fishes grew to >40 cm. All sampled fishes in our study were >40 cm, and no significant changes in SI values were observed for different fish lengths. Hence, for fish >40 cm, muscle tissue SI values can better represent their long dietary periods.
Jayasinghe et al. (Citation2015) indicated that SC is more likely a phytoplankton feeder, while BC is more likely a zooplankton feeder. However, the categories that we used to classify food types would not result in either a phytoplankton-only feeder or zooplankton-only feeder, because both plankton types consisted of species with a wider range in body sizes. Our results showed that SC was more like an fPOM feeder, while BC consumed more cPOM than SC did. In the meso-eutrophic environment, we suggested that fine particles were significant to the diet of SC, while coarse particles were important to the diet of BC. Actually, SC has a more specialized filtering structure, with gill rakers fused, forming a sponge-like filter capable of retaining particles as small as 4.5–10 μm (Xie Citation1999). In contrast, BC usually filters much larger particles (>10 μm) (Cremer and Smitherman Citation1980). In fact, most of the previous researches were carried out in eutrophic environments for bio-manipulation (Ke et al. Citation2008; Chen et al. Citation2011). Ke et al. (Citation2008) cultured silver and bighead carps in large fish pens to reduce the risks of cyanobacterial bloom outbreaks in Meiliang Bay, Lake Taihu; Both carps fed mainly on zooplankton (>50%) in 2004 when competition was low; they selected more phytoplankton in 2005 when competition was high; silver carp had a boarder diet breadth than did bighead carp. Chen et al. (Citation2011) pointed out that the degree of the niche overlap between silver carp and bighead carp varied according to the trophic states; phytoplankton is the dominant dietary component for silver carp in the eutrophic Moyangjiang River. Actually, in oligotrophic or meso-eutrophic environments with fewer amounts of food resources, carps tend to prefer smaller food sizes.
Trophic niche partitioning
Carbon isotopes are typically used to identify the energy flow from resources to consumers (Fry Citation1991; Gu et al. Citation1994). Our results showed that the difference in δ13C between SC and BC was smaller than expected in the food resource (0.8‰) in one trophic level, indicating that these filter-feeding fishes shared similar food sources from the pelagic food web (Post Citation2002). However, compared to BC, SC was depleted in δ13C by 0.69‰ in the Nanwan Reservoir, yet it was enriched by 0.5‰ in the Nianyushan Reservoir, reflecting the differential fractionation during the uptake of dissolved inorganic carbon between the two reservoirs.
Nitrogen isotopes are useful in defining trophic levels (Montoya et al. Citation1990; Toda and Wada Citation1990; Wada et al. Citation1991; Gu et al. Citation1994). In our study, the mean value of δ15N of BC was 1.63‰ higher than of SC in the Nanwan Reservoir and was 1.36 ‰ higher than that of SC in the Nianyushan Reservoir, which suggests that BC selectively fed on an isotopically heavier portion of the food resources than the SC in the both reservoirs. The evidence from estimated proportional contributions of food sources also supported this conclusion. Relative to SC, BC fed more on cPOM or zooplankton, which was isotopically heavier than that of fPOM.
Resources utilization and coexistence
Trophic niche overlap can be used to predict the pressure of resource utilization (Chase and Leibold Citation2003; Corrêa et al. Citation2011). Our results indicated that both carp species remained in similar trophic positions but had different niche overlaps between the two reservoirs. BC occupied a larger isotopic niche overlap (62.2%) in the Nianyushan Reservoir than in the Nanwan Reservoir (23.1%), which indicates that the BC had stronger pressure from resources utilization in the Nianyushan Reservoir. Actually, the low standing stock of zooplankton in the Nianyushan Reservoir inferred that predation pressure from fish to zooplankton was stronger. Under intense resource completion, it is possible that BC shifted its food resources from larger particles like zooplankton to smaller cPOM, leading to a larger niche overlap. Previous literatures also have pointed out that when zooplankton availability decreased, energy reliance could be shifted from zooplankton to phytoplankton or detritus (Gu et al. Citation1996b; Xu and Xie Citation2004, Zhou et al. Citation2009).
Although both species utilize the suspending particle resources, they can coexist by regulating their proportions of these particles and the trophic level. Jayasinghe et al. (Citation2015) pointed out that co-occurring SC and BC showed similar food preference but a different isotopic niche overlap in different lakes with variation of resource availability. In our study, we found that in order to coexist, BC occupied a larger isotopic niche overlap in the Nianyushan Reservoir in our study, possibly because they had to live when differences in relative survival ability were small. Bulleri et al. (Citation2016) also found that for two species with small differences in survival ability, greater niche overlapping due to facilitation (i.e. reduced niche differences) may not cause competitive exclusion.
Trophic niche breadth and fish stocking ratio
Niche breadth is an important concept for understanding adaptation and is relevant to many ecological issues, including niche evolution and ecological specialization (Sexton et al. Citation2017). Available literatures suggested that the niche breadths of the two carp species were always compared within a single water body (Radke and Kahl Citation2002; Papoulias et al. Citation2006; Chen et al. 2007). We compared two deep mesotrophic reservoirs where fish freely foraged within closed geographical regions and in the same time scale. Our results showed that the niche breadth represented by SEAc for SC became wider in the Nianyushan Reservoir. We hypothesized that the increased biomass stocking of the SC:BC ratio was responsible for this result, suggesting that the silver carp could become more competitive with a higher biomass ratio. Rocha et al. (2018) also found that the local abundance was strongly correlated to niche breadth, and species with high abundance could consume widespread resources and occupy a wide niche breadth. However, little studies using stable isotopes have compared the different responses to stocking fish ratio in freshwater ecosystems. Additional data of trophic niche and overlap under different stocking ratio conditions between the two fish are needed to verify this hypothesis. This study provides important insights into the trophic niches of the two major carps. According to our results, we propose that SC:BC ratio is meaningful in resource utilization and particle size to some extent.
Notes on contributors
Man Zhang has a PhD degree in Freshwater ecology from the Jinan University. She is broadly interested in aquatic and fish ecology, food web processes, nutrient cycling and water management.
Yifan Wang is a master student of Freshwater Ecology in the Department of Fisheries at the Henan Normal University.
Binhe Gu is a professor of Isotopical Ecology in the Soil and Water Sciences Department, University of Florida.
Yuncong Li is a professor of Water and Soil in the Tropical Research and Education Center, University of Florida.
Weixia Zhu is an engineer in Zhengzhou Customs of the People’s Republic of China.
Li Zhang is an engineer in Zhengzhou Customs of the People’s Republic of China.
Liping Yang is an associate professor of Freshwater Ecology in the Department of Fisheries at the Henan Normal University.
Xuejun Li is a professor of Aquiculture in the Department of Fisheries at the Henan Normal University.
Acknowledgements
We appreciate the administrations of the Nanwan and Nianyushan reservoirs. We are also grateful to Ruiliang Wang from Luohe City for helping us with the field work.
Disclosure statement
No potential conflict of interest was reported by the authors.
Funding
This work was funded by the National Natural Science Foundation of China under Grant numbers (31400397 and U1504304), Foundation of He’nan Science and Technology Department under Grant number (172102210345) and Doctor Startup Foundation of Henan Normal University under Grant number (01346500103).
References
- American Public Health Association (APHA). 1989. Standard methods for the examination of water and wastewater. Washington, DC: American Water Works Association and Water Pollution Control Federation Publisher.
- Bulleri F, Bruno JF, Silliman BR, Stachowicz JJ. 2016. Facilitation and the niche: implications for coexistence, range shifts and ecosystem functioning. Funct Ecol. 30(1):70–78.
- Chase JM, Leibold M. 2003. Ecological niches: linking classical and contemporary approaches. Chicago (IL): University of Chicago.
- Chen G, Wu Z, Gu B, Liu D, Li X, Wang Y. 2011. Isotopic niche overlap of two planktivorous fish in southern China. Limnology. 12(2):151–155.
- Chen P, Wiley E, Mcnyset KM. 2007. Ecological niche modeling as a predictive tool: silver and bighead carps in North America. Biol Invasions. 9(1):43–51.
- Corrêa CE, Albrecht MP, Hahn NS. 2011. Patterns of niche breadth and feeding overlap of the fish fauna in the seasonal Brazilian Pantanal, Cuiabá River basin. Neotrop Ichthyol. 9(3):637–646.
- Cremer MC, Smitherman RO. 1980. Food habits and growth of silver and bighead carp in cages and ponds. Aquaculture. 20(1):57–64.
- Dick EJ, MacCall AD. 2011. Depletion-based stock reduction analysis: a catch-based method for determining sustainable yields for data-poor fish stocks. Fish Res. 110(2):331–341.
- Dumont HJ, Van de Velde I, Dumont S. 1975. The dry weight estimate of biomass in a selection of cladocera, copepod and rotifera from the plankton, periphyton and benthos of continental waters. Oecologia. 19(1):75–97.
- Fisheries and Aquaculture Department (US). 2012. The state of world fisheries and aquaculture 2012. Rome (Italy): Food and Agriculture Organization of the United Nations.
- Fry B. 1991. Stable isotope diagrams of freshwater food webs. Ecology. 72(6):2293–2297.
- Gu B, Schell DM, Alexander V. 1994. Stable carbon and nitrogen isotopic analysis of the plankton food web in a subarctic lake. Can J Fish Aquat Sci. 51(6):1338–1344.
- Gu B, Schell DM, Huang X, Yie F. 1996a. Stable isotope evidence for dietary overlap between two planktivorous fishes in aquaculture ponds. Can J Fish Aquat Sci. 53(12):2814–2818.
- Gu B, Schelske CL, Hoyer MV. 1996b. Stable isotope of carbon and nitrogen as an indicators of diet and trophic structure of the fish community in a shallow hypereutrophic lake. J Fish Biol. 49(6):1233–1243.
- Gu B, Schelske CL, Hoyer MV. 1997. Intrapopulation feeding diversity in blue tilapia: evidence from stable-isotope analyses. Ecology. 78(7):2263–2266.
- Guo LG, Wang Q, Xie P, Tao M, Zhang J, Niu Y, Ma ZM. 2015. A non-classical biomanipulation experiment in Gonghu Bay of Lake Taihu: control of Microcystis blooms using silver and bighead carp. Aquacult Res. 46(9):2211–2224.
- Han BP. 2010. Reservoir ecology and limnology in China: a retrospective comment. J Lake Sci. 22:151–160. (in Chinese)
- Irons KS, Sass GG, McClelland MA, Stafford JD. 2007. Reduced condition factor of two native fish species coincident with invasion of non-native Asian carps in the Illinois River, USA. Is this evidence for competition and reduced fitness? J Fish Biol. 71:258–273.
- Jackson AL, Inger R, Parnell AC, Bearhop S. 2011. Comparing isotopic niche widths among and within communities: SIBER—stable isotope Bayesian ellipses in R. J Anim Ecol. 80(3):595–602.
- Jayasinghe UAD, García-Berthou E, Li Z, Li W, Zhang T, Liu J. 2015. Co-occurring bighead and silver carps show similar food preference but different isotopic niche overlap in different lakes. Environ Biol Fish. 98(4):1185–1199.
- Ke Z, Xie P, Guo L. 2008. In situ study on effect of food competition on diet shifts and growth of silver and bighead carps in large biomanipulation fish pens in Meiliang Bay, Lake Taihu. J Appl Ichthyol. 24(3):263–268.
- Kolar CS, Chapman DC, Courtenay WR, Housel CM, Williams JD, Jennings DP. 2005. Asian Carps of the Genus Hypophthalmichthys (Pisces, Cyprinidae) — a biological synopsis and environmental risk assessment. Bethesda (MD): American Fisheries Society Special Publication 33.
- Lazzaro X. 1987. A review of planktivorous fishes: their evolution, feeding behaviors, selectivities, and impacts. Hydrobiologia. 146(2):97–167.
- Li K, Xu Z, Liu Z, Gu B. 2013. Stable isotope enrichment, dietary sources and trophic overlap between silver carp (Hypophthalmichthys molitrix) and bighead carp (Aristichthys nobilis). Aquaculture. 402–403:8–12.
- Loeuille N, Loreau M. 2004. Nutrient enrichment and food chains: can evolution buffer top-down control? Theor Popul Biol. 65(3):285–298.
- McCann K, Hastings A. 1997. Re-evaluating the omnivory–stability relationship in food webs. P Roy Soc B-Biol Sci. 264(1385):1249–1254.
- Montoya JP, Horrigan SG, McCarthy JJ. 1990. Natural abundance of 15N in particulate nitrogen and zooplankton in the Chesapeake Bay. Mar Ecol Prog Ser. 65:35–61.
- Newsome SD, del Rio CM, Bearhop S, Phillips DL. 2007. A niche for isotopic ecology. Front Ecol and Environ. 5(8):429–436.
- Papoulias DM, Chapman D, Tillitt DE. 2006. Reproductive condition and occurrence of intersex in bighead carp and silver carp in the Missouri River. Hydrobiologia. 571(1):355–360.
- Parnell AC, Inger R, Bearhop S, Jackson AL. 2010. Source partitioning using stable isotopes: coping with too much variation. PLoS One. 5(3):1–5.
- Parnell AC, Jackson AL. 2013. Siar: stable isotope analysis in R. R package version 4.2. http://CRAN.R-project.org/package=siar
- Post DM. 2002. Using stable isotopes to estimate trophic position: models, methods, and assumptions. Ecology. 83(3):703–718.
- Radke RJ, Kahl U. 2002. Effects of a filter-feeding fish [silver carp, Hypophthalmichthys molitrix (Val.)] on phyto- and zooplankton in a mesotrophic reservoir: results from an enclosure experiment. Freshwater Biol. 47(12):2337–2344.
- Rocha MP, Bini LM, Siqueira T, Hjort J, Grönroos M, Lindholm M, Karjalainen SM, Heino J. 2018. Predicting occupancy and abundance by niche position, niche breadth and body size in stream organisms. Oecologia. 186(1):205–216.
- Sexton JP, Montiel J, Shay JE, Stephens MR, Slatyer RA. 2017. Evolution of ecological niche breadth. Annu Rev Ecol Evol Syst. 48(1):183–206.
- Spataru P, Gophen M. 1985. Feeding behaviour of silver carp Hypophthalmichthys molitrix Val. and its impact on the food web in Lake Kinneret, Israel. Hydrobiologia. 120(1):53–61.
- Thompson RM, Hemberg M, Starzomski BM, Shurin JB. 2007. Trophic levels and trophic tangles: the prevalence of omnivory in real food webs. Ecology. 88(3):612–617.
- Toda H, Wada E. 1990. Use of 15N/14N ratios to evaluate the food source of the mysid, Neomysis intermedia Czerniawsky, in a eutrophic lake in Japan. Hydrobiologia. 194(1):85–90.
- Vadeboncoeur Y, McCann KS, Vander Zanden MJ, Rasmussen JB. 2005. Effects of multi-chain omnivory on the strength of trophic control in lakes. Ecosystems. 8(6):682–693.
- Vörös L, Oldal I, Présing M, Balogh KV. 1997. Size-selective filtration and taxon-specific digestion of plankton algae by silver carp (Hypophthalmichthys molitrix Val.). Hydrobiologia. 342/343:223–228.
- Wada E, Mizutani H, Minagawa M. 1991. The use of stable isotopes for food web analysis. Crit Rev Food Sci Nutr. 30(4):361–371.
- Xie P. 1999. Gut contents of silver carp, Hypophthalmichthys molitrix, and the disruption of a centric diatom, Cyclotella, on passage through the esophagus and intestine. Aquaculture. 180(3-4):295–305.
- Xu J, Wen Z, Gong Z, Zhang M, Xie P, Hansson L-A. 2012. Seasonal trophic niche shift and cascading effect of a generalist predator fish. PLoS One. 7(12):1–9.
- Xu J, Xie P. 2004. Studies on the food web structure of Lake Donghu using stable carbon and nitrogen isotope ratios. J Freshwater Ecol. 19(4):645–650.
- Yao X, Huang G, Xie P, Xu J. 2016. Trophic niche differences between coexisting omnivores silver carp and bighead carp in a pelagic food web. Ecol Res. 31(6):831–839.
- Zhang M, Xiong JD, Zhao HP, Li XJ, Dong J, Cheng JM, Zhao YX. 2015. Response of phytoplankton to silver carp, Hypophthalmichthys molitrix (Val.), stocking under phosphorus fertilization: a case study in a large reservoir in central China. J Freshwater Ecol. 30(4):543–555.
- Zhang ZS, Huang XF. 1991. Plankton researches in freshwater. Beijing (China): Science Press. (in Chinese)
- Zhou Q, Xie P, Xu J, Ke Z, Guo L. 2009. Growth and food availability of silver and bighead carps: evidence from stable isotope and gut content analysis. Aquacult Res. 40(14):1616–1625.