
Abstract
In this study, we first evaluated the genetic effects of the stock enhancement program of silver carp (Hypophthalmichthys molitrix) on wild populations in the middle Yangtze River using the sequences of the mitochondrial Cytochrome b gene and control region (D-loop). 129 cytb individuals and 135 D-loop individuals were sequenced successfully, and the results obtained by two markers were similar. T test results showed that there was no significant difference in haplotype diversity (Hd) values and nucleotide diversity (Pi) values before and after release. The exact test result of population differentiation based on haplotype frequencies was consistent with no significant change in haplotype frequency after release. Pairwise genetic differentiation index (FST) and gene flow (Nm) revealed no genetic differentiation among four populations. Results of the Bayesian clustering analysis performed with STRUCTURE and analysis of molecular variance (AMOVA) confirmed that the genetic component did not change after release. In summary, there was no significant genetic effect of broodstock enhancement of silver carp on wild populations in the middle Yangtze River.
Introduction
Silver carp (Hypophthalmichthys molitrix), belongs to Cypriniformes (Cyprinidae/Hypophthalmichthyinae). It is one of the four major Chinese carp species, together with bighead carp (Aristichthys nobilis), grass carp (Ctenopharyngodon della), and black carp (Mylopharyngodon piceus) (Li et al. Citation1998). Silver carp is loved by consumers because of its fast growth and delicious meat. It has become the largest freshwater fish in China and in the entire world and is an important species in fishery production in China (Yu et al. Citation2010). Silver carp is distributed in then main rivers of China, being most abundant in the Yangtze River. The middle reaches of the Yangtze River are the main spawning grounds (Yujun and Shihua Citation2011). In the 1980s, silver carp biological resources were very abundant, but due to overfishing, blind inbreeding, and habitat destruction, germplasm resources of silver carp have experienced a serious degradation (Ye et al. Citation2017; Chen et al. Citation2018). Therefore, protecting the germplasm resources of silver carp in the middle Yangtze River is of great significance to the sustainable development of freshwater fishery in China.
Different methods have been implemented to restore the abundance of silver carp in the middle Yangtze River (Du et al. Citation2014). Stock enhancement programs seek to restore the natural population of fish (Masuda and Tsukamoto Citation1998), through delivery of fry (obtained by artificial breeding or by natural seed resources) into public water bodies. Considering that there are many negative effects with juveniles releasing (St⊘ttrup et al. Citation2002; Sánchez-Lamadrid Citation2004; Romo et al. Citation2006), a large-scale broodstock enhancement program for the four major Chinese carps has been conducted in the Sanzhou section of the Yangtze River since 2010 (Li et al. Citation2014; Ji et al. Citation2018). The broodstocks were provided by the National Original Breeding Farm located in Jianli County and Shishou County, where fry captured from Yangtze River were cultured to maturity.
Studies have shown that stock enhancement can restore fishery resources, however, it can also constitute a risk to the genetic diversity and genetic structure on the wild populations, or even to the structure and function of the ecosystem (Eby et al. Citation2006; Lorenzen et al. Citation2012; Blanco et al. Citation2015). Besides, studies have shown that there is no significant difference in the heredity of silver carp wild populations in the middle Yangtze River (Zhang et al. Citation2001; Chen et al. Citation2018), silver carp are free swimming in water and produce drifting eggs, gene exchange was frequently among populations. Thus, the genetic impact of this release on wild populations in middle Yangtze River has become a problem of great interest, because of the numerous broodstocks with high fecundity that have been continuously released into the Yangtze River. Moreover, the in-depth study of genetic structure and genetic diversity is the basis for scientific planning of resources protection and development.
In recent years, there have been studies about the genetic impact of stock enhancement of the four major Chinese carp broodstocks on wild populations. After analysis of mitochondrial cytb and D-loop sequences, Li et al. (Citation2014) found that, in 2011–2012, grass carp broodstocks enhancement had no evident effect on the genetic structure of wild populations of grass carp. Ji et al. (Citation2018) reported similar findings that grass carp broodstocks released in 2011 to 2015 had no significant effect on the genetic variation of the wild population, using analysis of 13 microsatellite loci. It is very important to study the effects of stock enhancement activities on the heredity of wild populations. It can provide data basis for the evaluation of activities and guide the optimization of releasing strategies. However, little information on silver carp in this respect is reported. Therefore, silver carp was used as the research object in this study to assess the genetic effects of broodstock enhancement programs of silver carp in middle Yangtze River on wild populations.
Materials and methods
Sample collection and DNA extraction
Silver carp specimens from four wild populations were bought from fishermen during the fishery resources survey both before and after release of stock and caudal fin sections were removed for analysis (). All the samples were preserved in absolute ethyl alcohol for DNA extraction. Detailed information regarding each sampled population has been shown in . Total genomic DNA was extracted from caudal fin following the improved procedure of Aljanabi (Aljanabi and Martinez Citation1997) and stored at −20 °C until analysis.
Figure 1. Map showing the sampling sites of silver carp (Hypophthalmichthys molitrix).
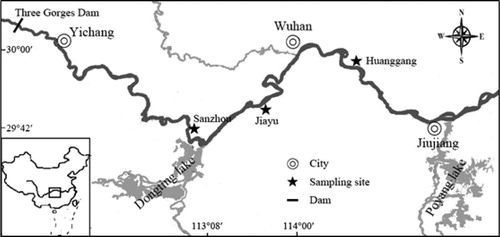
Table 1. Sampling details and genetic diversity indices of the silver carp populations. N-Sample size, S-No.of polymorphic sites, Hd-Haplotype diversity, Pi-Nucleotide diversity, HN-No. of haplotypes.
Polymerase chain reaction (PCR) amplification and DNA sequencing
PCRs were conducted using two primers for two regions of mtDNA: the Cytochrome b gene (cytb) using universal primers L14724, 5′-GACTTGAAAAACCACCGTTG-3′ and H15915, 5′ -CTCCGATCTCCGGATTACAAGAC-3′ (Okazaki et al. Citation1999); and D-loop (non-coding) control region MitDI-F, 5-CACCCYTRRCTCCCAAAGCYA-3′ and MitDI-R, 5′-GGTGCGGRKACTTGCATGTRTAA-3′ (Chen et al. Citation2016). PCR amplification was performed with 10 × PCR Buffer, containing 5 µL, 2.0 U Taq DNA polymerase, 0.1 mM dNTPs, 2 µM of each primer, 60 ng·µL−1 DNA template, and sterile deionized water, in a final volume of 50 µL. PCR cycling was performed using an amplification conditions as follows: 94 °C for 5 min (initial denaturation), 94 °C for 30 s (denaturation); 35 cycles of 55 °C for 30 s (annealing), and 72 °C for 1 min (extension), followed by a last extension step at 72 °C for 8 min. Samples were stored at 4 °C. The PCR amplification products were examined on ethidium bromide-stained 1.0% agarose gel under UV rays. Successful PCR amplifications products were bi-directionally sequenced at Beijing Tianyi Huiyuan Bioscience & Technology Inc. (Beijing, China).
Sequence alignment and statistical analysis
Lasergene software package (version 7.2.1; Dnastar, Inc.) was used to assemble, splice and proofread the cytb sequences of silver carp. Clustal W (Thompson et al. Citation1997) software was used to carry out multiple alignments. MEGA 5 software (Tamura et al. Citation2011) was used to analyze the base ratio of sequences. The polymorphic loci (S), the number of haplotypes (HN), the haplotype diversity index (Hd), the nucleotide diversity index (Pi), and gene flow (Nm) were calculated using DnaSP V3 (Rozas & Rozas Citation1999). In addition, to analyze the evolutionary relationship between haplotypes, a haplotype network structure map was built with Network software (Bandelt et al. Citation1999) using the median-joining method. The pairwise genetic differentiation index (FST) were computed using the program Arlequin ver 3.1 (Excoffier et al. Citation1992) with the haplotype frequencies through a displacement test with 1,023 repetitions. The analysis of molecular variance (AMOVA) was performed to evaluate whether genetic differentiation present within populations and among populations. The exact test of population differentiation based on haplotype frequencies was conducted in Arlequin using the Markov chain procedure (1,000 dememorizations, 10,000 steps in Markov chain). In order to make a significant test of the genetic diversity data, T test was performed with SPSS (Plume Citation2003).
The genetic component among populations was examined by cluster techniques based on the Bayesian method, using STRUCTURE v2.2 (Pritchard et al. Citation2000). For each value of K (K = 2–4), ten runs were implemented with a burn of 200,000 in length, followed by 1200,000 Markov chain Monte Carlo iterations, to obtain the standard deviation needed to calculate △K (Evanno et al. Citation2005), which was used to identify the appropriate number of clusters. The optimal K values were selected by STRUCTURE HARVESTER (http://taylor0.biology.ucla.edu/structureHarvester/).
Results
Genetic diversity
Sequence fragment lengths of the cytb and D-loop amplified of the mtDNA genome in the four analyzed silver carp populations were 956 and 881 bp, respectively. Genetic diversity indicators including number of polymorphic sites (S), haplotype diversity (Hd), number of haplotypes (HN) and nucleotide diversity (Pi) were presented in . The haplotype diversity (Hd) and nucleotide diversity (Pi) in terms of cytb sequences ranged from 0.611 in JY population to 0.754 in HG population, and 0.00173 in JY population to 0.00345 in 10SZ population, respectively. The haplotype diversity (Hd) and nucleotide diversity (Pi) in terms of D-loop sequences ranged from 0.817 in 16SZ population to 0.906 in JY population, and 0.00791 in JY population to 0.00958 in HG population respectively. Compared with the high haplotype diversity (Hd) value, the nucleotide diversity (Pi) was very low. In addition, the haplotype number in terms of cytb sequences and D-loop sequences ranged from 7 in 16SZ population to 11 in 10SZ population, and 14 in 16SZ population to 22 in HG population respectively. t-test results showed that there was no significant difference in Hd values and Pi values before and after release in terms of cytb sequences and D-loop sequences respectively (PHd-cytb=0.983, PHd-D-loop=0.417; PPi-cytb=0.108, PPi-D-loop=0.924).
Haplotype distribution and phylogenetic relationships
A total of 19 haplotypes (Hap_1–Hap_19) were defined in the 129 cytb sequences and a total of 40 haplotypes (H_1–H_40) were defined in the 135 D-loop sequences (). Phylogenetic network of the haplotypes was identified using the median-joining algorithm for haplotypes to further depict the phylogenetic and geographical relationships among haplotypes (). Hap-1, Hap-3, and H-7 were present in all four populations, and were surrounded by other minor haplotypes with a star-like pattern. The frequency of them was all high and they were considered ancestral haplotype. The null hypothesis of random distribution of individuals between pairs of populations was accepted except for 16SZ-JY (0.01 < P < 0.05); the null hypothesis also was accepted after sequential Bonferroni correction (P > 0.01) ().
Figure 2. Haplotype network showing haplotype connections and distribution based on the cytb haplotypes (A) and D-loop haplotypes (B) of silver carp populations. Circles represent different haplotypes with relative size proportionate to its observed frequency. Colors correspond to different populations (Blue: 10SZ population; Orange: 16SZ population; Green: HG population; Pink: JY population). The number labels represent haplotypes names.
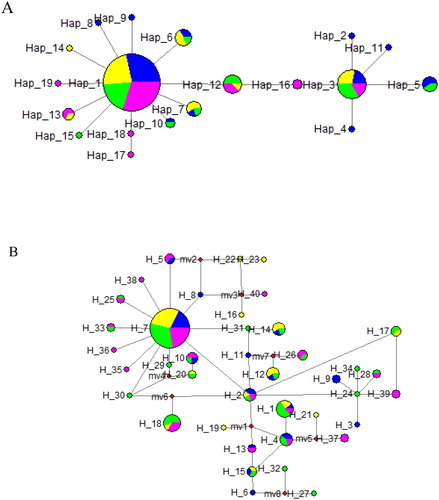
Table 2. Number of shared haplotypes, P-values of the exact test for haplotypes frequency homogeneity (ET-P), posterior means of pairwise FST and 95% credible intervals (C.I.) for pairwise comparisons of silver carp samples, pairwise Nm.
Population genetic structure analysis
Pairwise FST values and Nm values were estimated to assess the population genetic structure of silver carp among the four populations (). As shown in , the FST value between HG and JY in terms of cytb sequences was the highest (FST = 0.03303, P > 0.05), while the FST value between 10SZ and HG in terms of cytb sequences was the lowest (FST = −0.02326, P > 0.05). Pairwise Nm values among four populations of silver carp ranged from −79.16 to 250.65.
The genetic component results obtained by the program STRUCTURE indicated the highest ΔK value were all obtained for K = 3 (). No obvious clustering trends were observed among 10SZ and other three populations with two markers, which were supported by results performed with AMOVA (FCT-cytb = −0.00254, P = 0.761, FSC-cytb=0.00851, P = 0.190; FCT-D-loop = −0.00064, P = 0.748, FSC-D-loop = −0.00703, P = 0.606). The AMOVA analysis revealed that the vast majority of the genetic variation occurred within populations (), and the FST values indicated no population differentiation was found in four populations.
Figure 3. Result of the STRUCTURE analysis (A: cytb; B: D-loop) based on Bayesian clustering of four silver carp populations. Here, we show results of K = 3.
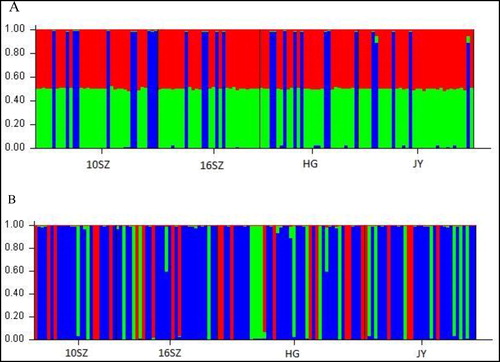
Table 3. Analysis of AMOVA for silver carp based on cytb and D-loop.
Discussion
Generally speaking, the number of distinct haplotypes, haplotype diversity (Hd) and nucleotide diversity (Pi) represent the standard indices of genetic diversity. In this study, the genetic variability of the mtDNA cytb and D-loop of the four silver carp populations was characterized with high haplotype diversity and low nucleotide diversity, which was often observed in other animals like Baylisascaris schroederi (Zhou et al. Citation2013), Coptodon zillii (Soliman et al. Citation2017) and Hungarian Gidran horse (Nikolett et al. Citation2016). After 6 years of release, both Hd values and Pi values obtained with two markers changed, but the results of the t-test confirmed that the change was not statistically significant. The results showed that the genetic diversity of the three silver carp populations in the middle reaches of the Yangtze River after release is higher than that of the Ganjiang River population (D-loop: Hd = 0.727, Pi = 0.008, 935 bp) (Chen et al. Citation2013), but lower than that of the silver carp population (D-loop: Hd = 0.920, Pi = 0.011) (Katamachi et al. Citation2011) from the Tone River basin (Japan), which was in line with the results of other studies (Chen et al. Citation2018). To summarize, the broodstock enhancement program of silver carp in Yangtze River has no significant effects on wild population in terms of genetic diversity.
The pairwise FST and Nm among four populations of silver carp are all shown in . There are many indicators to measure the population differentiation extent in population genetics, and the most commonly used index is FST, as genetic drift is thought to be the key factor that leads to genetic differentiation. According to Rousset (Citation1997), there is no obvious genetic differentiation among populations, which is a low differentiation level, when the value of FST is 0–0.05. Gene flow can homogenize the genetic structure of the population. The higher level of gene flow among populations indicates that there are relatively more gene exchanges among the individuals in the population, the smaller the genetic differentiation between populations. According to the study of Whitlock and Mccauley (Citation1999), Nm > 4 showed frequent genetic exchanges among groups, the homogenization effect of genetic material could completely offset genetic differentiation due to genetic drift and so on, so that genetic differentiation among populations could not reach the level of differentiation. In this study, based on the results of pairwise FST and Nm, which was consistent with other research results before release (Zhang et al. Citation2001), there was no obvious genetic differentiation among three populations of silver carp (FST < 0.05, P > 0.05; Nm > 4) after release. Therefore, broodstock enhancement of silver carp in Yangtze River has no genetic effect on wild population in terms of pairwise FST and Nm.
Generally, network is better for representing genealogical relationships at a population level than other phylogenetic methods, and it takes account of several features, including the persistence of ancestral haplotypes, the existence of multiple descendant haplotypes and low levels of genetic variation (Wu et al. Citation2009). Here, the haplotype network analysis indicated that the Hap-1, Hap-3 and H-7 were the most ancient haplotypes (), for ancient haplotypes often had a high frequency and displayed a trend towards a widespread geographic distribution as previously reported (Posada and Crandall Citation2001). With 2 and 1 major haplotypes shared by all four populations of silver carp and surrounded by many minor haplotypes in a star-like pattern respectively, both haplotype networks with two markers couldn’t reveal a clear spatial pattern. In addition, the exact test result of population differentiation based on haplotype frequencies supported that there was no significant change in haplotype frequency before and after release. Hence, broodstock enhancement of silver carp in Yangtze River has no genetic effect on wild population in terms of haplotype distribution and haplotype frequency.
Population structure refers to the composition of population members, which is a key factor to be considered in genetic analysis. Results of the Bayesian clustering analysis performed with STRUCTURE revealed the existence of no significant population structure change in four populations. It seen that the AMOVA analysis results were in agreement that the population genetic structure of silver carp after released was not changed.
In our study, the 129 cytb sequences and 135 D-loop sequences were sequenced and first clear demonstrated that the broodstock enhancement program of silver carp in middle Yangtze River has no significant genetic effect on wild populations. However, genetic variation has an accumulating process. When accumulation reaches a certain level, the variation may affect the genetic structure, population differentiation and even species evolution of the species (Hopper and Gioia Citation2004; Qiang et al. Citation2014). Besides, founder effect, bottleneck, population subdivision and inbreeding may contribute to the observed low genetic diversity (Parisod et al. Citation2005), and the events require a long time of accumulate to achieve. As the enhancement activities continue to expand, it is necessary to monitor the influence of enhancement program on wild population for long term, and the present study may serve as an important preliminary scientific data for future studies.
Funding
This study was supported by National Key R&D Program of China (2018YFD0900903).
Ethical approval
All applicable international, national, and/or institutional guidelines for the care and use of animals were followed by the authors.
Notes on contributors
Huijuan Chen is a PhD researcher in College of Animal Science and Technology, Southwest University, but doing graduation experiment in Yangtze River Fisheries Research Institute, Chinese Academy of Fishery Sciences.
Dengqiang Wang is an associate researcher in Yangtze River Fisheries Research Institute, Chinese Academy of Fishery Sciences with research interests in population genetic structure and genetic diversity.
Jie Guo is a PhD researcher in Wuxi Fisheries College NAU with research interests in fish environmental assessment in the middle reaches of the Yangtze River.
Xinbin Duan is a researcher in Yangtze River Fisheries Research Institute, Chinese Academy of Fishery Sciences with research interests in conservation of fishes in the Yangtze River.
Shaoping Liu is a researcher in Yangtze River Fisheries Research Institute, Chinese Academy of Fishery Sciences with research interests in fishery resources of the four major Chinese carps in the middle reaches of the Yangtze River.
Daqing Chen is a researcher in Yangtze River Fisheries Research Institute, Chinese Academy of Fishery Sciences, the leader of the broodstock enhancement of silver carp.
Yun Li is a professor in College of Animal Science and Technology, Southwest University with research interests in stock enhancement of the four major Chinese carps.
Disclosure Statement
The authors declare that they have no conflict of interest.
References
- Aljanabi SM, Martinez I. 1997. Universal and rapid salt-extraction of high quality genomic DNA for PCR-based techniques. Nucleic Acids Res. 25(22):4692–4693.
- Bandelt HJ, Forster P, Röhl A. 1999. Median-joining networks for inferring intraspecific phylogenies. Mol Biol Evol. 16(1):37–48.
- Blanco GE, Aritaki M, Knutsen H, Taniguchi N. 2015. Effects of large-scale releases on the genetic structure of Red Sea Bream (Pagrus major, Temminck et Schlegel) populations in Japan. PLoS One. 10:e125743.
- Chen HJ, Liu MD, Wang DQ, Dong WW, Hao LV, Chen DQ, Yun LI. 2018. Analysis of the genetic diversity for 4 Hypophthalmichthys molitrix populations from middle and upper Yangtze River. Freshw Fish. 48(1): 20–25.
- Chen HJ, Wang DQ, Duan XB, Chen DQ, Liu SP, Yun LI. 2016. Genetic diversity of White bream, Parabramis pekinensis from the Middle Yangtze River. Chin J Ecol. 35(8):2175–2181.
- Chen W, Zhang Y, Duan X, Xu X, Wang D. 2013. Genetic diversity analysis of Hypophthal michthys molitrix between wild and stock enhancement based on mitochondrial control region sequences in the Poyang Lake Water System. Chin Agric Sci Bull. 29:89–95.
- Posada D, Crandall KA. 2001. Intraspecific gene genealogies: trees grafting into networks. Trends Evol (Amst). 16(1):37–45.
- Du J, Ye G, Chen B, Zheng X. 2014. Changes in the marine trophic index of Chinese marine area. Biodivers Sci. 22:532.
- Eby LA, Roach WJ, Crowder LB, Stanford JA. 2006. Effects of stocking-up freshwater food webs. Trends Evol (Amst). 21(10):576–584.
- Evanno G, Regnaut S, Goudet J. 2005. Detecting the number of clusters of individuals using the software structure: a simulation study. Mol Ecol. 14(8):2611–2620.
- Excoffier L, Smouse PE, Quattro JM. 1992. Analysis of molecular variance inferred from metric distances among DNA haplotypes: application to human mitochondrial DNA restriction data. Genetics. 131(2):479–491.
- Hopper SD, Gioia P. 2004. THE Southwest Australian Floristic Region: evolution and Conservation of a Global Hot Spot of Biodiversity. Annu Rev Ecol Evol Syst. 35:623–650.
- Ji XF, Duan XB, Liu SP, Chen DQ, Wang DQ. 2018. Genetic effect of released brood grass carp(Ctenopharyngodon idella) on wild population in the Yangtze River inferred from microsatellite markers. J Fish China. 42(1):10–17.
- Katamachi D, Ikeda M, Dong S, Taniguchi N. 2011. Genetic variability of silver carp Hypophthalmichthys molitrix population introduced into the Tone River basin, Japan assessed by mtDNA analysis. Nippon Suisan Gakkaishi. 77(1):31–39.
- Li S, Lu G, Bernatchez L. 1998. Diversity of mitochondrial DNA in the populations of silver carp, bighead carp, grass carp and black carp in the middle- and lower reaches of the Yangtze River. Acta Zool Sin. 44:82–93.
- Li SH, Chen DQ, Duan XB, Liu SP, Wang DQ. 2014. Genetic effects of released mature Ctenopharyngodon idellus on natural populations based on the mitochondrial DNA markers in the middle reaches of the Yangtze River. Freshw Fish. 3:45–50.
- Lorenzen K, Beveridge MC, Mangel M. 2012. Cultured fish: integrative biology and management of domestication and interactions with wild fish. Biol Rev Camb Philos Soc. 87(3):639–660.
- Masuda R, Tsukamoto K. 1998. Stock Enhancement in Japan: review and perspective. Bull Mar Sci. 62:337–358.
- Nikolett S, Sándor M, András J, Szilvia K. 2016. Genetic diversity of the Hungarian Gidran horse in two mitochondrial DNA markers. PEERJ. 4:e1894.
- Okazaki T, Jeon SR, Watanabe M, Kitagawa T. 1999. Genetic Relationships of Japanese and Korean Bagrid Catfishes Inferred from Mitochondrial DNA Analysis. Andrologia. 18:570–573.
- Parisod C, Trippi C, Galland N. 2005. Genetic variability and founder effect in the pitcher plant Sarracenia purpurea (Sarraceniaceae) in populations introduced into Switzerland: from inbreeding to invasion. Ann Bot. 95(2):277–286.
- Plume ML. 2003. SPSS (Statistical Package for the Social Sciences). Encyclopedia Inf Syst. 13:187–196.
- Pritchard JK, Stephens M, Donnelly P. 2000. Inference of population structure using multilocus genotype data. Genetics. 155(2):945–959.
- Qiang LI, Zhou D, Chen X. 2014. The accumulation,decomposition and ecological effects of above-ground litter in terrestrial ecosystem. Acta Ecol Sin. 34(14):3807–3819.
- Romo OV, Suzuki S, Nakajima M, Taniguchi N. 2006. Genetic evaluation of interindividual relatedness for broodstock management of the rare species barfin flounder Verasper moseri using microsatellite DNA markers. Fish Sci. 72:33–39.
- Rousset F. 1997. Genetic differentiation and estimation of gene flow from F-statistics under isolation by distance. Genetics. 145(4):1219–1228.
- Rozas J, Rozas R. 1999. DnaSP version 3: an integrated program for molecular population genetics and molecular evolution analysis. Bioinformatics. 15(2):174–175.
- Sánchez-Lamadrid A. 2004. Effectiveness of releasing gilthead sea bream (Sparus aurata L.) for stock enhancement in the bay of Cádiz. Aquaculture. 231(1-4):135–148.
- Soliman T, Aly W, Fahim RM, Berumen ML, Jenke Kodama H, Bernardi G. 2017. Comparative population genetic structure of redbelly tilapia (Coptodon zillii (Gervais, 1848)) from three different aquatic habitats in Egypt. Ecol Evol. 7(24):11092.
- Støttrup JG, Sparrevohn CR, Modin J, Lehmann K. 2002. The use of releases of reared fish to enhance natural populations: A case study on turbot Psetta maxima (Linné, 1758). Fish Res. 59(1-2):161–180.
- Tamura K, Peterson D, Peterson N, Stecher G, Nei M, Kumar S. 2011. MEGA5: molecular evolutionary genetics analysis using maximum likelihood, evolutionary distance, and maximum parsimony methods. Mol Biol Evol. 28(10):2731.
- Thompson JD, Gibson TJ, Plewniak F, Jeanmougin F, Higgins DG. 1997. The CLUSTAL_X Windows Interface: flexible strategies for multiple sequence alignment aided by quality analysis tools. Nucleic Acids Res. 25(24):4876–4882.
- Whitlock MC, Mccauley DE. 1999. Indirect measures of gene flow and migration: FST ≠ 1/(4Nm + 1). Heredity. 82(2):117–125.
- Wu SG, Wang GT, Xi BW, Xiong F, Liu T, Nie P. 2009. Population genetic structure of the parasitic nematode Camallanus cotti inferred from DNA sequences of ITS1 rDNA and the mitochondrial COI gene. VET Parasitol. 164(2-4):248–256.
- Ye X, Tao M, Zhu G, Lin H, Chen F, Bin L. 2017. Assemblage characteristics and historical changes of fish in the xiaojiang river of the three gorge reservoir. Resour Environ Yangtze Basin. 26(6):841–846.
- Yu HX, Tang WQ, Li SF. 2010. Ontogenetic changes in meristic measurements of silver carp and bighead carp. Dong wu Xue Yan Jiu = Zool Res/"Dong wu Xue Yan Jiu" Bian ji Wei Yuan Hui Bian ji. 31:169.
- Yujun YI, Shihua LE. 2011. Habitat suitability function of four major Chinese Carps spawning sites in the Yangtze River. J Basic Sci Eng. 19:117–122.
- Zhang S, Deng H, Wang D, Yu L. 2001. Population structure and genetic diversity of silver carp and grass carp from populations of Yangtze River system revealed by rapd. Acta Hydrobiol Sin. 25:324–330.
- Zhou X, Xie Y, Zhang ZH, Wang CD, Sun Y, Gu XB, Wang SX, Peng XR, Yang GY. 2013. Analysis of the genetic diversity of the nematode parasite Baylisascaris schroederi from wild giant pandas in different mountain ranges in China. Parasite Vector. 6:1–9.