
Abstract
The aim of this study was to evaluate the co-occurrence of some frequent fecal indicator bacteria and cyanobacteria species at San Roque reservoir (SRr), highlighting the relationship between their variability and environmental factors. This study was carried out at SRr (31°22′ S, 64°27′ O) located west of the city of Cordoba, Argentina. Physico-chemical measurements and sampling for microbiological and nutrient determinations were done at three recreational sites, during seasons of major touristic activity (spring-summer), with the aim of identifying temporal patterns of microorganism variability. In addition, we carried out laboratory experiments with local isolated bacteria (Escherichia coli and Enterococcus spp.) and axenic Microcystis aeruginosa cultures to assess an association among these microorganisms and evaluate whether it was positive or negative. Our results showed an inverse relationship between cyanobacteria and thermotolerant coliform bacteria (TtC) at SRr, which was only observed when high cyanobacteria concentration occurred (≥3.4 × 10⁴ to 1.2 × 10⁶ cell.mL−1). Experimental results also showed this type of relationship: E. coli and Enterococcus spp. decreased their growth in the presence of M. aeruginosa. In addition, it was observed that the variability of main phytoplanktonic species and TtC at SRr was mainly explained by temporal patterns, that is, the seasonal changes and the hydrological year. In summary, our data indicated that cyanobacteria high abundance during bloom periods could be an inhibiting factor for bacteria growth at SRr. Moreover, we demonstrated that nutrients such us P and N are not the main factors determining the variability of studied microorganisms in this eutrophic reservoir, but other factors, such as climatic conditions (temperature and precipitations), have a major influence. This study would provide a more comprehensive view on the dynamics of microorganism populations with sanitary relevance in eutrophic reservoirs.
Introduction
The eutrophication of freshwater systems is a current problem commonly related to anthropogenic nutrient overloading (Smith and Schindler Citation2009; Lewis et al. Citation2011; Moss et al. Citation2011). Consequent with this process, increases in both the frequency and duration of cyanobacteria blooms at reservoirs and lakes have been worldwide reported (Ozawa et al. Citation2005; Bonilla et al. Citation2012; Cai and Kong Citation2013; Michalak et al. Citation2013; Paerl and Otten Citation2013; Ballot et al. Citation2014; De Souza Beghelli et al. Citation2016; Rodríguez and Ruiz Citation2016). However, several authors suggest that global warming may also promote bloom events in freshwater systems (Paerl and Huisman Citation2008; O’Neil et al. Citation2012; Steffen et al. Citation2014; Anneville et al. Citation2015). The identification of the environmental conditions that boost the growth of cyanobacteria species is essential to predict and manage the consequences of these harmful blooms. The problems caused by some cyanobacteria species are often associated not only with the toxins that they produce as secondary metabolites and the lipopolysaccharide (LPS) structures of their cells (Chorus and Bartram Citation1999; Falconer and Humpage Citation2005), but also with indirect effects, such us organic loading and oxygen decrease in sediments, mass mortality of fish, among others (Ibelings and Havens Citation2008).
Moreover, reservoirs often receive sewage discharges from direct and diffuse sources that cause pollution with bacteria (e.g. thermotolerant coliform bacteria; Wade et al. Citation2006; Staley et al. Citation2012; Soller et al. Citation2014 ). Recently, several authors demonstrated the long-term survival and potential reproduction of some fecal indicator bacteria (e.g. Escherichia coli) in tropical, subtropical and temperate environments (Craig et al. Citation2004: Ishii and Sadowsky Citation2008). Warm water temperatures and high concentrations of nutrients could be promoting factors of E. coli survival and growth outside the host (Byappanahalli et al. Citation2006; Whitman et al. Citation2006). The occurrence of both cyanobacteria and bacteria species certainly affect recreational and domestic use of reservoir water and can also impact negatively on diverse conditions of the system, for example, oxygen and light, nutrient cycling and food chain composition (Muylaert et al. Citation2002; Karjalainen et al. Citation2007; Wilhelm et al. Citation2011). Moreover, the co-occurrence of both could be synergistic, such as positive effects on bacteria because of organic substances present in cyanobacteria biofilm (Berg et al. Citation2009). This fact could benefit opportunistic bacteria such as Legionella pneumophila and Vibrio cholera (Tison et al. Citation1980; Eiler et al. Citation2007). Hence, health risk of cyanobacteria blooms could be enhanced by favoring the potential growth of bacteria, especially at reservoirs with recreational and drinking water use purposes.
However, compounds present in some cyanobacteria species (e.g. Microcystis aeruginosa) have been reported as affecting the survival and growth of some bacteria species: Aeromonas hydrophila, Bacillus subtillus, Bacillus cereus (Østensvik et al. Citation1998; Skulberg Citation2000), Pseudomonas aeruginosa, Escherichia coli and other coliforms (Bomo et al. Citation2011).
San Roque has been one of the most studied reservoirs in Argentina due to its touristic importance and because it is the main source of drinking water for Cordoba city (it supplies 70% of water for 1.5 million inhabitants). San Roque reservoir (SRr) presents an advanced eutrophic state (eutrophic to hypereutrophic) with records of recurrent cyanobacteria blooms (mainly M. aeruginosa and Dolichospermum spp.) (Rodríguez and Ruiz Citation2016). The presence of different microcystin congeners as well as anatoxins has been reported in many studies (Amé et al. Citation2003; Ruibal Conti et al. Citation2005; Ruiz et al. Citation2013). Furthermore, a high concentration of fecal indicator bacteria has been reported over the years (Rossen et al. Citation2008).
Despite the sanitary importance of cyanobacteria and bacteria, few studies address the co-occurrence of these microorganisms in natural waters using experimental approaches to test the associations observed in the field. Thus, our study proposed to evaluate the relationship between local bacteria able to be cultured and cyanobacteria species in a eutrophic reservoir, using different approaches: field sampling during natural blooms in freshwater and batch experiments on M. aeruginosa and local fecal indicator bacteria species isolated from local reservoirs. However, the impact of numerous environmental factors on these microorganisms in natural environments makes it difficult to separate the influence among microorganisms from that of the environment. For this reason, and with the aim of identifying main environmental forces driving the cyanobacteria and bacteria variability, we assessed both patterns of variability and correlation between their abundance and some environmental factors during cyanobacteria bloom.
This study would provide a more comprehensive view on the dynamics of microorganism populations with sanitary relevance in eutrophic reservoirs: the main environmental forces that drive their variability and the influence they would produce among one another.
Materials and methods
Study site and monitoring design
The research described here was carried out at San Roque reservoir (31° 22′ S, 64° 27′ W; SRr), located west of Cordoba city (Argentine), in the Punilla Valley, at 608 m above sea level (m.a.s.), with a drainage area of 1750 km2. Its surface area is 15.01 km2 and its mean depth is 13.4 m, resulting in a volume of c.a. 201 hm3. The major tributaries are the Cosquín and San Antonio rivers. There are also two minor tributaries: Las Mojarras and Los Chorrillos streams. The Suquía river is the outlet ().
Figure 1. Location of San Roque reservoir in Cordoba-Argentina (South America). Sampling sites are indicated as S1, S2 and S3, which correspond to recreational sites (see text). San Roque basin: Cosquín River; San Antonio River; Las Mojarras stream; Los Chorrillos stream.
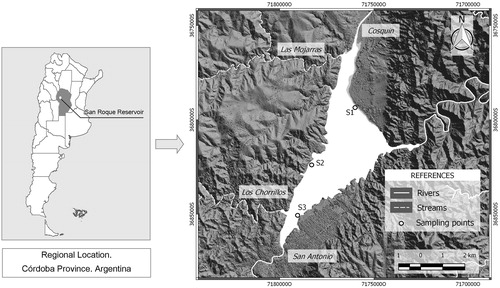
For this study, three monitoring sites were selected near the coast (c.a. 1–5 m from shoreline); in all cases, these sites were frequently visited and used for some recreational purposes (e.g. swimming, fishing). The sampling sites were (S1) Instituto, (S2) Los Mimbres and (S3) El Gitano (). Water samples from these sites were collected monthly during the austral spring and summer periods (September to March), from 2009 to 2013, with some exceptions due to bad weather conditions. Samples for physico-chemical and phytoplankton determinations were taken at a depth of 0.30–0.50 m in 1 L acid-washed (HCl 1N) plastic bottles, whereas sterile containers were used for bacteria. All samples were conserved in darkness at 4 °C and transported to the laboratory within 3–5 h.
Field samples
Measurement and determination of physicochemical parameters
Water temperature, pH, conductivity and dissolved oxygen were measured with a Multiparametric probe (WTW, model Multi 350i, Germany) at a depth of 0.30–0.50 m, while transparency was estimated with a Secchi disk (Chapman 1992). Accumulated monthly precipitation (hereinafter ‘precipitation’) was calculated from daily records at San Antonio River basin. Data were obtained using pluviometers located at 11 stations within the basin. The mean areal precipitation was calculated daily by means of the Thiessen polygon method (Fiedler Citation2003).
Determination of most of the nutrients was done at the laboratory following the Standard Analytical Methods (APHA 2005): total phosphorus (TP) and soluble reactive phosphorus (SRP; SM 4500-P E); nitrites (N-NO2-; SM 4500-NO2- B); and nitrates (N-NO3-; SM 4110 B). On the other hand, ammonium (N-NH4+) determination was done by means of the indophenol blue method (Holmes et al. Citation1999). Dissolved inorganic nitrogen (DIN) was estimated as the sum of the three N-fractions. Samples (300–500 mL) for SRP, N-NO2-, N-NO3- and N-NH4+ determination were previously filtrated by a Millipore cellulose acetate membrane filter (pore size 0.45 µm) and analyzed within 24 h; TP samples were kept frozen until analysis.
Determination of biological variables
Total chlorophyll and chlorophyll-a (chl a) were determined following the procedures of APHA (2005) - SM-10200 H- with modifications. Samples (500–1000 mL) were filtered through a Pall A/E filter type (pore size 1 µm) and extracted in acetone (90%). Measurements at 664 (chl a) were done using a Shimadzu spectrophotometer (model UV-1700, Japan). Acidification with 0.1 mL of HCl 0.1 N was done after chl a measurement for pheophyitin a determination at 665 nm. Samples for phytoplankton identification and quantification were fixed in Lugol´s solution (0.3% final concentration, v:v) and allowed to settle for 72 h using a 1 L graduated cylinder (LeGresley and McDermott Citation2010). After settling, the supernatant was carefully removed until approximately 5% of the total volume was left. The remaining volume was appropriately mixed, dispensed into a Fuchs–Rosenthal chamber (Marienfeld, Germany) and observed with a compound microscope (Zeiss model D-7082, Germany). Taxonomic identification was made using Lopretto and Tell (Citation1995) and Komárek (1999) and cells were counted following the method proposed by APHA (2005) - SM-10200 C F. Bacterial determinations were carried out by the multiple-tube fermentation technique (SM-9221 E) and E. coli quantification was done by fluorescence detection under UV radiation (336 nm; SM-9221 F). Data were reported in terms of the Most Probable Number (MPN) per 100 mL of organisms present.
Bacteria isolation and identification
Samples collected at local reservoirs for bacteriological isolation and identification were incubated immediately after collection in sodium Lauryl Sulfate culture medium at 37 °C during 48 h for Total Coliform bacteria (TC; SM 9221 B; APHA, 2005). For Thermotolerant Coliform bacteria (TtC) and E. coli, samples were transferred in 4-Methylumbelliferyl-beta-D-glucuronide (EC-MUG) at 44.5 °C during 24 h (SM 9221 E and SM 9221 F, respectively; APHA, 2005). Enterococcus isolation was made incubating bacteria during 24–48 h at 37 °C in Azide Dextrose broth and positive samples were placed in Bile Esculin Azide agar; dark colonies were incubated for 48 h at 44.5 °C in Brain-Heart infusion broth with NaCl (6.5%) and a Gram coloring was made for confirmation (SM-9230 B; APHA, 2005).
Confirmation of E. coli and Enterococcus was made by DNA extraction, 16S rRNA amplification by PCR and DNA sequencing. First, samples were refreshed by spreading them in a new nutritive media. This procedure was done twice with the objective of obtaining isolated and healthy colonies. DNA was extracted using the boiling method (Bansal et al. Citation1996) and amplified using Taq (thermostable DNA polymerase), (Chien et al. Citation1976). A region of the 16S rRNA gene was amplified by PCR using bacterial-specific primers CC (F) CCAGATCCTACGGGAGGCAGC and CD (R) CTTGTGCGGGCCCCCGTCAATTC (Universal Primers), (Nübel et al. Citation1997). Once the DNA was amplified, electrophoresis in polyacrylamide agarose gel (PAAG) was used to separate and identify specific bacterial DNA fragments. Before sequencing, PCR product was cleaned up (MinElute PCR purification kit) and a new PCR postclean-up was run. Samples were kept at 4 °C, purified with an ethanol/EDTA/sodium acetate solution and placed in the ABI 3130xl DNA sequencer. The sequence obtained was checked with BLAST program (McGinnis and Madden Citation2004).
Experimental procedures
Isolated E. coli and Enterococcus were stored with Luria Bertani broth and glycerol (20%) at −20 °C and activated during 24 h at 35 °C in Soy Triptein broth before batch experiments. During experiments, three control treatments were established: (1) E. coli (2) Enterococcus spp. (3) E. coli + Enterococcus spp. and three cyanobacteria interaction treatments: (1) E. coli + M. aeruginosa (E.coli + Mic) (2) Enterococcus spp. + M. aeruginosa (Ent + Mic); (3) E. coli + Enterococcus spp. + M. aeruginosa (E.coli + Ent + Mic). Each treatment was performed in triplicate and dispensed in Erlenmeyers of 250 mL with 120 mL of O2 medium (Bomo et al. Citation2011). Cyanobacteria interaction treatments were inoculated with 3 × 10⁴ cell.mL−1 of a pure axenic culture of nontoxic Microcystis aeruginosa strain (PCC7806). The experimental conditions were established and maintained at 25 °C and 60 µmol E. m2.s−1 with a photoperiod of 12:12 h. The experiments lasted 14 days and were conducted twice.
Sampling was made at day 1, day 3, day 6, day 8 and day 15. Aliquots of 400 µL of sample were taken from each Erlenmeyer, plated on Eosin Methylene Blue and Bile Esculin agar for E. coli and Enterococcus spp., respectively. When necessary, 10-, 100- or 1000-fold dilutions of samples in sterile medium were made. Bacteria were incubated at 37 °C and the number of CFUs were manually counted after 24 h. M. aeruginosa counting was made from 2 mL aliquots conserved in formalin (0.01% final concentration, v:v) and maintained in darkness at 4 °C. Aliquots in triplicate were gently homogenized, settled into a Fuchs–Rosenthal chamber (Marienfeld, Germany) and observed with a compound microscope (Zeiss model D-7082, Germany).
Statistical analysis
The association between cyanobacteria and TtC was determined by an exponential fit and Spearman correlation analyses, also used to study the relationship between microorganism’s growth and environmental variables. One-way repeated measures ANOVA test was applied to determine differences in CFU.ml1 among cyanobacteria interaction treatments during experimental period, using a 95% confidence limit.
A multivariate technique (principal component analysis, PCA) was used for ordination on phytoplankton composition and TtC bacteria during spring-summer periods of 2009–2013.
In all cases, InfoStat/P software (Di Rienzo et al. Citation2012) was employed. The normality and homoscedasticity of data were checked using the Shapiro–Wilk test and plotting the residuals, respectively. Data were transformed when necessary and were not considered if statistical assumptions were not achieved.
Results
Variability and interaction between microorganisms
Field data
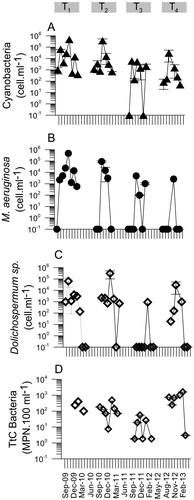
Microorganism variability during the study period at SRr is shown in . Based on patterns of variability in cyanobacteria abundance, pronounced differences between September 2009–March 2011 and September 2011-March 2013 were identified (); so these periods were considered independently (hereafter T1-T2 and T3-T4, respectively). The first period (T1-T2) was characterized by c.a. 95% higher cyanobacteria abundance in comparison to the second one (T3-T4; ). Most of cyanobacteria was represented by M. aeruginosa and Dolichospermum spp. (c.a. 50-100% of total cyanobacteria population; ). On the other hand, TtC bacteria did not show significant differences between T1-T2 and T3-T4, but a TtC decrease occurred during summer 2012 ().
Figure 2. Mean values of cyanobacteria (A), Microcystis aeruginosa, (B) Dolichospermum spp. (C) and thermotolerant coliform bacteria (D) abundance from 2009 to 2013 at San Roque reservoir (SRr). The vertical lines on top of symbols are the standard deviation.
To study the relation between cyanobacteria and TtC, an exponential function was adjusted for each set of data at SRr. A negative function was obtained along the abundance range at T1-T2 (; r2= 0.50), whereas this relationship was not observed at T3-T4 (). Thus, the inverse relationship between cyanobacteria and TtC was only observed when high cyanobacteria concentration occurred (≥3.4 × 10⁴ to 1.2 × 10⁶ cell.mL−1). Spearman coefficients also showed a significant negative correlation between TtC and cyanobacteria species only during T1-T2, being E. coli significantly negative correlated with M. aeruginosa and Dolichospermum spp. ().
Figure 3. Relationship between cyanobacteria and thermotolerant coliform bacteria abundance adjusted by an exponential function during the austral spring-summer periods (September to March) from 2009 to 2011 (T1-T2; A) and from 2011 to 2013 (T3-T4; B) at SRr.
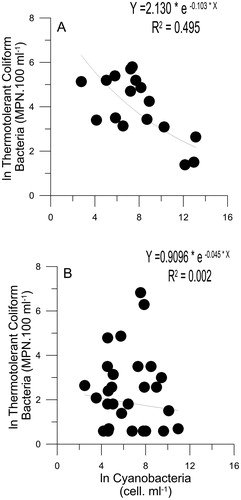
Table 1. Spearman correlation coefficients (r) and their level of significance (p) among most frequent cyanobacteria species and thermotolerant coliform bacteria and Escherichia coli at San Roque reservoir (SRr) during the austral spring-summer periods (September to March), from 2009 to 2011 (T1-T2) and from 2011 to 2013 (T3-T4).
Experimental data
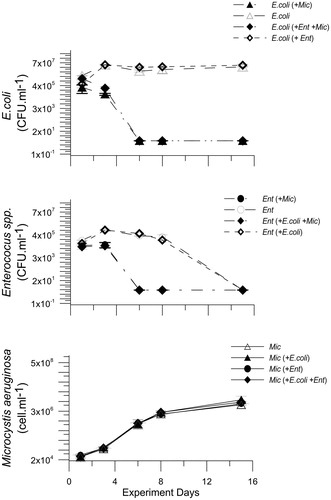
Experimental results also showed this type of response: E. coli and Enterococcus spp. decreased their growth in the presence of M. aeruginosa (). On the other hand, both bacteria species showed an exponential growth (from day 1 to day 3), and then a stationary phase (from day 3 to 15 for E. coli and from day 3 to 8 for Enterococcus spp.) in the same culture conditions but in the absence of M. aeruginosa (. Our results indicate optimal experimental conditions and a significant negative effect of M. aeruginosa on the growth of the studied bacteria (F = 2225; p ≤ 0.001). In particular, when fecal indicator bacteria were inoculated in combination with M. aeruginosa, E. coli and Enterococcus spp. showed a decrease to non-detectable values during the experimental period. Specifically, E. coli showed a decrease in CFU.ml1 from day 3, presenting in the E.coli + Mic treatment and in the E.coli + Ent + Mic treatment values 65% and 80% lower than day 1, respectively (). On the other hand, in the presence of M. aeruginosa, Enterococcus spp. did not present a decrease in CFU.ml1 values from day 1 to day 3 and the population remained in stationary phase until day 3. In both cyanobacteria interaction treatments, Ent + Mic and Ent + E.coli + Mic, an exponential decrease occurred after day 3, since no viable cells were observed (). M. aeruginosa growth was exponential during the whole experiment period ().
Figure 4. Colony forming units (CFU) of Escherichia coli (A) and Enterococcus spp. (B) and cell abundance of Microcystis aeruginosa (C) during the experimental periods.
Interactions between microorganisms and environmental variables
Main environmental and biological variability patterns
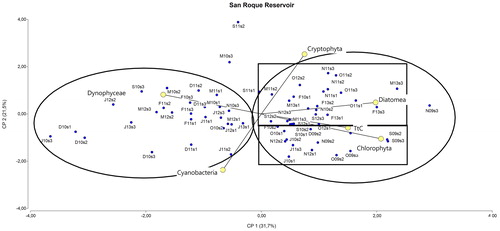
shows PCA data: the main patterns driving biological variability were seasonal changes and hydrological year. The first axis explained the third part of the total variance (31.7%), and might be associated with the seasonal variation. Most of the spring samples (S: September; O: October; N: November) were aggregated on the right side of the first component. On the other hand, the major proportion of summer samples was on the left-hand side (D: December; J: January; F: February; M: March; ). The second axis accounted for 21.3% of total variance, and might indicate differences in hydrological years (i.e. spring 2009 and 2010 were segregated from spring 2011 and 2012, with some exceptions; ). Cyanobacteria variation was partially explained by these two components: the first (seasonality) accounted for 18% and was negatively associated with this group (higher abundance in summer; ) while the second (hydrological year) accounted for 62% with a negative loading (associated with September - December 2009 and 2010; ).
Figure 5. Biplot of principal component analysis of the main phytoplankton taxonomic groups and thermotolerant coliform bacteria abundance from 2009 to 2013 at SRr. The sample scores are plotted to show the temporal distribution: S (September), O (October), N (November), D (December), J (January), F (February), M (March); 09 (2009), 10 (2010), 11 (2011), 12 (2012), 13 (2013) and the spatial distribution: S1, S2 and S3 (see text). Circles indicate the two groups of data separated by the first component, and rectangles indicate those data groups separated by the second component.
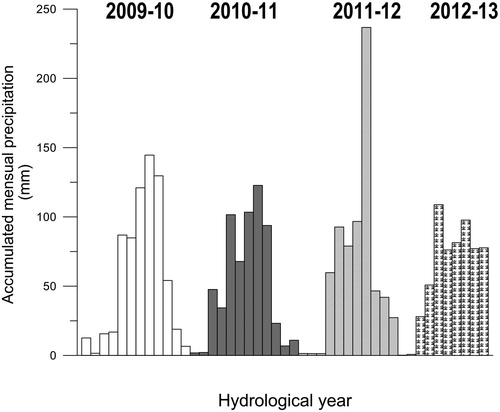
The main measured factors associated with seasonal variability were surface water temperature and precipitation. Surface temperature variability is shown in : during summer, water column stratification was more marked and deeper at T1-T2 in comparison with T3-T4. On the other hand, although precipitation did not show significant differences in hydrological years (c.a. 620 to 690 mm), the monthly distribution of rain was quite different, especially in 2011-12, when summer months were significantly more rainy than during other hydrological years, with strong rainfall events ().
Figure 6. Contour plot of temperature in the San Roque reservoir during September 2009–March 2013. Bar on the right shows temperature values.
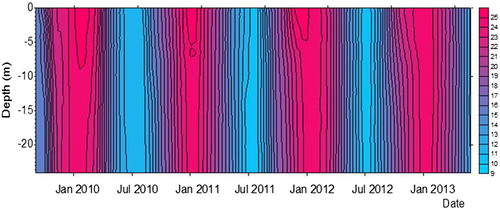
Figure 7. Accumulated monthly precipitation at San Antonio River basin during the hydrological years of 2009-10, 2010-11, 2011-12 and 2012-13. Values were estimated from measurements of 11 pluviometer stations along the basin and calculated by Thiessen polygon method.
Regarding nutrients, the subsurface concentration range for SRP, TP and DIN in spring and summer were 15-90, 60-320 and 146-1100 µg.L−1, respectively during the study period ().
Table 2. Subsurface maximum and minimum concentration values for soluble reactive phosphorus (SRP), total phosphorus (TP) and dissolved inorganic nitrogen (DIN) at San Roque reservoir (SRr), in the months of September–November and December–March during 2010–2013 period.
Microorganism correlations with environmental factors
Temperature and precipitation were significantly correlated with cyanobacteria abundance, especially with the most frequent species in SRr, M. aeruginosa and Dolichospermum spp. During T1-T2, cyanobacteria were positive correlated with temperature while during T3-T4, the variability of the group was inverse to precipitation (). Concerning nutrients, SRP was significantly correlated with cyanobacteria, which decreased while cyanobacteria increased; this negative correlation was evident in M. aeruginosa (). Although Dolichospermum spp. was not significantly correlated with SRP, it showed a significant inverse variation with TP (total phosphorus; ). In addition, DIN was negatively correlated with cyanobacteria and, particularly, with Dolichospermum spp. ().
Table 3. Spearman correlation coefficients (r) and their level of significance (p) among sanitary relevant microorganisms and physico-chemical and hydro-climatological factors of San Roque reservoir (SRr) during the austral spring-summer periods (September to March), from 2009 to 2011 (T1-T2) and from 2011 to 2013 (T3-T4).
Regarding bacteria, TtC and E. coli showed a positive correlation with precipitation and TP. Although TtC decreased at summer 2012, TtC and E. coli were positively associated with precipitation during T3-T4 ().
Discussion
Our research focused on the association between cyanobacteria and fecal indicator bacteria during high and low cyanobacteria abundance periods (T1-T2 and T3-T4, respectively), and their relationship with hydrological and physico-chemical factors in a eutrophic reservoir. A more detailed study on the microorganism association was carried out through batch experiments with local isolated bacteria and axenic cyanobacteria strains.
Cyanobacteria blooms as negative factors for fecal indicator bacteria survival
One of the most remarkable outcomes of our work is the negative association between cyanobacteria and TtC bacteria during bloom periods (≥3.4 × 10⁴ to 1.2 × 10⁶ cell.mL−1) and the negative responses of E. coli and Enterococcus spp. under an M. aeruginosa simulated bloom (≥4 × 10⁴ to 3 × 10⁶ cell.mL−1). According to our results, several authors reported potential negative effects of cyanobacteria on bacteria. Bomo et al. (Citation2011) observed growth inhibition of Aeromonas hydrophila in the presence of M. aeruginosa, whereas Østensvik et al. (Citation1998) reported negative effects of M. aeruginosa extracts on A. hydrophila, Bacillus subtilis and B. cereus. Østensvik et al. (Citation1998) reported a linear relationship between the bacteria growth inhibition and the cyanobacteria extract concentration. They also found that this inverse relationship was explained by the effect of secondary antibacterial metabolites, which are effective against Gram-positive and/or Gram-negative bacteria, but they are not related to cyanotoxins. Although these experimental results confirm the negative association between M. aeruginosa and bacteria species, there are no field reports about this negative correlation. Instead, M. aeruginosa blooms could be a refuge for some bacteria as Aeromonas spp. and species of the Sphingomonades group, some of which are degraders of complex organic compounds present in the biofilms (Berg et al. Citation2009; Dziallas and Grossart Citation2011). Although our field results focus on a reduced group of bacteria, they indicate that during bloom periods,that is, at high abundance ranges, more frequent cyanobacteria species at SRr could be an inhibiting factor for TtC survival, including E. coli (; ). In addition, experiment results reveal the significant negative effect of M. aeruginosa upon the local isolated E. coli and Enterococcus spp. Although both species of bacteria are negatively affected by the presence of M. aeruginosa, E. coli would be more sensitive than Enterococcus spp. (). These findings reveal the importance of the interaction between microorganisms ameliorating or aggravating sanitary conditions of eutrophic reservoirs.
Seasonal and hydrological variation as main forces driving cyanobacteria blooms
In spite of the potential effects among microorganisms, we are aware that environmental factors are the main forces driving the cyanobacteria blooms and TtC presence in reservoirs. Our study determined that seasonal alternation and interannual difference in the hydrological regime were the most important environmental factors influencing the temporal variation of cyanobacteria abundance in SRr (). Stable conditions of the water column have demonstrated to promote cyanobacteria blooms, being this stability mainly related to temperature and wind speed (Paerl and Otten Citation2013). Our data clearly showed that cyanobacteria species were favored by high surface temperatures (). This is mainly related to the possibility of cyanobacteria to acclimate to hot conditions showing maximum growth rates at relatively high temperatures, often higher than 25 °C (van der Westhuizen and Eloff Citation1985; Davis et al. Citation2009). Moreover, warming of surface waters promotes the vertical stratification, which favors cyanobacteria growth (Wagner and Adrian Citation2009; Huber et al. Citation2012; Harke et al. Citation2016). This condition was observed at SRr during summer season, especially at T1-T2 ().
Concerning hydrological effects, several authors have reported a negative association between precipitation and cyanobacteria populations (Reichwaldt and Ghadouani Citation2012; Lehman et al. Citation2017). According to this, our results showed a negative correlation between precipitation and cyanobacteria abundance (especially Dolichospermum spp.) at T3-T4. Cyanobacteria abundance at T3-T4 was an order of magnitude lower than that during T1-T2. This fact could be probably related to different hydrological regimes during the studied period: T3-T4 (particularly during 2011-12) displayed a dryer spring and a more rainy summer in comparison to T1-T2 (). Similarly, O’Farrell et al. (Citation2012) found that hydrological conditions were the main factor determining the M. aeruginosa and Dolichospermum spp. abundance in a eutrophic reservoir. Higher precipitation levels would not only change the stable conditions of the water column but also increase the water exchange rate in summer. The cyanobacteria group dominates at low dilution conditions, which generally occurs in lakes and reservoirs with low renewal rates (0.06–0.15 day−1), (Romo et al. Citation2013; Sugimoto et al. Citation2016); this is often caused by rain deficit (Lehman et al. Citation2017). During the T1-T2 period at SRr, small rainfall events in summer probably favored cyanobacteria species growth. Thus, the low precipitation events would have a low effect on the dilution and water column stratification and would allow the rapid use of the entered nutrients, which, in combination with an increasing temperature and long water residence time (), would favor cyanobacteria dominance. On the other hand, during T3-T4, heavy rainfall events during summer 2012 would prevent the development of cyanobacteria blooms by flushing and de-stratification (), which had a long-term negative effect on cyanobacteria blooms (Reichwaldt and Ghadouani Citation2012) and would explain the lower cyanobacteria abundance during T3-T4. Instead, TtC did not show so pronounced differences in abundance during hydrological years () and were positively associated with precipitation at T3-T4 (). Thus, the main TtC sources at SRr would be point discharges from tributaries (or urban drainage discharges) and soil washing by rain (i.e. diffuse discharges). Although TtC and E. coli, were not directly associated with precipitation during T1-T2 period, they were significantly associated with TP (). In this sense, TtC is associated with point and diffuse discharges increased by precipitation, and high organic nutrient concentration would be a key factor for the survival of TtC in natural waters (Craig et al. Citation2004).
As mentioned above, seasonal and rainfall conditions were remarkable forces driving microorganism abundance in SRr. Hydrological patterns control water discharge, which in turn affects the nutrient delivery and cycling. In systems where both N and P are not limiting on average during the entire growing season (i.e. ≥10 µg SRP. L−1 and ≥100 µg DIN. L−1), factors other than nutrient limitation (e.g. light, vertical mixing, residence time) become more important in the control of cyanobacteria blooms (Xie et al. Citation2003; Paerl Citation2008). Dissolved nutrients (SRP and DIN) did not show to be limiting during summer and spring seasons at SRr (), so their association with the temporal variation of cyanobacteria probably revealed only the uptake effect. Hence, both SRP and DIN were negatively correlated with M. aeruginosa and Dolichospermum spp. (). According to our results, other authors reported low SRP concentrations during M. aeruginosa and Dolichospermum spp. blooms, probably due to their rapid phosphate uptake and their capacity to store P when available in high concentrations (Paerl Citation2008; O’Farrell et al. Citation2012). Hence, the cyanobacteria responses observed in our study revealed P and N uptake and did not show bottom-up regulation from nutrients, mainly due to a full supply of nutrients during the studied period (). Instead, Xu et al. (Citation2010) found that during summer bloom periods in a eutrophic lake, P is sufficient, while N could be a primary limiting nutrient.
Conclusions
In summary, our data demonstrated that in eutrophic reservoirs, cyanobacteria blooms could be a negative factor for survival of some fecal bacteria species. However, environmental factors involved in the control and triggering of bloom development as well as conditions for survival of bacteria are most important and quite variable depending on the reservoir features. In our study, the main factors determining the temporal variability of sanitary relevant microorganisms in spring-summer time were not mainly driven by nutrients, but other regional factors such as hydrological and temperature conditions, which also had a great influence.
Thus, studies related to short-time changes in climatic patterns as well as local physical dynamics would be fundamental for revealing the potential effects on microorganism communities affecting human health. Water recreational areas deserve special attention, mainly at eutrophic water systems, where nutrients are not a limiting condition and other physical and hydrological factors play a major role.
Notes on contribuitors
Silvana R. Halac studies continental water systems in order to understand their dynamics and functioning, as well as the impact of anthropic activity on them. The processes of eutrophication, algae blooms, production of toxins and the presence of pathogenic bacteria are the greatest points of interest in these studies. Recently, she has begun the study of sedimentary fill in reservoirs with the purpose of reconstructing the history of the chemical-biological processes that have taken place since their foundation (paleolimnology).
Raquel V. Bazán has a research interest in applied microbiology, limnology and surface water quality. She is also interested in the evaluation of water quality for recreational use and human consumption, the pollution of surface waters and effluent treatment. She is a Professor at the Faculty of Exact, Physical and Natural Sciences – UNC.
Nancy B. Larrosa has a research interest and extensive experience in quality monitoring of water bodies. She also performs transfer technology working, participating and directing agreements for the realization of public service institutions and private companies. She is a Professor at the Faculty of Exact, Physical and Natural Sciences – UNC.
Ana Florencia Nadal is a researcher on Environmental Engineering specialized in wastewater treatment. She studies fecal indicator bacteria populations in natural waters and effluents, transport of pollutants water quality and designing of effluent treatment systems. She is a Professor at the Faculty of Exact, Physical and Natural Sciences – UNC.
Ana Laura Ruibal is a researcher on Hydrology, specialized in Environmental Engineering. She is a coordinator of research and service projects related to water quality and environmental pollution. She also studies cyanobacteria toxins and their effects on human health, including risk assessment in human populations with chronic exposure to cyanotoxins.
María Ines Rodriguez is a researcher on Water Resources, specialized in Limnology, water quality and management. She studies the dynamics of phytoplankton communities and algal blooms, with emphasis on biological indicators. Some studies she has undertaken include the collection and analysis of contemporary data taken from the monitoring of reservoirs and rivers. She is responsible for the permanent program of Water Quality Monitoring and Database management.
Marcia A. Ruiz is a researcher on Water Resources, specialized in Water, Environment and Health Engineering. Her studies focus on toxins produced by cyanobacteria and their effect on human health. The studies carried out include risk assessment in human populations with chronic exposure to cyanotoxins.
Abel G. López is director of the Food Science and Technology Institute. His main area of research is food microbiology with a special interest in microbial control, strategies of microorganism inhibition and food safety. He is a Professor at the Faculty of Exact, Physical and Natural Sciences – UNC.
Acknowledgments
We thank Dirección de Seguridad Náutica (Córdoba, Argentina) and Aguas Cordobesas S.A. for supporting in fieldwork and data obtaining. We are also grateful to Sistema Telemétrico and Area de Hidrología (INA - CIRSA) for the supply of hydrological data, and with A.L Rydzewski for regional mapping. Bacteria confirmation was made at University College of Southeast Norway (NSH). A. Montecino, L. Mengo, J. Benedetti, J. Grión, C. Gaido and P. Sánchez helped with maintenance and counting of bacteria and cyanobacteria cultures.
Disclosure statement
No potential conflict of interest was reported by the authors.
Additional information
Funding
References
- Amé MV, Díaz MP, Wunderlin DA. 2003. Occurrence of toxic Cyanobacterial blooms in San Roque reservoir (Córdoba, Argentina): a field and chemometric study. Environ Toxicol. 18(3):192–201.
- American Public Health Association [APHA], American Water Works Association [AWWA], Water Environment Federation [WEF] 2005. In: Eaton, A.D., Clesceri, L.S., Rice, E.W., Greenberg, A.H. (eds): Standard methods for the examination of water and wastewater. –Baltimore.
- Anneville O, Domaizon I, Kerimoglu O, Rimet F, Jacquet S. 2015. Blue-green algae in a “Greenhouse Century”? New insights from field data on climate change impacts on cyanobacteria abundance. Ecosystems. 18(3):441–458.
- Ballot A, Sandvik M, Rundberget T, Botha CJ, Miles CO. 2014. Diversity of cyanobacteria and cyanotoxins in Hartbeespoort Dam, South Africa. Mar Freshwater Res. 65(2):175–189.
- Bansal NS, McDonell FH, Smith A, Arnold G, Ibrahim GF. 1996. Multiplex PCR assay for the routine detection of Listeria in food. Int J Food Microbiol. 33(2–3):293–300.
- Berg KA, Lyra C, Sivonen K, Paulin L, Suomalainen S, Tuomi P, Rapala J. 2009. High diversity of cultivable heterotrophic bacteria in association with cyanobacterial water blooms. ISME J. 3(3):314.
- Bomo AM, Tryland I, Haande S, Hagman CHC, Utkilen H. 2011. The impact of Cyanobacteria on growth and death of opportunistic pathogenic bacteria. Water Sci Technol. 64(2):384–390.
- Bonilla S, Aubriot L, Soares MCS, González-Piana M, Fabre A, Huszar VLM, Lürling M, Antoniades D, Padisák J, Kruk C. 2012. What drives the distribution of the bloom-forming cyanobacteria P lanktothrix agardhii and Cylindrospermopsis raciborskii? FEMS Microbiol Ecol. 79(3):594–607.
- Byappanahalli MN, Whitman RL, Shively DA, Ting WT, Tseng CC, Nevers MB. 2006. Seasonal persistence and population characteristics of Escherichia coli and Enterococci in deep backshore sand of two freshwater beaches. J Water Health. 4(3):313–320.
- Cai Y, Kong F. 2013. Diversity and dynamics of picocyanobacteria and the bloom-forming cyanobacteria in a large shallow eutrophic lake (lake Chaohu, China). J Limnol. 72(3):38.
- Chapman D. 1992. Selection of water quality variables. In: Chapman, D. (ed.): Water quality assessments. A guide to the use of biota, sediments and water in the environmental Monitoring. Chapman & Hall, (on behalf of WHO), London, pp 74–133.
- Chien A, Edgar DB, Trela JM. 1976. Deoxyribonucleic acid polymerase from the extreme thermophile Thermus aquaticus. J Bacteriol. 127(3):1550–1557.
- Chorus I, Bartram J. 1999. Toxic Cyanobacteria in water. A guide to their public health, consequences, monitoring and management. E&FN Spon (on behalf of WHO), London, pp. 1–416.
- Craig DL, Fallowfield HJ, Cromar NJ. 2004. Use of microcosms to determine persistence of Escherichia coli in recreational coastal water and sediment and validation with in situ measurements. J Appl Microbiol. 96(5):922–930.
- Davis TW, Berry DL, Boyer GL, Gobler CJ. 2009. The effects of temperature and nutrients on the growth and dynamics of toxic and non-toxic strains of Microcystis during cyanobacteria blooms. Harmful Algae. 8(5):715–725.
- De Souza Beghelli FG, Frascareli D, Pompêo MLM, Moschini-Carlos V. 2016. Trophic state evolution over 15 years in a tropical reservoir with low nitrogen concentrations and cyanobacteria predominance. Water Air Soil Pollut. 227(3):95.
- Di Rienzo JA, Casanoves F, Balzarini MG, González L, Tablada M, Robledo CW. 2012. InfoStat, version 2012, InfoStat Group, FCA - UNC, Argentina.
- Dziallas C, Grossart HP. 2011. Temperature and biotic factors influence bacterial communities associated with the cyanobacterium Microcystis sp. Environ Microbiol. 13(6):1632–1641.
- Eiler A, Gonzalez-Rey C, Allen S, Bertilsson S. 2007. Growth response of Vibrio cholerae and other Vibrio spp. to cyanobacterial dissolved organic matter and temperature in brackish water. FEMS Microbiol Ecol. 60(3):411–418.
- Falconer IR, Humpage AR. 2005. Health risk assessment of cyanobacterial (blue-green algal) toxins in drinking water. Int J Environ Res Public Health. 2(1):43–50.
- Fiedler FR. 2003. Simple, practical method for determining station weights using Thiessen polygons and isohyetal maps. J Hydrol Eng. 8(4):219–221.
- Harke MJ, Steffen MM, Gobler CJ, Otten TG, Wilhelm SW, Wood SA, Paerl HW. 2016. A review of the global ecology, genomics, and biogeography of the toxic cyanobacterium, Microcystis spp. Harmful Algae. 54:4–20.
- Holmes RM, Aminot A, Kérouel R, Hooker BA, Peterson BJ. 1999. A simple and precise method for measuring ammonium in marine and freshwater ecosystems. Can J Fish Aquat Sci. 56(10):1801–1808.
- Huber V, Wagner C, Gerten D, Adrian R. 2012. To bloom or not to bloom: contrasting responses of cyanobacteria to recent heat waves explained by critical thresholds of abiotic drivers. Oecologia. 169(1):245–256.
- Ibelings BW, Havens KE. 2008. Cyanobacterial toxins: a qualitative meta–analysis of concentrations, dosage and effects in freshwater, estuarine and marine biota. In Cyanobacterial harmful algal blooms: state of the science and research needs (pp. 675–732). Springer, New York, NY.
- Ishii S, Sadowsky MJ. 2008. Escherichia coli in the environment: implications for water quality and human health. Microb Environ. 23(2):101–108.
- Karjalainen M, Engstrom-Ost J, Korpinen S, Peltonen H, Pääkkönen JP, Rönkkönen S, Suikkanen S, Viitasalo M. 2007. Ecosystem consequences of cyanobacteria in the northern Baltic Sea. Ambio. 36(2–3):195–202.
- Komárek J. 1999. Ubersicht der planktischen Blaualgen (Cyanobakterien) im Elbe Flussgebiet. –IKSE/MKOL, Magdeburg.
- LeGresley CM, McDermott G. 2010. Counting chamber methods for quantitative phytoplankton analysis - haemocytometer, Palmer-Maloney cell and Sedgewick-Rafter cell. –In: Karlson, B., Cusack, C., Bresnan, E. (eds): Microscopic and Molecular Methods for Quantitative Phytoplankton Analysis. –Intergovernmental Oceanographic Commission (IOC), Manuals and Guides, UNESCO, pp.25–30.
- Lehman PW, Kurobe T, Lesmeister S, Baxa D, Tung A, Teh SJ. 2017. Impacts of the 2014 severe drought on the Microcystis bloom in San Francisco Estuary. Harmful Algae. 63:94–108.
- Lewis WM, Jr, Wurtsbaugh WA, Paerl HW. 2011. Rationale for control of anthropogenic nitrogen and phosphorus to reduce eutrophication of inland waters. Environ Sci Technol. 45(24):10300–10305.
- Lopretto EC, Tell G. 1995. Freshwater ecosystems. Study methodologies. Ed. Sur, Buenos Aires, pp. 379–442.
- McGinnis S, Madden TL. 2004. BLAST: at the core of a powerful and diverse set of sequence analysis tools. Nucleic Acids Res. 32(Web Server issue):W20–W25.
- Michalak AM, Anderson EJ, Beletsky D, Boland S, Bosch NS, Bridgeman TB, DePinto JV. 2013. Record-setting algal bloom in Lake Erie caused by agricultural and meteorological trends consistent with expected future conditions. Proc Natl Acad Sci. 2012;16006.
- Moss B, Kosten S, Meerhoff M, Battarbee RW, Jeppesen E, Mazzeo N, Paerl H. 2011. Allied attack: climate change and eutrophication. IW. 1(2):101–105.
- Muylaert K, Van der Gucht K, Vloemans N, De Meester L, Gillis M, Vyverman W. 2002. Relationship between bacterial community composition and bottom-up versus top-down variables in four eutrophic shallow lakes. Appl. Environ. Microbiol. 68(10):4740–4750.
- Nübel U, Garcia-Pichel F, Muyzer G. 1997. PCR primers to amplify 16S rRNA genes from cyanobacteria. Appl Environ. Microbiol. 63:3327–3332.
- O’Neil JM, Davis TW, Burford MA, Gobler CJ. 2012. The rise of harmful cyanobacteria blooms: the potential roles of eutrophication and climate change. Harmful Algae. 14:313–334.
- O’Farrell I, Bordet F, Chaparro G. 2012. Bloom forming cyanobacterial complexes co-occurring in a subtropical large reservoir: validation of dominant eco-strategies. In Phytoplankton responses to human impacts at different scales (pp. 175–190). Springer, Dordrecht.
- Østensvik Ø, Skuberg OM, Underdak B, Hormazabal V. 1998. Antibacterial properties of extracts from selected planktonic Cyanobacteria: A comparative study of bacterial bioassays. J Appl Microbiol. 84:1117–1124.
- Ozawa K, Fujioka H, Muranaka M, Yokoyama A, Katagami Y, Homma T, Ishikawa K, Tsujimura S, Kumagai M, Watanabe MF, Park HD. 2005. Spatial distribution and temporal variation of Microcystis species composition and microcystin concentration in Lake Biwa. Environ Toxicol. 20(3):270–276.
- Paerl H. 2008. Nutrient and other environmental controls of harmful cyanobacterial blooms along the freshwater–marine continuum. In Cyanobacterial harmful algal blooms: state of the science and research needs (pp. 217–237). Springer, New York, NY.
- Paerl HW, Huisman J. 2008. Climate. Blooms like it hot. Science. 320(5872):57–58.
- Paerl HW, Otten TG. 2013. Harmful cyanobacterial blooms: Causes, consequences and controls. Microb Ecol. 65(4):995–1010.
- Reichwaldt ES, Ghadouani A. 2012. Effects of rainfall patterns on toxic cyanobacterial blooms in a changing climate: between simplistic scenarios and complex dynamics. Water Research. 46(5):1372–1393.
- Romo S, Soria J, Fernandez F, Ouahid Y, Barón‐Solá A. 2013. Water residence time and the dynamics of toxic cyanobacteria. Freshwater Biol. 58(3):513–522.
- Rodríguez MI, Ruiz M. 2016. Limnology of the San Roque Reservoir. The Environmental Handbook of Chemistry, Springer: Berlin.
- Rossen A, Rodríguez MI, Ruibal Conti AL, Fortunato MS, Bustamante A, Ruiz M, Angelaccio C, Korol S. 2008. Bacterial indicators of fecal contamination in San Roque reservoir (Córdoba, Argentina). Hig Sanid Ambient. 8:325–330.
- Ruibal Conti AL, Guerrero JM, Regueira JM. 2005. Levels of microcystins in two Argentinean reservoirs used for water supply and recreation: differences in the implementation of safe levels. Environ Toxicol. 20(3):263–269.
- Ruiz M, Galanti L, Ruibal AL, Rodriguez MI, Wunderlin DA, Amé MV. 2013. First Report of microcystins and anatoxin-a co-occurrence in San Roque reservoir (Córdoba, Argentina). Water Air Soil Pollut. 224:1593.
- Skulberg OM. 2000. Microalgae as a source of bioactive molecules–experience from cyanophyte research. J Appl Phycol. 12(3/5):341–348.
- Smith VH, Schindler DW. 2009. Eutrophication science: where do we go from here? Trends Ecol Evolut. 24(4):201–207.
- Soller JA, Schoen ME, Varghese A, Ichida AM, Boehm AB, Eftim S, Ashbolt NJ, Ravenscroft JE. 2014. Human health risk implications of multiple sources of faecal indicator bacteria in a recreational waterbody. Water Res. 66:254–264.
- Staley C, Reckhow KH, Lukasik J, Harwood VJ. 2012. Assessment of sources of human pathogens and fecal contamination in a Florida freshwater lake. Water Res. 46(17):5799–5812.
- Steffen MM, Belisle BS, Watson SB, Boyer GL, Wilhelm SW. 2014. Status, causes and controls of cyanobacterial blooms in Lake Erie. J Great Lakes Res. 40(2):215–225.
- Sugimoto K, Negishi Y, Amano Y, Machida M, Imazeki F. 2016. Roles of dilution rate and nitrogen concentration in competition between the cyanobacterium Microcystis aeruginosa and the diatom Cyclotella sp. in eutrophic lakes. J Appl Phycol. 28(4):2255–2263.
- Tison DL, Pope DH, Cherry WB, Fliermans CB. 1980. Growth of Legionella pneumophila in association with blue-green algae (cyanobacteria). Appl Environ Microbiol. 39(2):456–459.
- Van der Westhuizen AJ, Eloff JN. 1985. Effect of temperature and light on the toxicity and growth of the blue-green alga Microcystis aeruginosa (UV-006). Planta. 163(1):55–59.
- Wade TJ, Calderon RL, Sams E, Beach M, Brenner KP, Williams AH, Dufour AP. 2006. Rapidly measured indicators of recreational water quality are predictive of swimming-associated gastrointestinal illness. Environ Health Perspect. 114(1):24–28.
- Wagner C, Adrian R. 2009. Cyanobacteria dominance: quantifying the effects of climate change. Limnol Oceanogr. 54(6part2):2460–2468.
- Whitman RL, Nevers MB, Byappanahalli MN. 2006. Examination of the watershed-wide distribution of Escherichia coli along southern Lake Michigan: an integrated approach. Appl Environ Microbiol. 72(11):7301–7310.
- Wilhelm SW, Farnsley SE, LeCleir GR, Layton AC, Satchwell MF, DeBruyn JM, Boyer GL, Zhu G, Pae HW. 2011. The relationships between nutrients, Cyanobacterial toxins and the microbial community in Taihu (Lake Tai), China. Harmful Algae. 10(2):207–215.
- Xie L, Xie P, Li S, Tang H, Liu H. 2003. The low TN:TP ratio, a cause or a result of Microcystis blooms? Water Res. 37(9):2073–2080.
- Xu H, Paerl HW, Qin B, Zhu G, Gaoa G. 2010. Nitrogen and phosphorus inputs control phytoplankton growth in eutrophic Lake Taihu, China. Limnol Oceanogr. 55(1):420–432.