
Abstract
Understanding the influence of growth and development on the stoichiometry of organisms with complex lifecycles is necessary to understand the spatial and temporal extent of consumer-driven nutrient dynamics. This can be particularly challenging in temporally variable habitats, such as geographically isolated wetlands (GIW), which dry down seasonally. Larval anurans (tadpoles) are excellent model organisms for studies within the framework of ecological stoichiometry because they undergo major anatomical changes during metamorphosis that likely require a shift in body stoichiometric demands. To examine stoichiometry of larval anurans in GIWs, we measured larval Lithobates sphenocephalus tissue carbon (C), nitrogen (N), phosphorus (P) and calcium (Ca) content, excretion NH4-N, TDN and TDP, and egestion C, N and P across three developmental stage categories (no limbs, hind limbs only, and four limbs). We found that tissue P content increased significantly during later stages when bone development was occurring, which significantly reduced tissue C:P and N:P. Tissue C also increased across stages. Mass-specific excretion of TDN and N:P decreased across stages. Per capita NH4-N excretion rate had a positive relationship with body size, and per capita excretion N:P had a negative relationship with body size. Mass specific bulk egestion and C egestion varied across stages, as well as C:N and C:P, but we could not distinguish which stages were different from one another. Per capita egestion rates of N and P were positively correlated with body size, and both C:N and C:P were negatively related to body size. We found that development stage of larval anurans was an important indicator of tissue, excretion, and egestion stoichiometry and these differences may influence their functional role in aquatic ecosystems throughout their development.
Introduction
The functional roles of consumers in ecosystems are strongly influenced by species-specific life history traits (Vanni et al. Citation2002). Consumers can play an essential part in nutrient availability through storage, excretion and egestion (Elser et al. Citation1996; Vanni Citation2002), but the spatial and temporal variation in these processes can be heavily dependent on life history strategy (Vanni et al. Citation2002; Atkinson et al. Citation2017a). Ecological stoichiometry (ES, hereafter; Sterner and Elser Citation2002) provides a useful framework for understanding the roles of different species by predicting the dynamics of consumer storage and excretion with respect to species-specific life history demands and environmental variation. A prediction of ES is that consumers maintain strict homeostasis of their body tissues, but homeostatic demands vary interspecifically, and tissue stoichiometry is predicted to influence nutrient release (i.e. excretion and egestion rate; Sterner and Elser Citation2002). A review of excretion rates across a wide range of ectothermic aquatic animals (Vanni and McIntyre Citation2016) showed that body size and water temperature were the best generalized predictors of excretion rate. Excretion by consumers that undergo changes in homeostatic demands related to ontogenetic shifts (i.e. larval anurans) may vary from this generalized model (Tiegs et al. Citation2016; Stephens et al. Citation2017).
Ontogenetic shifts are generally coupled with changes in energetic demand, and corresponding changes in diet (Showalter et al. Citation2016), anatomical development (Tiegs et al. Citation2016), habitat use (Duffy et al. Citation2010) and behavior (Lecchini and Galzin Citation2005). Changes in anatomical structure associated with ontogenetic shifts that alter homeostatic demands (e.g. development of phosphorus-rich bone tissue) result in changes in tissue stoichiometry, which can lead to changes in excretion and egestion stoichiometry (Sterner and Elser Citation2002; Vanni et al. Citation2002). Furthermore, ES predicts that variation in environmental factors such as temperature and resource stoichiometry play an important role in the dynamics of storage and excretion by consumers (Sterner and Elser Citation2002). Studying ontogenetic shifts in organisms across environmental gradients allows us to integrate our understanding of these processes (Allen and Gillooly Citation2009).
Amphibians, and anurans in particular, are useful model organisms for questions regarding homeostatic regulation and ontogenetic shifts in consumers because many species have a complex life cycle with aquatic larvae and terrestrial juvenile and adult stages. The development of anatomical structures that support a terrestrial existence requires anurans to undergo significant changes in the skeletal, muscular and digestive systems (Hourdry et al. Citation1996). Development of specific tissues, such as P-rich bone and N-rich muscle (Sterner and Elser Citation2002), suggests that homeostatic regulation may change over development. Over 45 larval anuran developmental stages from egg to emerging juvenile frog have been described (Gosner Citation1960). In late stages, bone tissue (hydroxyapatite, Ca10(PO4)6(OH)2) density increases as larvae undergo osteogenesis (Stephens et al. Citation2017), which requires both calcium (Ca) and P (Reiners Citation1986; Sterner and Elser Citation2002). Laboratory studies of homeostatic regulation across larval anuran development stages have shown that P demand increases significantly during osteogenesis (Tiegs et al. Citation2016; Stephens et al. Citation2017), which suggests a potential increase in Ca content as well, given the dependence on this mineral for bone tissue production. The potential uptake and sequestration of P in consumers such as larval anurans is of particular interest because this element is limited in many freshwater ecosystems (Dodds and Whiles Citation2002).
Understanding P regulation in larval anurans in a natural setting is challenging given the high degree of developmental plasticity in these organisms. For example, seasonal changes in water levels and temperature co-vary and can alter larval development rates (Crump Citation1989; Abrams et al. Citation1996) and feeding behavior (Carreira et al. Citation2016), both of which may challenge homeostatic thresholds of P (Frost et al. Citation2006; Stephens et al. Citation2017). Predation risk can also influence homeostatic regulation by altering tail morphology of larval anurans (Costello and Michel Citation2013). The tail may be an important reserve of P used in later stages of development in larval anurans (Gonçalves et al. Citation2015), thus changes in tail morphology can potentially lead to stoichiometric differences. Stoichiometric sensitivity to environmental variation can also be driven by genetic variation within species, such as the variation that occurs along latitudinal gradients (e.g. higher lipid storage in emerging juvenile frogs from arctic regions than boreal regions; Liess et al. Citation2013). Plasticity to environmental parameters is an important to life history attribute as many anurans develop in temporally variable habitats, such as isolated wetlands, floodplains or ephemeral streams (Russell et al. Citation2002; Gómez-Rodríguez et al. Citation2009).
Temporally variable habitats such as geographically isolated wetlands (GIW), which are defined as wetlands completely surrounded by uplands (Tiner Citation2003), are interesting habitats to study environmental constraints on anuran development given the large degree of spatial and temporal variability in environmental characteristics amongst wetlands (Kirkman et al. Citation2012; Smith et al. Citation2017). Many GIWs dry seasonally, thus preventing establishment of fish populations (Gibbons Citation2003). GIWs that lack fish and are dominated by herbaceous vegetation are particularly important for anuran communities (Liner et al. Citation2008). High light availability in herbaceous wetlands supports high production of periphyton a key food resource for larval anurans (Altig et al. Citation2007; Whiles et al. Citation2010; Altig and McDiarmid Citation2015; Atkinson et al. Citation2017b). Understanding the individual constraints on larval anuran development in GIWs provides a useful groundwork to understand larger scale effects associated with the production of these organisms. Production of the larval anuran community can directly influence the nutrient fluxes by these consumers (Capps et al. Citation2015a). Moreover, the influence likely varies temporally depending on larval densities and developmental stage (Kupferberg Citation1997, Capps et al. Citation2015b). Furthermore, because larval anurans transform into terrestrial juveniles that may move into uplands or other aquatic habitats, selection for specific nutrients (i.e. P) has important implications for the quality of nutrient fluxes across ecosystem boundaries (Jackson and Fisher Citation1986; Capps et al. Citation2015b; Fritz and Whiles Citation2018).
Our study describes stoichiometric changes and nutrient release (excreta and egesta) of free-ranging larval anurans in GIWs. Specifically, our goal was to document patterns in tissue N, P and Ca across developmental stages in larval Lithobates sphenocephalus (southern leopard frog). We predicted that larval L. sphenocephalus tissue stoichiometry would show increases in tissue P and Ca and decreases in C:P and N:P during developmental stages in which osteogenesis occurs. We also predicted that excretion and egestion rates would be best explained by both larval stage and body size with excretion and egestion scaling positively with body mass, but P being preferentially retained in later development stages. Lastly, we predicted that larval anuran excretion and egestion stoichiometry would be negatively related to tissue stoichiometry and positively related to resource stoichiometry, as predicted by ES.
Methods
Study site
Our study took place in GIWs at Ichauway, the research site of the Joseph W. Jones Ecological Research Center in southwestern Georgia, USA. Ichauway is a 12,000-hectare reserve dominated by fire-maintained longleaf pine (Pinus palustrus) woodlands with numerous embedded GIWs (Boring Citation2001). Generally, GIWs in the region are inundated from late fall through late spring or summer (Battle and Golladay Citation2001). Plant community development within GIWs is driven by patterns in hydroperiod length and fire frequency (Kirkman et al. Citation2012). Three types of GIWs occur on the site: cypress-gum swamps, cypress savannas and herbaceous marshes (Kirkman et al. Citation2000). Among these wetlands, marshes typically have a moderate hydroperiod and experience frequent fire. We selected two marsh wetlands that were similar in size 9.6 ha (W21) and 10.1 ha (W46). Marshes were selected because they support the highest anuran species richness in the local landscape (Liner et al. Citation2008), and have high light availability supporting an abundance of high quality algal food sources reducing potential effects of low resource stoichiometry (i.e. high algal C:P, N:P) on larval anuran development (Frost et al. Citation2006; Stephens et al. Citation2017).
Larval anuran collection
Lithobates sphenocephalus larvae were collected monthly from the two wetlands from February to June 2016. Larval anurans were collected using a box trap sampler (0.61 × 0.61 m, 0.3721 m2) (Gunzburger Citation2007) that was thrown haphazardly across microhabitats up to 0.75 m deep within the wetland or by dip net (3 mm mesh size). Upon capture, all L. sphenocephalus larvae were measured for total length (to the nearest 1 mm). Larval mass (to the nearest 0.0001 g) was estimated using a regression equation developed from previously collected data on length to dry mass relationships for larval L. sphenocephalus (see Supplement 1).
Prior to processing L. sphenocephalus larvae for tissue chemistry, we designated each to a ‘stage’ category based on Gosner stages of larval anuran development (Gosner Citation1960): stage category ‘0L’ represented larvae with no limbs (Gosner stages 26–30), ‘2L’ represented larvae with hind limbs (Gosner stages 30–40), and ‘4L’ indicated larvae with both front and hind limbs, but retaining a tail (Gosner stages 41–45). We selected these three broad stage categories because they could readily be distinguished in the field and represented major morphological changes associated with increased ossification in larval anurans from free-swimming larvae without limbs, to free swimming larvae with just hind limbs, to late stage larvae with four limbs transitioning to a terrestrial form (Gosner Citation1960; Kemp and Hoyt Citation1969), across which C, N and P demands might be expected to differ.
Resource stoichiometry
Periphyton samples were collected monthly from both wetlands from February to July 2016 using periphytometers (i.e. plastic microscope slide holder zip-tied to rebar). Five periphytometers, each consisting of two microscope slides were deployed in a wetland, for approximately 4 weeks, to allow sufficient growth on the slides (Opsahl et al. Citation2010). The periphytometers were placed vertically in the water column at five equidistant sampling points along a transect from the deepest part of the wetland to the wetland edge to account for variation in periphyton growth with water depth and to ensure sufficient sample size given rapidly changing water levels. Upon collection of periphytometers, ∼100 mL of DI water was placed into a tray and each slide was scraped clean to create a slurry. The periphyton slurry was dried at 50 °C for ∼24 h and stored in pre-ashed glass vials. For %C and %N, samples were analyzed using a ‘Flash 2000’ organic elemental analyzer (C.E. Elantech, Lakewood, New Jersey, USA). For %P analysis, periphyton subsamples were combusted at 500 °C for 2 h, and digested in HCl, and analyzed by soluble reactive phosphorus analysis (Solorzano and Sharp Citation1980).
Tissue stoichiometry
Following collection of excretion and egestion samples (described below), larvae were transferred to a whirlpack (Nasco, Ft. Atkinson, Wisconsin, USA) with a small amount of water from the wetland, and transported to the lab for euthanasia using 10g/L pH buffered MS-222 solution (Close et al. Citation1997). Total length, developmental stage and total wet mass were recorded for all larvae. Larval anurans were then dissected to remove the gastrointestinal tract, weighed again, and frozen for later analysis of tissue %C, %N, %P and %Ca. Prior to analysis, larvae were dried at 50 °C for ≥48 h. Samples were then homogenized by grinding with mortar and pestle and stored in ashed vials in a desiccator. Subsamples (∼2 mg) were analyzed for %C, %N and %P as described above. Additional subsamples from 20 specimens were used for analysis of tissue %Ca; these subsamples were combusted at 500 °C for 2 h, and digested in H2NO3 (Solorzano and Sharp Citation1980) followed by cation analysis using ICP-OES (Perkin Elmer Optima 3000 DV ICP-OES with As-91 Autosampler, Boston, Massachusetts, USA).
Excretion and egestion
Larval L. sphenocephalus at each available developmental stage were collected monthly for determining excretion (NH4-N, TDN and TDP) and egestion rates (C, N and P). We attempted to collect up to eight larvae of available stages from each wetland and larvae were placed in individual chambers. Water for the chambers was collected from the littoral zone, where the larval anurans had been collected. The water was filtered using a geo-pump (GeoTech Environmental Equipment Inc., Denver, Colorado, USA) and in-line filter housing with an ashed 47 mm GF/F filter (0.7 μm pore size) (EMD Millipore, Billerica, Massachusetts, USA). The filtrate was collected in a Nalgene 20 L carboy (Nalgene Nunc International Corp., Rochester, New York, USA) to homogenize the background nutrient concentrations and 250–350 mL of filtered water was placed in each of the (five control chambers and five or more treatment chambers) experimental chambers (Ball Jar Co., Broomfield, Colorado, USA). Chambers were placed in the littoral zone for incubation to reduce thermal stress. After ∼60 min of incubation, larvae were removed and collected for tissue chemistry (see above). We measured water temperature pre- and post- incubation using an YSI Pro Plus multiparameter meter (YSI Inc., Yellow Springs, Ohio, USA) and recorded the average of the two measurements. Following the assay, the experimental chambers were transported to the lab on ice and the sample water was immediately filtered a second time through a pre-weighed ashed 47 mm GF/F filter (0.7 μm pore size) to separate excreted (i.e. filtrate) and egested fractions. Filtrate collected for ammonium analysis was preserved using phenol and analyzed within 30 days of collection (Solorzano Citation1969). Filtrate collected for total dissolved nitrogen (TDN) and phosphorus (TDP) was frozen and analyzed (following a persulfate digestion). All water chemistry analyses were performed using a Lachat QuickChem +8500 Series 2 FIA System flow injection analyzer (Hach Company, Loveland, Colorado, USA). Egestion samples were analyzed for %C, %N and %P following the same method as used for algal stoichiometry and tissue stoichiometry (described above). Mass-specific excretion and egestion rates were calculated by dividing the observed excretion or egestion rate by the mass (in grams) of each individual.
Statistical analysis
To examine whether the dry mass and tissue stoichiometry of larval L. sphenocephalus differed across the three developmental stage categories we used a one-way analysis of variance (ANOVA) with stage as the factor. All significant ANOVAs were followed by a Tukey’s Honestly Significant Difference (HSD) test to evaluate pairwise comparisons between stage categories. Our excretion and egestion data violated the parametric assumption of homogeneity of variance, so Kruskall–Wallis tests were used to test for differences in mass-specific excretion and egestion rates across stage categories. Significant Kruskall–Wallis results were followed by a Wilcoxon test to evaluate pairwise comparisons between stage categories. We used linear regression to evaluate the effects of log10 body size on log10 per capita excretion rates and log10 per capita egestion rates and ratios. Multiple linear regression was used to examine the relationship between excretion (N:P) and egestion (C:N, C:P, N:P) stoichiometry, tissue stoichiometry (C:N, C:P, N:P) and resource (algal) stoichiometry (C:N, C:P, N:P). Data were natural-log transformed to meet assumptions of normality when necessary. Outliers were removed for algal %P and for both per capita and mass-specific excretion and egestion rates using the Tukey’s method (Seo Citation2006). The significance level was based on α < 0.05. All analyses were performed using R 3.3.2 (R Core Team Citation2016).
Results
Larval anuran collection
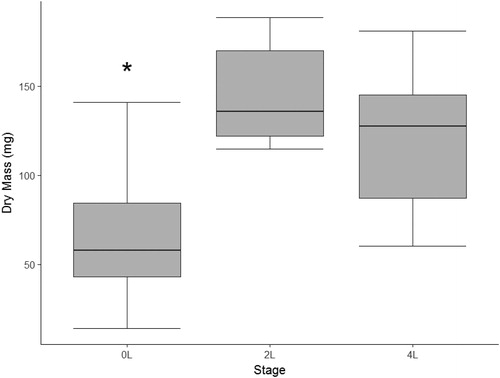
We collected 41 L. sphenocephalus larvae (24 stage 0L, 10 stage 2L and 7 stage 4L) at our study wetlands. Average captures were 11.5 ± 1.5 stage 0L per wetland, 5 stage 2L, and 3.5 ± 2 stage 4L. We collected 0L staged individuals mostly early in the year (February–April), but had some captures later in the year as well (May–June). Most of our captures for 2L individuals occurred in April, and all of our stage 4L individuals were collected in the early summer (May–June). Captures of stage 2L and 4L larvae were low due to the difficulty in capturing individuals in these stages, which last only a short time before emergence from the wetland (Cayuela et al. Citation2012). Larval anurans varied in mass across stages with 2L and 4L individuals being significantly greater in mass than 0L individuals (, ANOVA, F2,38=22.94, p<.00001). The 4L staged individuals tended to be lighter than the 2L individuals, but not significantly (Tukey HSD, p=.26).
Figure 1. Dry mass of three developmental stage categories of free-ranging larval southern leopard frogs (Lithobates sphenocephalus) from geographically isolated wetlands in southwestern, Georgia, USA, from February to July 2016. The asterisk indicates a significant difference.
Resource and tissue stoichiometry
The stoichiometry of algal resources is presented in . We found that larval anuran tissue stoichiometry differed across the three developmental stage categories (). Percent C in larval tissue (range: 42–51%) increased between stages 0L–2L (, ANOVA, F2,38=4.566, p=.02; Tukey HSD, p=.047) and 0L–4L (Tukey HSD, p=.049), but did not vary between 2L and 4L (Tukey HSD, p=.97). Percent N (range: 8–13%) was similar across stages (, ANOVA, F2,38=0.98, p=.39), while %P (range: 0.3–2%) increased significantly between 0L and 4L (; ANOVA, F2,38=10.55, p<.001; Tukey HSD, p=.0001) and 2L–4L (Tukey HSD, p=.006). Tissue C:N did not vary across any of the stages (, ANOVA, F2,38=0.08). Tissue C:P decreased between stages 0L–4L (, ANOVA, F2,38=4.04, p=.03; Tukey HSD, p=.02), but did not differ between 0L–2L and 2L–4L. Tissue N:P decreased significantly between stages 0L–4L (, ANOVA, F2,38=5.303, p=.01; Tukey HSD, p=.008), but did not differ between 0L–2L and 2L–4L. Tissue %Ca did not differ significantly across stages (ANOVA, F2,14=3.26, p=.07), but appeared to increase with advancing stage category (mean: 0L = 0.97, 2L = 2.08, 4L = 2.65, overall mean = 1.88) (see Supplement 2, ; Supplement 2, ).
Figure 2. Tissue chemistry (A–C) and molar ratios (D–F) across three developmental stage categories of free-ranging larval southern leopard frogs (Lithobates sphenocephalus) from geographically isolated wetlands in southwestern, Georgia, USA, from February to July 2016. Different letters indicate pair-wise differences in stages as indicated by Wilcoxon rank-sum tests and the absence of letters indicates no significant differences among stages.
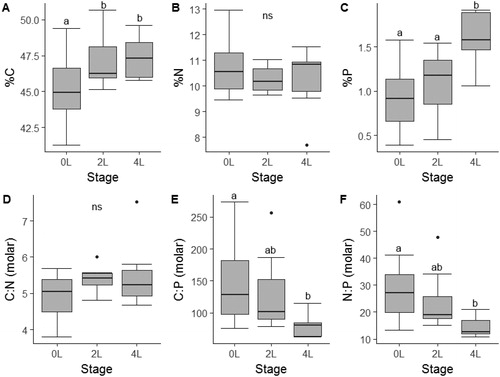
Table 1. Resource (algal) stoichiometry in geographically isolated wetlands in southwestern, Georgia, USA.
Excretion stoichiometry and rates
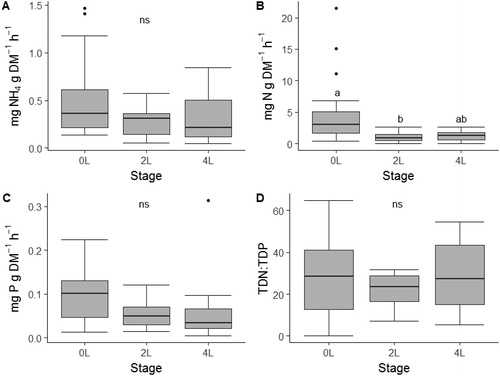
NH4-N excretion did not vary due to stage (; ; ANOVA, F2,38=1.832, p=.17), but TDN excretion did vary across stages with 0L having higher excretion rates than the 2L staged individuals (, ANOVA, F2,38=2.667, p<.05). TDP excretion also did not significantly vary across stages (; ; ANOVA, F2,38=1.824, p = 0.18). Excretion N:P did not differ due to stage (; ANOVA, F2,38=0.36, p=.70).
Figure 3. Mass-specific nutrient excretion rates (A–C) and stoichiometric ratios (D–F) across three developmental stage categories of free-ranging larval southern leopard frogs (Lithobates sphenocephalus) from geographically isolated wetlands in southwestern, Georgia, USA, from February to July 2016. Different letters indicate pair-wise differences in stages as indicated by Wilcoxon rank sum tests and the absence of letters indicates no significant differences among stages.
Per capita NH4-N excretion showed a significant positive relationship to body size, but did not explain much variation in the data (Supplementary Figure 3A; GLM, Adj. r2=0.05, p=.01, y = 1.24x − 0.53). In contrast, per capita TDN excretion (Supplementary Figure 3B; GLM, Adj. r2 = −0.004, p=.45), per capita TDP excretion (Supplementary Figure 3C; GLM, Adj. r2 =0.01, p=.12), and per capita excretion N:P were not related body size (Supplementary Figure 3D; GLM, Adj. r2 =0.03, p=.87).
Egestion stoichiometry and rates
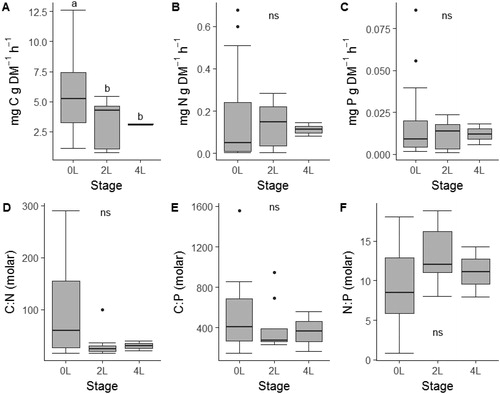
Development stage did not predict larval anuran bulk quantity and nutrient-specific egestion rates (), and no significant differences were detected across stage categories for nutrient specific estimates. Total mass-specific egestion rate varied across stages [Kruskal–Wallis (K–W), H2=11.77, p=.003], with significant decreases between stages 0L and 2L (Wilcoxon, p=.004). Mass-specific C egestion rate was significantly related to stage (, K–W, H2=14.8, p=.0006) with the 0L stage having a significantly higher C egestion rate than the 2L and 4L stages (Wilcoxon, p<.001). Neither N egestion rate (, K–W, H2=0.35, p=.84) nor P egestion rate (, K–W, H2=1.9, p=.39) differed among stages. Egestion rate C:N (, K–W, H2=3.79, p = 0.15), C:P (, K–W, H2=1.61, p=.44), and N:P (, K–W, H2=4.59, p = 0.10) did not differ across stages.
Figure 4. Mass-specific egestion rates (A–C) and stoichiometric ratios (D–F) across three developmental stage categories of free-ranging larval southern leopard frogs (Lithobates sphenocephalus) from geographically isolated wetlands in southwestern, Georgia, USA, from February to July 2016. Different letters indicate pair-wise differences in stages as indicated by Wilcoxon rank sum tests and the absence of letters indicates no significant differences among stages.
Per capita egestion rates were not closely linked to larval anuran body size for bulk quantity and nutrient specific rates. Bulk quantity egestion rates increased with body size, but it was a weak relationship (GLM, Adj. r2=0.07, p=.005, y = 0.51x + 0.74). However, C egestion rate did not vary significantly with body size (; GLM, Adj. r2= 0.04, p=.28). N egestion rates had a weak, but significant positive relationship with body size (; GLM, Adj. r2=0.16, p=.02, y = 1.63x − 5.313). P egestion rates were not predicted by body size (; GLM, Adj. r2=0.04, p=.24). Egestion rate C:N (; GLM, Adj. r2=0.27, p<.01, y= −1.26x + 4.26) and egestion C:P (; GLM, Adj. r2=0.12, p =.001, y= −0.56x + 2.09) were negatively related to body size, but egestion rate N:P had a positive relationship with body size (; GLM, Adj. r2=0.16, p=.02, y = 0.77x – 0.66). Egestion rate C:P, however, was not related to body size.
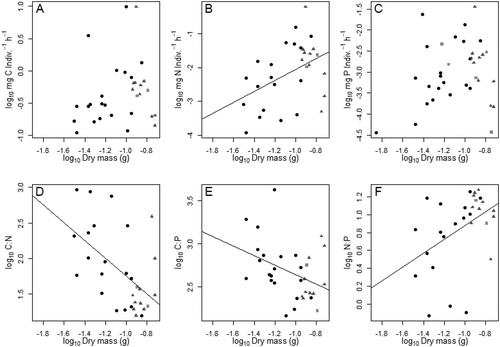
Figure 5. Nutrient specific per capita egestion rates (A–C) and stoichiometry (D–F) regressed over body size (dry mass in grams) of free-ranging larval southern leopard frogs (Lithobates sphenocephalus) from geographically isolated wetlands in southwestern, Georgia, USA, from February to July 2016. Adjusted R-squared values are presented. Solid circles represent individuals in stage 0L (no legs), triangles represent 2L (hind limbs only) and squares represent 4L (both hind and front limbs).
Excretion, resource, and tissue stoichiometry relationships
Excretion N:P was positively related to algal N:P, and negatively related to tissue N:P (GLM; Adj. r2=0.10, p=.01). Egestion C:N (GLM, r2=0.02, p=.16), C:P (GLM, r2= −0.03, p=.95), and N:P (GLM, r2=0.02, p=.17) were not predicted by tissue stoichiometry or resource stoichiometry.
Discussion
We found that body tissue, excretion and egestion stoichiometry varied due to both developmental stage and body size in larval L. sphenocephalus, but stage played the most prominent role in determining stoichiometric patterns. While mass-corrected excretion and egestion were linked to stage, per capita NH4-N excretion and egestion of N and P were also related to body size. Explicit testing of stoichiometric relationships of waste products, resources and homeostatic demands indicate developing anurans fall within the predictions of ES. The fact that we examined these relationships in temporally variable aquatic habitats (i.e. GIWs), which typically produce relatively large densities of breeding amphibians (Gibbons et al. Citation2006) and can be nutrient poor (Atkinson et al. Citation2011; Battle and Golladay Citation2001), suggests larval anurans have the potential to affect nutrient dynamics in these ecosystems.
Tissue stoichiometry
Specifically, our results for increasing body P support those of previous studies indicating that as bone density increases with development, tissue P content in larval anurans increases (Stephens et al. Citation2017; Tiegs et al. Citation2016). While not statistically significant, tissue %Ca increased with stage and corresponded to increases in %P and P:Ca decreased (Supplement 3, ). Given the importance of both Ca and P for bone development, these results suggest that increased P content at late stages is likely due to bone development (Sterner and Elser Citation2002). In contrast, excretion of P (TDP) did not differ across stages, which suggests a consistently high demand for P throughout development. Phosphorus is in high demand during early stages of growth and development for rRNA transcription (Sterner and Elser Citation2002). While the P demand for rRNA generally decreases as body size increases (Sterner and Elser Citation2002), P demand for production of bone tissue increases substantially late in development in larval anurans, leading to a high homeostatic demand for P across the entire larval period.
We observed increases in tissue %C content across development stages. A limited number of studies have measured tissue C in larval anurans (Liess et al. Citation2013), and no studies have specifically evaluated tissue C across development stages. The increase in C content across development stages is likely due to increased lipid storage as larvae approach emergence, which is important for winter survival (Liess et al. Citation2013). We observed no significant variation in tissue %N across stages. This was largely consistent with findings by Tiegs et al. (Citation2016), who reported a slight increase in %N across development stages in wood frogs (Lithobates sylvaticus). Increased tissue N content in larvae of other anuran species is primarily attributed to increased muscle mass throughout development (Stephens et al. Citation2017; Tiegs et al. Citation2016).
Larval L. sphenocephalus had similar stoichiometric ratios compared to those reported for other aquatic taxa. The average tissue molar ratios (C:N, C:P and N:P) found in this study are also consistent with those of other taxa (i.e. fish, mayflies, caddisflies) ranging ±10 molar ratio units for C:N (range: 5–7; range: 3–15 in this study), ±100 molar ratio units for C:P (range: 25–376; range: 62–273 in this study) and ±10 molar ratio units for N:P (range: 6–60; range: 9–60 in this study) (Back et al. Citation2008; Back and King Citation2013; Evans-White et al. Citation2005; Kendrick and Benstead Citation2013; Vanni et al. Citation2002). The lack of variation in tissue N content across development stages in this study is consistent with that of invertebrates including mayflies (Back et al. Citation2008). Compared to the results from Vanni et al. Citation2002, tissue %C in larval L. sphenocephalus was slightly lower than observed in fish (∼10% lower C), tissue %N was similar (±10% N) and tissue %P was lower (see below) (McIntyre and Flecker Citation2010; Vanni et al. Citation2002). Maximum % P in this study (1.91%) was comparable to that observed in emergent juvenile frogs (∼2.5%P; Capps et al. 2015), but lower than %P content observed in fish (>5%P; Vanni et al. Citation2002). This difference is likely attributed to P found in fish scales, and the bone structure found in some fishes. Across development stages, however, the magnitude of change in nutrient content is most extreme in anurans (Tiegs et al. Citation2016, this study) compared to that reported for other organisms (Back et al. Citation2008; Back and King Citation2013; Vanni et al. Citation2002).
Excretion and egestion by larval anurans
Nitrogen excretion decreased across developmental stages of L. sphenocephalus and generally followed patterns found in prior studies (Stephens et al. Citation2017; Tiegs et al. Citation2016). NH4-N excretion did not vary across stages, but TDN excretion generally declined with stage. These results indicate that potential increases in homeostatic N demands across development are influencing the decrease in N excretion across stages. The proportion of NH4-N accounted for in the TDN excretion rate raises some uncertainly regarding the dominant form of N being excreted by larval anurans. While aquatic organisms generally excrete mostly NH4-N, terrestrial organisms excrete more complex forms of N, and adult amphibians primarily excrete urea (Hill et al. Citation2004), and here egest high quantities of C, N and P as found in other studies (Norlin et al. Citation2016). Given that larval anurans ultimately transition to semi-terrestrial organisms (i.e. juvenile and adult stages), the specific form of N excreted by larvae may be predominantly other forms (i.e. NH3, CH4N2O), and could potentially change throughout larval development.
In this study, excretion N:P was negatively related to tissue N:P and positively related to algal N:P; a central prediction of consumer-driven nutrient recycling within the ES framework (Sterner and Elser Citation2002). ES suggests that in the absence of growth, waste N:P (i.e. excretion and egestion) should be identical to resource N:P; therefore, it is reasonable to predict that excretion by larval anurans may stray from the predictions of consumer-driven nutrient dynamics (Vanni and McIntyre Citation2016). Our results provide support that ES remains a strong framework for predicting consumer-driven nutrient dynamics for larval anurans, even with changing homeostatic demands (or ‘rheostasis’ suggested by Stephens et al. Citation2017).
Though excretion stoichiometry (i.e. N:P) followed predictions of ES in our study, P excretion rate did not decline at the 4L stage (i.e. high %P), which suggests some inconsistency with ES. Similar results were observed in Vanni and McIntyre (Citation2016), who found that tissue P had no consistent effect on P excretion among vertebrate taxa. Furthermore, the aforementioned study generally observed higher excretion rates (5.6-fold more P) for vertebrate taxa. Our finding that the P excretion rate did not decline in the 4L stage may also be related to elevated glucocorticoids from physiological stress, which can be particularly common in late stage larvae (Kirschman et al. Citation2017). Elevated glucocorticoids can cause resorption of bone and reduction in tissue P, which could be reflected in a stable P excretion rate. Disparities between predictions of ES and the excretion rates observed in this study suggests that additional information is needed on feeding (i.e. ingestion) rates across development (Vanni and McIntyre Citation2016), which would likely explain the inconsistency between egestion rates and ES predictions. Larval anurans have long digestive tracts to allow for extended gut passage time and increased assimilation of low-quality resources (McDiarmid and Altig Citation1999). Larvae could potentially trade high assimilation efficiency of resources for rapid consumption of high-quality resources. This would lead to relatively high egestion rates of C, N and P, independent of tissue stoichiometric demands. This hypothesis is supported by the positive relationship for bulk egestion rate, N egestion rate and P egestion rate with body size observed in this study.
Conclusions
There is increasing interest in determining the functional role of larval anurans. Similar to energetic models of emerging aquatic macroinvertebrates (Kautza and Sullivan Citation2016), emerging juvenile anurans may provide an important subsidy from aquatic to terrestrial ecosystems (Capps et al. Citation2015b; Polis et al. Citation1997). Furthermore, these subsidies may contribute to the role of GIWs as hotspots of biological activity (McClain et al. Citation2003) and energetic exchange across ecosystems boundaries (Gratton and Zanden Citation2009; Marcarelli et al. Citation2011; Nakano and Murakami Citation2001; Smith et al. Citation2017). Future work measuring the emergence success of these organisms is needed to begin to quantify these fluxes and appreciate their significance as a cross-ecosystem subsidy.
Our study provides strong supporting evidence to previous laboratory studies showing that tissue chemistry, excretion and egestion are generally linked to development stage in larval anurans. Our results support the theory of ES in that the mass-balance of producing anatomical traits (i.e. bone) should aid in predicting tissue and excretion stoichiometry, which has important implications for nutrient recycling and transfer of energy and nutrients across aquatic-terrestrial boundaries. Meeting the energetic and nutrient demands is important for development, body size at metamorphosis, survival and fecundity (Sweeney et al. Citation1986), which have important implications for long term population dynamics of these species (Berven Citation1990). Studies addressing factors that influence the conservation of an imperiled species group such as amphibians (Evans et al. Citation2016), as well as enhancing our understanding of ecological theory in the context of organisms with complex lifecycles, aids the development of future research. To solidify our understanding of these processes, subsequent studies across a wide range of amphibian species are needed, as species-specific life history, behavior and development rates may greatly influence these results. This is especially relevant to southeastern GIWs which are particularly species-rich, supporting >20 species of anurans (Smith et al. Citation2006). Here, we show that one common species of anuran requires higher body P during development, but it is one species within the community, thus more work is necessary to understand the role of community-level dynamics on nutrient cycling in these systems.
Notes on contributors
Each of the authors assisted in field collection of data used in this manuscript and each author contributed to writing, editing, and preparation of this manuscript. Laboratory analyses were performed by S. McLeay. Statistical analyses were done by C. Atkinson and S. McLeay.
Acknowledgments
We thank members of herpetology, plant ecology, and aquatics laboratories at the Joseph W. Jones Ecological Research Center for assisting in both field collection and laboratory processing. We thank Stephen W. Golladay at the Joseph W. Jones Ecological Research Center at Ichauway and Jonathan P. Benstead at University of Alabama for review of this article. This study was conducted under University of Alabama Animal Care and Use Committee (protocol # 15-10-0110) and Georgia Scientific Collecting Permit (Permit # 29-WJH-16-58).
Disclosure statement
No potential conflict of interest was reported by the authors.
Additional information
Funding
References
- Abrams PA, Leimar O, Nylin S, Wiklund C. 1996. The effect of flexible growth rates on optimal sizes and development times in a seasonal environment. Am Natur. 147(3):381–395.
- Allen AP, Gillooly JF. 2009. Towards an integration of ecological stoichiometry and the metabolic theory of ecology to better understand nutrient cycling [Article]. Ecol Lett. 12(5):369–384.
- Altig R, McDiarmid RW. 2015. Handbook of larval amphibians of the United States and Canada. Ithaca (NY): Cornell University Press.
- Altig R, Whiles MR, Taylor CL. 2007. What do tadpoles really eat? Assessing the trophic status of an understudied and imperiled group of consumers in freshwater habitats. Freshwater Biol. 52(2):386–395.
- Atkinson CL, Golladay SW, First MR. 2011. Water quality and planktonic microbial assemblages of isolated wetlands in an agricultural landscape. Wetlands. 31(5):885.
- Atkinson CL, Capps KA, Rugenski AT, Vanni MJ. 2017a. Consumer‐driven nutrient dynamics in freshwater ecosystems: from individuals to ecosystems. Biol Rev. 92(4):2003–2023.
- Atkinson CL, Golladay SW, Smith LL. 2017b. Larval anuran stable isotope signatures and stoichiometry across multiple geographically isolated wetlands in the southeastern United States. Southeastern Nat. 16(1):87–104.
- Back JA, King RS. 2013. Sex and size matter: ontogenetic patterns of nutrient content of aquatic insects. Freshwater Sci. 32(3):837–848.
- Back JA, Taylor JM, King RS, Fallert KL, Hintzen EH. 2008. Ontogenic differences in mayfly stoichiometry influence growth rates in response to phosphorus enrichment. Fund App Lim. 171(3):233–240.
- Battle J, Golladay SW. 2001. Water quality and macroinvertebrate assemblages in three types of seasonally inundated limesink wetlands in southwest Georgia. J Freshwater Ecol. 16(2):189–207.
- Berven KA. 1990. Factors affecting population fluctuations in larval and adult stages of the wood frog (Rana sylvatica). Ecology. 71(4):1599–1608.
- Boring LR. 2001. The Joseph W. Jones Ecological Research Center: co-directed applied and basic research in the private sector. In: Barrett GW, Barrett TL, editors. Holistic science: the evolution of the Georgia Institute of Ecology (1940–2000). New York, New York: Taylor and Francis; p. 233–258.
- Capps KA, Atkinson CL, Rugenski AT. 2015a. Implications of species addition and decline for nutrient dynamics in fresh waters. Freshwater Sci. 34(2):485–496.
- Capps KA, Berven KA, Tiegs SD. 2015b. Modelling nutrient transport and transformation by pool‐breeding amphibians in forested landscapes using a 21‐year dataset. Freshwater Biol. 60(3):500–511.
- Carreira BM, Segurado P, Orizaola G, Gonçalves N, Pinto V, Laurila A, Rebelo R. 2016. Warm vegetarians? Heat waves and diet shifts in tadpoles. Ecology. 97(11):2964–2974.
- Cayuela H, Besnard A, Bechet A, Devictor V, Olivier A. 2012. Reproductive dynamics of three amphibian species in Mediterranean wetlands: the role of local precipitation and hydrological regimes. Freshwater Biol. 57(12):2629–2640.
- Close B, Banister K, Baumans V, Bernoth EM, Bromage N, Bunyan J, Erhardt W, Flecknell P, Gregory N, Hackbarth H, et al. 1997. Recommendations for euthanasia of experimental animals: part 2. DGXT of the European Commission. Lab Anim. 31(1):1–32.
- Costello DM, Michel MJ. 2013. Predator-induced defenses in tadpoles confound body stoichiometry predictions of the general stress paradigm . Ecology. 94(10):2229–2236.
- Crump ML. 1989. Effect of habitat drying on developmental time and size at metamorphosis in Hyla pseudopuma. Copeia. 1989(3):794–797.
- Dodds WK, Whiles M. 2002. Freshwater ecology: concepts and environmental applications. Cambridge, Massachusetts: Academic Press.
- Duffy EJ, Beauchamp DA, Sweeting RM, Beamish RJ, Brennan JS. 2010. Ontogenetic diet shifts of juvenile Chinook salmon in nearshore and offshore habitats of Puget Sound. Trans Am Fish Soc. 139(3):803–823.
- Elser JJ, Dobberfuhl DR, MacKay NA, Schampel JH. 1996. Organism size, life history, and N: P stoichiometry toward a unified view of cellular and ecosystem processes. BioScience. 46(9):674–684.
- Evans DM, Che-Castaldo JP, Crouse D, Davis FW, Epanchin-Niell R, Flather CH, Frohlich KR, Goble DD, Li Y-W, Male TD. 2016. Species recovery in the United States: increasing the effectiveness of the Endangered Species Act. Issu Ecol. 20(20):1–28.
- Evans-White MA, Stelzer RS, Lamberti GA. 2005. Taxonomic and regional patterns in benthic macroinvertebrate elemental composition in streams. Freshwater Biol. 50(11):1786–1799.
- Fritz KA, Whiles MR. 2018. Amphibian‐mediated nutrient fluxes across aquatic–terrestrial boundaries of temporary wetlands. Freshwater Biol. 63(10):1250–1259.
- Frost PC, Benstead JP, Cross WF, Hillebrand H, Larson JH, Xenopoulos MA, Yoshida T. 2006. Threshold elemental ratios of carbon and phosphorus in aquatic consumers. Ecol Lett. 9(7):774–779.
- Gibbons WJ. 2003. Terrestrial habitat: a vital component for herpetofauna of isolated wetlands. Wetlands. 23(3):630–635.2.0.CO;2]
- Gibbons JW, Winne CT, Scott DE, Willson JD, Glaudas X, Andrews KM, Todd BD, Fedewa LA, Wilkinson L, Tsaliagos RN, et al. 2006. Remarkable amphibian biomass and abundance in an isolated wetland: implications for wetland conservation. Conserv Biol. 20(5):1457–1465.
- Gómez-Rodríguez C, Díaz-Paniagua C, Serrano L, Florencio M, Portheault A. 2009. Mediterranean temporary ponds as amphibian breeding habitats: the importance of preserving pond networks. Aquat Ecol. 43(4):1179.
- Gonçalves AM, Santos LFJ, Santana CC, Colosio RR, Pizauro JM. 2015. Activity of tail phosphatases: a Study during growth and metamorphosis of Lithobates catesbeianus. Copeia. 103(3):634–638.
- Gosner KL. 1960. A simplified table for staging anuran embryos and larvae with notes on identification. Herpetologica. 16(3):183–190.
- Gratton C, Zanden MJ. 2009. Flux of aquatic insect productivity to land: comparison of lentic and lotic ecosystems. Ecology. 90(10):2689–2699.
- Gunzburger MS. 2007. Evaluation of seven aquatic sampling methods for amphibians and other aquatic fauna. Appl Herpetol. 4(1):47–63.
- Hill RW, Wyse GA, Anderson M. 2004. Animal physiology. Vol. 2. Sunderland, Massachusetts: Sinauer Associates.
- Hourdry J, L’Hermite A, Ferrand R. 1996. Changes in the digestive tract and feeding behavior of anuran amphibians during metamorphosis. Physiol Zool. 69(2):219–251.
- Jackson JK, Fisher SG. 1986. Secondary production, emergence, and export of aquatic insects of a Sonoran Desert stream. Ecology. 67(3):629–638.
- Kautza A, Sullivan SMP. 2016. The energetic contributions of aquatic primary producers to terrestrial food webs in a mid‐size river system. Ecology. 97(3):694–705.
- Kemp NE, Hoyt JA. 1969. Sequence of ossification in the skeleton of growing and metamorphosing tadpoles of Rana pipiens. J Morphol. 129(4):415–443.
- Kendrick MR, Benstead JP. 2013. Temperature and nutrient availability interact to mediate growth and body stoichiometry in a detritivorous stream insect. Freshwater Biol. 58(9):1820–1830.
- Kirkman KL, Charles Goebel P, West L, Drew MB, Palik BJ. 2000. Depressional wetland vegetation types: a question of plant community development. Wetlands. 20(2):373–385.2.0.CO;2]
- Kirkman LK, Smith LL, Golladay SW, Batzer D, Baldwin A. 2012. Southeastern depressional wetlands. In: Batzer DP, Baldwin AH, editors. Wetland habitats of North America: ecology and conservation concerns. Oakland, California: University of California Press; p. 203–215.
- Kirschman LJ, McCue MD, Boyles JG, Warne RW. 2017. Exogenous stress hormones alter energetic and nutrient costs of development and metamorphosis. Journal of Experimental Biology. 220(18):3391–3397.
- Kupferberg S. 1997. Facilitation of periphyton production by tadpole grazing: functional differences between species. Freshwater Biol. 37(2):427–439.
- Lecchini D, Galzin R. 2005. Spatial repartition and ontogenetic shifts in habitat use by coral reef fishes (Moorea, French Polynesia). Mar Biol. 147(1):47–58.
- Liess A, Rowe O, Guo J, Thomsson G, Lind MI. 2013. Hot tadpoles from cold environments need more nutrients-life history and stoichiometry reflects latitudinal adaptation. J Anim Ecol. 82(6):1316–1325.
- Liner AE, Smith LL, Golladay SW, Castleberry SB, Gibbons JW. 2008. Amphibian distributions within three types of isolated wetlands in southwest Georgia. Am Midland Natur. 160(1):69–81.
- Marcarelli AM, Baxter CV, Mineau MM, Hall RO. 2011. Quantity and quality: unifying food web and ecosystem perspectives on the role of resource subsidies in freshwaters. Ecology. 92(6):1215–1225.
- McClain ME, Boyer EW, Dent CL, Gergel SE, Grimm NB, Groffman PM, Hart SC, Harvey JW, Johnston CA, Mayorga E, et al. 2003. Biogeochemical hot spots and hot moments at the interface of terrestrial and aquatic ecosystems. Ecosystems. 6(4):301–312.
- McDiarmid RW, Altig R. 1999. Tadpoles: the biology of anuran larvae. Chicago: University of Chicago Press.
- McIntyre PB, Flecker AS. 2010. Ecological stoichiometry as an integrative framework in stream fish ecology. Am Fish Soc Symp. 73:539–558.
- Nakano S, Murakami M. 2001. Reciprocal subsidies: dynamic interdependence between terrestrial and aquatic food webs. Proc Natl Acad Sci. 98(1):166–170.
- Norlin L, Byström P, Karlsson J, Johansson M, Liess A. 2016. Climate change will alter amphibian–mediated nutrient pathways: evidence from Rana temporaria tadpoles in experimental ponds. Freshwater biology. 61(4):472–485.
- Opsahl SP, Golladay SW, Smith LL, Allums SE. 2010. Resource-consumer relationships and baseline stable isotopic signatures of food webs in isolated wetlands. Wetlands. 30(6):1213–1224.
- Polis GA, Anderson WB, Holt RD. 1997. Toward an integration of landscape and food web ecology: the dynamics of spatially subsidized food webs. Annu Rev Ecol Syst. 28(1):289–316.
- R Core Team. 2016. R: A language and environment for statistical computing. Vienna, Austria: R Foundation for Statistical Computing.
- Reiners WA. 1986. Complementary models for ecosystems. Am Natur. 127(1):59–73.
- Russell KR, Guynn DC, Hanlin HG. 2002. Importance of small isolated wetlands for herpetofaunal diversity in managed, young growth forests in the coastal plain of South Carolina. Forest Ecol Manage. 163(1-3):43–59.
- Seo S. 2006. A review and comparison of methods for detecting outliers in univariate data sets. Pittsburgh, Pennsylvania: University of Pittsburgh.
- Showalter AM, Vanni MJ, González MJ. 2016. Ontogenetic diet shifts produce trade‐offs in elemental imbalance in bluegill sunfish. Freshwater Biol. 61(5):800–813.
- Smith LL, Steen DA, Stober JM, Freeman MC, Golladay SW, Conner LM, Cochrane J. 2006. The vertebrate fauna of Ichauway, Baker County, GA. Southeastern Natur. 5(4):599–620.2.0.CO;2]
- Smith LL, Subalusky AL, Atkinson CL, Kirkman LK. 2017. Geographically isolated wetlands: embedded habitats in longleaf pine forests. In: Kirkman LK, Jack SB, editors. Ecology and restoration of the longleaf pine ecosystem. Boca Raton, FL: CRC Press.
- Solorzano L. 1969. Determination of ammonia in natural waters by the phenolhypochlorite method [Dissertação de Mestrado]. Universidade Estadual da Paraíba.
- Solorzano L, Sharp JH. 1980. Determination of total dissolved phosphorus and particulate phosphorus in natural waters. Limnol Oceanogr. 25(4):754–758.
- Stephens JP, Stoler AB, Sckrabulis JP, Fetzer AJ, Berven KA, Tiegs SD, Raffel TR. 2017. Ontogenetic changes in sensitivity to nutrient limitation of tadpole growth. Oecologia. 183(1):263–273.
- Sterner RW, Elser JJ. 2002. Ecological stoichiometry: the biology of elements from molecules to the biosphere. Princeton, New Jersey: Princeton University Press.
- Sweeney BW, Vannote RL, Dodds PJ. 1986. Effects of temperature and food quality on growth and development of a mayfly, Leptophlebia intermedia. Can J Fish Aquat Sci. 43(1):12–18.
- Tiegs SD, Berven KA, Carmack DJ, Capps KA. 2016. Stoichiometric implications of a biphasic life cycle. Oecologia. 180(3):853–863.
- Tiner RW. 2003. Geographically isolated wetlands of the United States. Wetlands. 23(3):494–516.2.0.CO;2]
- Vanni MJ. 2002. Nutrient cycling by animals in freshwater ecosystems. Annu Rev Ecol Syst. 33(1):341–370.
- Vanni MJ, Flecker AS, Hood JM, Headworth JL. 2002. Stoichiometry of nutrient recycling by vertebrates in a tropical stream: linking species identity and ecosystem processes. Ecol Lett. 5(2):285–293.
- Vanni MJ, McIntyre PB. 2016. Predicting nutrient excretion of aquatic animals with metabolic ecology and ecological stoichiometry: a global synthesis. Ecology. 97(12):3460–3471.
- Whiles MR, Gladyshev MI, Sushchik NN, Makhutova ON, Kalachova GS, Peterson SD, Regester KJ. 2010. Fatty acid analyses reveal high degrees of omnivory and dietary plasticity in pond‐dwelling tadpoles. Freshwater Biol. 55(7):1533–1547.