
 ?Mathematical formulae have been encoded as MathML and are displayed in this HTML version using MathJax in order to improve their display. Uncheck the box to turn MathJax off. This feature requires Javascript. Click on a formula to zoom.
Abstract
During the last century, the majority of Swedish rivers were heavily channelized to facilitate timber floating. This dramatically altered in-stream habitat by reducing the structural heterogeneity and increasing water velocity, which in turn had effects on the aquatic fauna. Today, extensive efforts to restore channelized rivers are being made by adding boulders to the streambed. In northern boreal rivers, evaluations of such restorations are often based on the response of trout and salmon populations. Few studies have investigated the effect on European grayling (Thymallus thymallus L), despite it being an important and vulnerable gamefish in both North America and Europe. This 6-year study investigated the effect of streambed restoration on grayling in a channelized, regulated (hydro-peaking) river in northern Sweden open to recreational fisheries. No effects on habitat preference, size, body condition, abundance or survival of grayling could be detected. The results are discussed based on grayling habitat preferences and behaviour, and give perspectives on streambed restoration in river conditions common to many Scandinavian grayling rivers today. The study is one of very few that presents multiyear abundance and survival estimates of grayling in a large boreal river.
Introduction
During the timber floating era, rivers and streams were heavily channelized to facilitate timber transportation (Törnlund and Ostlund Citation2002; Nilsson et al. Citation2005). The removal of boulders and natural structures from the streambed resulted in reduced spatial heterogeneity, faster and less diverse water velocities and decreased depth due to the loss of impounding structures (Nilsson et al. Citation2005; Palm Citation2007). An immediate consequence of this was a decrease in habitats providing good feeding conditions, cover and spawning conditions for popular game fish such as brown trout (Salmo trutta) and Atlantic salmon (Salmo salar) (Lepori et al. Citation2005), and these habitat alterations have been reported as main contributors to the observed low survival and population densities of brown trout in channelized streams (Chapman and Knudsen Citation1980; Jutila et al. Citation1998; Palm Citation2007). Efforts to rehabilitate channelized river habitats are ongoing both in Sweden and internationally (Roni et al. Citation2002; Nilsson et al. Citation2005; Roni Citation2005). By placing boulders and woody debris back into the stream, one seeks to increase structural heterogeneity and hence increase the amount of rearing and nursing habitats for stream-dwelling salmonids (Lepori et al. Citation2005; Kemp Citation2010). The effect of such streambed restorations has overwhelmingly been evaluated based on the response of salmon or trout populations, and positive effects on these salmonids have been demonstrated in several studies, both in Sweden (Näslund Citation1989; Palm Citation2007) and globally (Roni et al. Citation2002; Roni Citation2005).
Surprisingly few studies have investigated the effect of timber floating on European grayling (Thymallus thymallus L) and Arctic grayling (Thymallus arcticus Pallas) populations (Northcote Citation1995), despite them being important gamefish residing in the same riverine habitat as trout and salmon. Hubbs and Lagler (Citation1958) reported that log driving was a major cause of the decline of Arctic grayling in Michigan. Similarly, channelization is thought to have affected grayling populations negatively in rivers in northern Sweden (Näslund Citation1999). Evaluation of habitat restorations also rarely focuses on the response of grayling populations (Mäki-Petäys et al. Citation2000; Vehanen et al. Citation2003). Both juvenile and adult European grayling have different habitat requirements and behaviour than brown trout and Atlantic salmon, and may hence respond differently to instream restoration techniques proven effective for trout (Mäki-Petäys et al. Citation2000). For example, grayling are reported to be less territorial, more inclined to reside and forage in groups of conspecifics, and be more flexible in habitat preference regarding substrate and water velocities, compared to brown trout (Muller Citation1961; Persson and Walter Citation1981; Greenberg et al. Citation1996; Degerman et al. Citation2000; Nykänen et al. Citation2001; Riley et al. Citation2006). This makes the response of grayling to streambed restoration difficult to predict.
A number of indicators can be used to evaluate the effect of habitat restoration on fish (Roni et al. Citation2018). A common restoration goal is to increase population density; however, such a population response may take many years to detect and require substantial monitoring efforts. Effects on survival, as well as on physical parameters, such as size and body condition may be detected more rapidly, and could signal change in habitat quality following restoration. But, these endpoints could also indirectly reflect changes in population abundance due to density dependent effects. Behavioural changes following restorations, such as in the activity and habitat occupancy of the fish, may indicate restoration effects on habitat quality, and such behavioural responses may potentially be observed immediately after restoration (Lindell Citation2008).
In this study, we investigated the effect of streambed restoration on European grayling in a channelized river in Northern Sweden, by measuring the abundance, survival, size, body-condition and habitat preferences of grayling at two different sites over 6 years: 3 years before restoration and 3 years after.
Material and methods
Study area
River Ljusnan originates from the mountain-range along the Norwegian/Swedish border and runs across the center of Sweden, flowing into the Bothian Sea (N 61°12, E 17°08) (). It is 440 km long, with a catchment area of 19,800 km2 and an average annual mean flow of 226 m3s−1 at the river mouth. Most of the river basin is heavily regulated, counting 18 hydropower stations in the main stem alone. During the timber floating era, Ljusnan and the majority of its tributaries was converted into floatways and heavily channelized (Thorfve Citation2002).
Figure 1. (a) The catchment area of River Ljusnan, Sweden. (b) The location of the study sites Forsnäset and Hovrahällan in the main-stem of Ljusnan. Hydropower stations are marked with black dots. (c) Close-up of the studied sections. In the shaded sections boulders were added in 2003.
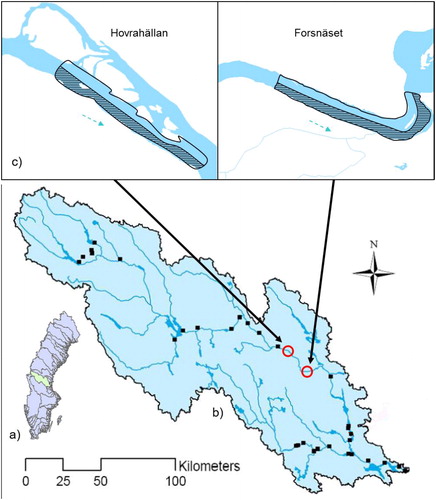
The study was located in two sections of the river, Malmmyraströmmen, Forsnäset (1600 m long, 110 m wide), and Hovrahällan (1500 m long, 150 m wide), located 20 km apart and approximately 150 km upstream from the sea (Forsnäset: N 61° 49' 11.01", E 16° 0' 57.12", Hovrahällan: N 61° 52' 36.83", E 15° 44' 55.19"; ). Both sections are situated between two hydropower stations, Laforsen, 10 km upstream Hovrahällan, and Tevsjön, 45 km downstream Forsnäset, neither station allowing for upstream fish migration (Rivinoja et al. Citation2010). In both sections, the diurnal flow-regime is characterized by short-term fluctuations in water-level (hydro-peaking), responding to the intensity of power-production in Laforsen. Annual flow-regimes do not follow the natural cycle of unregulated boreal rivers and these sections generally have a reduced or absent spring-flood, very low summer-water and a relatively high flow during winter (Thorfve Citation2002; Rivinoja et al. Citation2010). Mean annual flow below Laforsen hydropower station is approximately 149 m3/s. Prevalent water-velocities range between 0.3 and 0.7 m/s in both sections. The dominant streambed substrate is boulder-sized (>200 mm), followed by cobble-sized (20–200 mm). Based on water velocity and substrate, both sections are classified as a suitable habitat for salmonids (Thorfve Citation2002, using criteria described in Molin et al. Citation2010). Average depth is 0.9 m in Forsnäset and 0.7 m in Hovrahällan. Apart from European grayling, Eurasian dace (Leuciscus leuciscus L) occurs commonly in both sections. Stationary brown trout (Salmo trutta L), Eurasian perch (Perca fluviatilis L), roach (Rutilus rutilus L), pike (Esox lucius L), bullhead (Cottus gobio L) and burbot (Lota lota L) occur more sparsely. The habitat immediately upstream and downstream of both sections consists of slower and deeper water, classified as unproductive and non-suitable salmonid habitat (Thorve Citation2002) An area with calmer water runs parallel to Hovrahällan on the northern shore (). The minimum harvest size for the recreational fishery of grayling in both Forsnäset and Hovrahällan is 25 cm.
Both study sections were heavily channelized during the timber floating era. All substrate that hindered the timber transport has either blasted out of the streambed or bulldozed to the edges of the channel. The banks of both sections hence consisted of boulders, rocks and gravel originally belonging in the streambed of the river. In 2003, 53% (9.2 ha) of Forsnäset and 50% (9.0 ha) of Hovrahällan was physically restored by adding approximately 100,000–150,000 tons of boulders, stones and gravel to the streambed of each respective section. The remainder of the sections, 47% (8.0 ha) of Forsnäset and 50% (9.0 ha) of Hovrahällan, was not restored. The dividing line between the two parts (restored and not restored) runs across the middle of the sections, the restored part extending on the southern side and the non-restored part extending on the northern side in both , superimposed). The added substrate was structured in weirs and boulder clusters to increase habitat complexity, pool frequency and pool depth.
Data collection
Fish sampling was conducted by electrofishing in September each year from 2001 to 2006. A gas-powered Smith-Root unit that generated pulsed direct current (60 Hz, 1.6 A, 1000 V) was used, mounted on a boat specially adapted to electrofishing. Fishing was conducted in an identical way in both sections by driving the boat downstream in repeated parallel runs, covering approximately 4 m broad segments of the stream each run. Fish shocked by the electric current were caught with nets by two people standing in front of the boat. All caught fish were measured (TL in mm) and weighed (g). Catch location (i.e. at the restored or the control section) for each fish was recorded. Each fish was closely inspected for injuries and abnormalities.
To estimate abundance, two samplings (separated by 6–7 days) per section were performed each year. On the first occasion, all graylings above 180 mm (∼ >2 years old) were anaesthetized with MS-222 and marked with Floy anchor-tags anchored in the muscle tissue immediately behind the dorsal fin. The tags allowed for individual identification. After marking, the fish were placed in a water-filled tank for recovery. When the fishing was completed, all individuals were released at approximately the same location they had been caught. The fishing procedures were repeated during the second occasion, but this time no fish were marked. All fish caught, both marked and unmarked, were recorded during all occasions. Individual fish were only marked once during the study period.
Analytical overview
The analytical approach to evaluate effect of restoration differed depending on the parameter investigated. Effect of restoration on habitat occupancy was analyzed based on a before–after control-impact (BACI) design, using an interaction model (a difference-in-difference (DiD) approach). The habitat occupancy data represented a snap-shot in time of where the grayling resided, that is, in either of the two sections (control/restored). Although the grayling could move between the sections, multiple such snap-shots of habitat occupancy over time, both before and after restoration, will serve as an indicator of which of the sections the grayling preferred, and whether this preference differed before and after restoration. Effect of restoration on the size, body condition, abundance and survival of grayling was analyzed by comparing data only before and after restoration, that is, no consideration was made to what section the grayling resided in. This was motivated by the potential mobility of the grayling between sections, which makes evaluation of restoration effects on parameters requiring long response time (e.g. abundance) more relevant at whole population level rather than between sections.
Statistical inference on the effect of size, body condition and habitat occupancy was done using tests of significance (based on p-values), whereas abundance and survival was evaluated based on model selection using an information theoretical approach. The latter approach was the default inference method in the mark-recapture software that was used (Program Mark, White and Burnham Citation1999).
Effect of restoration on size, body condition and habitat occupancy
The effect of restoration on size and body condition was tested using a general linear mixed model (LMM), treating either length or body condition as a normal distributed response variables; and “restoration” as dummy-coded explanatory variable equal to 1 if observations were from the time-period after restoration and 0 if observations were from the time-period before restoration. Year was added as a random effect to account for dependence between observations within year. To investigate general trends in size and body condition over the study period, the variables were modeled against year using linear regression. All fish captured on both sampling occasions each year were used in the analysis comparing length and body condition between sections. Body condition was quantified by Fulton’s condition factor (K); (Ricker Citation1975; Nash et al. Citation2006). As European grayling grow allometrically (Northcote Citation1995), a meaningful use of Fulton’s condition indices will only apply if comparing individuals of approximately the same length or if your samples have similar length distribution (Wootton Citation1998). To account for this, annual variation in condition was investigated for fish in three narrow size ranges (150–200 mm, 200–250 mm and 250–300 mm). When evaluating condition in this way, the Fulton’s index is valid to detect trends in condition over time (Meretsky et al. Citation2000; He et al. Citation2008).
The effect of restoration on grayling habitat preference (defined as the number of grayling occupying a either a restored or not-restored river section) was evaluated using a replicated BACI experimental design (Downes et al. Citation2002). BACI-designs can be tested using a DiD approach. A DiD estimator estimates the effect of a treatment (i.e. restoration) on the treated object (i.e. the part of the river that was restored) by using pre- and post-treatment time-series data of both the treated object and a non-treated (control) object. The DiD estimator is the difference between the observed post-restoration outcome of the restored section and the assumed outcome of the restored section if no restoration had occurred (). Because DiD estimation technique uses pre- and post-treatment time-series data of both a treated and a control object, it is less biased than an approach where the pre- and post-treatment data of only the treated object were compared (a ‘within subject’ approach that cannot account for a possible confounding trend over time) or an approach in which the treated object was compared only to a control object (a ‘between subject’ approach that cannot account for possible permanent difference between the treated and the control object).
Figure 2. The regression model estimating the difference-in-difference estimator of the effect of boulder addition on the number of fish occupying the treated river section in Forsnäset, and the graphical visualization of the parameter estimates. Black dots represent average values for the control section before and after boulder addition, and white dots average values for the section that was treated. Y is the number of fish at observation I occupying river section s at time t. The model was setup with river section as a binary (dummy coded) variable equal to 1 if the observations are from the river section eventually to be treated, and equal to 0 if observations are from the control section, time as a binary variable equal to 1 if observations were from the time-period after boulder addition and 0 if observations were from the time-period before boulder addition. The regression coefficient α then estimates the number of fish occupying the control section before boulder addition and β estimates the before boulder addition difference between the control section and the section eventually to be treated. δ is the difference-in-difference estimator of the effect of boulder addition and estimates the difference between the observed number of fish in the treated section after boulder addition and the predicted number of fish if no boulder addition had occurred (i.e. assuming the control and the treated section followed the same time trend). Shaded grey line represents the restoration event.
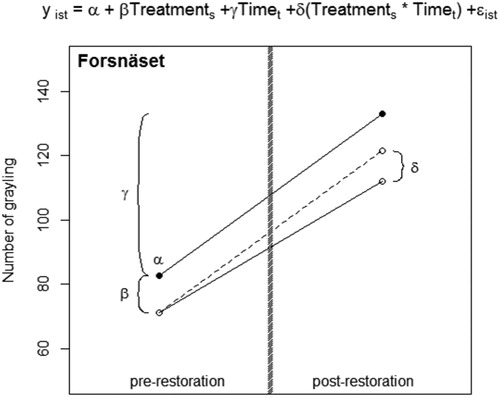
The DiD estimator was estimated using a two-way general LMM, treating the number of grayling occupying a section as normal distributed response variables; ‘river-section’ as a binary (dummy coded) explanatory variable equal to 1 if the observations were from the river section eventually to be restored and equal to 0 if observations were from the control section; ‘time’ as a binary explanatory variable equal to 1 if observations were from the time-period after restoration and 0 if observations were from the time-period before restoration. Year was added as a random effect to account for dependence between observations within year. The fixed effect part of the model was formulated as
where Y is either the number of grayling at observation i (i.e. sampling occasion) occupying river section s at time t, α the estimate of the number of fish occupying the control section before-restoration, β the estimate of the before restoration difference between the control section and the section eventually to be restored and δ the DiD estimator of the effect of restoration on the restored section. Analyses were performed in the statistical program R (R Development Core Team Citation2017), using library ‘nlme’ (Pinheiro et al. Citation2010).
The number of grayling (>18 cm) caught at each river section during each sampling occasion every year was used to evaluate the number of grayling occupying restored or not-restored sections before and after restoration.
Abundance and survival estimation
The study design generated data suitable to be analyzed with mark-resight models. Unlike mark-recapture methods, mark-resight models incorporate encounters of unmarked individuals into the estimation framework. Abundance and apparent survival over years were simultaneously estimated using a full likelihood robust design (Kendall et al. Citation1995) adapted to handle mark-resight data (McClintock and White Citation2009). The robust design utilizes the combined approach of closed (abundance) and open (apparent survival) population models, increasing the level of information as well as providing advantages in estimation precision compared to single use of models (Pollock et al. Citation1990; Kendall et al. Citation1995).
Each river section was modeled separately. As there was migration between the restored and control part of each section, it was not feasible to make a distinction between treatments in the estimation of absolute abundance and survival. Hence, abundance and survival were estimated for both parts (restored and control) taken together as one. This has two implications when evaluating the effect of restoration: (1) No control group exists, and hence only before and after restoration effects could be evaluated. This ‘within subject’ approach is weaker than the DiD approach due to not being able to account for possible confounding trends over time. (2) Restoration implies that only approximately 50% of the total section was restored (i.e. the treated section was restored and not the control).
The data were structured into six primary occasions (years) between which the population was assumed open to geographic and demographic changes (births, deaths, migration). Each primary occasion consisted of two closely spaced secondary occasions (marking and resighting) between which the population was assumed closed. As the exact number of marked individuals residing in the population was unknown for all years except the first, a zero-truncated Poisson log-normal mixed effect estimator (McClintock et al. Citation2009) was applied, using the freeware package Program Mark (White and Burnham Citation1999). With only two secondary occasions per primary occasion and ‘without replacement’ observations, the data could be considered spares and care was taken to avoid overfitting of models. The first primary occasion provided our best estimate of mean resight rate (α) as the number of marked individuals residing in the population was known during the closed secondary interval. This estimate of α was then used for all other sampling occasions, hence assuming trivial temporal variation in resighting probabilities over occasions and years. Individual heterogeneity (σ) was modeled as either fixed or ignored. Emigration and immigration were assumed random or fixed. Apparent survival was specified as either constant or time-dependent. Restoration was included as a dummy-coded covariant (present/absent).
Based on combinations of these parameterizations, different models were fitted to the data in order to investigate variation in abundance and apparent survival over years and to examine the impact of the in-stream restoration efforts on apparent survival. The models were compared using Akaike information criteria (AIC) adjusted for small sample sizes (Burnham and Anderson Citation2002). The selection was made in two steps. First, the best (most parsimonious) parameterization for individual heterogeneity and migration was derived. This model-structure was then used to compare models with or without restoration effect on apparent survival. To account for uncertainty in the model selection, estimations of abundance and apparent survival were generated through model-averaging. A linear regression analysis was performed to test for trends in abundance and survival over years.
Results
In total, 5731 graylings were caught during the study, 2225 in Forsnäset and 2506 in Hovrahällan. In Forsnäset, 1926 graylings were over 180 mm. Of these, 1051 individuals were tagged, of which 183 were recaptured once, 23 were recaptured twice and 4 were recaptured three times. In Hovrahällan, 2025 graylings were over 180 mm, of which 935 individuals were tagged. About 133 were recaptured once, 19 were recaptured twice and 3 were recaptured three times in Hovrahällan. Average length (TL) was 235 mm in Forsnäset and 225 mm in Hovrahällan.
About 39 individuals died during handling (constituting 1.0% of all fish over 180 mm). Tag-loss was estimated to 2%, based on observation of recaptured fish (38 individuals) where tags visually could be confirmed lost (i.e. scars where tags had been anchored, half tags etc.). About 8% of all captured grayling between 17 and 30 cm in Forsnäset, and 6% in Hovrahällan, had mouth injuries derived from being captured by angling (see Northcote Citation1995).
Effect of restoration on occupancy, size and body condition
There was no effect of restoration on the number of European grayling occupying a river section before and after restoration in either Forsnäset (LMM, the interaction term: F1,16 = 0.1, p = 0.76) or Hovrahällan (LMM, the interaction term: F1,16 = 0.66, p = 0.43), and in average, there was an estimated 9.9% decrease in propensity of European grayling to occupy a river section after it had been restored (Hovrahällan 10.6%, Forsnäset 8.5% – ). Similarly, no effect of restoration could be found on the average length in Forsnäset (LMM, F1,2545 = 0.33, p = 0.59) or Hovrahällan (LMM, F1,2681 = 0.2, p = 0.68), and no trend in length over years was found (p > 0.05). No significant effect of restoration on body condition could be found in the three size classes (Forsnäset: 150–200 mm, F1,416 = 6.7, p = 0.061; 200–250 mm, F1,872 = 2.9, p = 0.16; 250–300 mm, F1,638 = 2.2, p = 0.21. Hovrahällan: 150–200 mm, F1,655 = 0.06, p = 0.82; 200–250 mm, F1,704 = 1.35, p = 0.3; 250–300 mm, F1,536 = 1.2, p = 0.33).
Abundance and survival estimates
Forsnäset
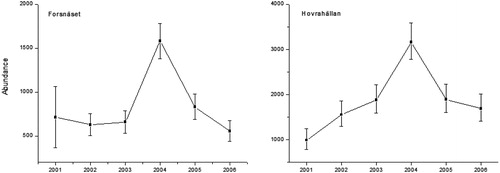
Five models where fitted to the data, and the most parsimonious structure contained fixed migration and immigration parameters (ψemigration = 0.46 ± 0.06, ψimmigration = 0.20 ± 0.16), no individual heterogenity (σ = 0) and time-dependent apparent survival. The estimated mean resight-rate (α) was 0.151 ± 0.034 (SE). Estimates of apparent survival ranged between 0.32 in 2001/2002 and 0.56 in 2003/2004 (). The variation was high, and all of the CI for the point-estimates overlapped (). A model that included restoration effect on apparent survival generated a lower AIC score compared to a reduced model (618.8 vs. 620.0). However, as the differences in AIC were less than two, the models were considered to have equal weight in the data and an effect of restoration on apparent survival could hence not be established (Burnham and Anderson Citation2002). Abundance estimates ranged between 553 individuals (33 per ha−1) in 2006 and 1581 (93 per ha−1) in 2004 (; ). No trend in abundance over time could be detected (p = 0.84).
Figure 3. Apparent survival (mean ± 95% confidence intervals) of European grayling (>180 mm) in Forsnäset and Hovrahällan estimated over 1-year periods between 2001 and 2006.
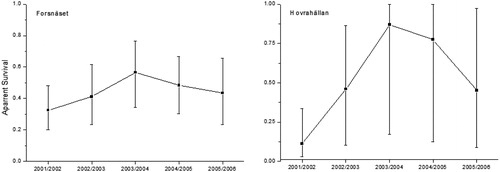
Figure 4. Estimated abundance (mean ± 95% confidence intervals) of Eurasian Grayling (>180 mm) per year in Forsnäset (16 ha) and Hovrahällan (17 ha).
Hovrahällan
The best model contained the same model structure as Forsnäset (parameter estimates of ψemigration = 0.32 ± 0.35, ψimmigration = 0.79 ± 0.56 and α = 0.07). Estimates of apparent survival ranged between 0.12 in 2001/2002 and 0.86 in 2003/2004 (; ). A model that included restoration effect on apparent survival had less weight in the data compared to a reduced model (ΔAIC = 5.2). Abundance estimates ranged between 3152 individuals (189 ha−1) in 2004 and 988 (59 ha−1) in 2001 (; ). No trend over time could be detected (p = 0.5).
Discussion
This study could not establish any significant effect of streambed restoration on the preference of European grayling to occupy restored habitat. Neither could any impact of restoration on the size and body condition of grayling be found. Furthermore, restoration was not found to have an effect on survival and abundances based on before and after data.
Few studies have investigated the effect of habitat restoration on European grayling or Arctic grayling (Northcote Citation1995; Mäki-Petäys et al. Citation2000; Vehanen et al. Citation2003). Grayling utilize many different riverine habitats during its life-history, from shallow shorelines and backwaters as larvae, to pools, riffles and runs as feeding juveniles and adults (West et al. Citation1992; Sempeski and Gaudin Citation1995; Northcote Citation1995), suggesting that increased habitat heterogeneity would be beneficial to grayling populations. Vehanen et al. (Citation2003) tracked adult grayling using radio telemetry and reported that grayling preferred a restored (structurally more complex) section of a river compared to an unrestored section, indicating that streambed restoration creates favorable habitat conditions for grayling. Furthermore, Nilsson et al. (Citation2005) predicted positive effects of habitat restoration on grayling populations as increased habitat heterogeneity may lead to increased biodiversity and production of invertebrates in restored habitat. Based on this, there is a plausible rationale to expect positive response of grayling to habitat restoration and the absence of effects seen in this study was not expected. Below we discuss potential reasons for this observed lack of effect.
Many studies report positive effects on juvenile and adult trout and salmon populations following instream-restoration efforts (e.g. Näslund Citation1989; van Zyll De Jong et al. Citation1997; Palm Citation2007). One biological process underlying this positive effect may be that increased structural heterogeneity increases the number of available territories for fish, allowing more trout to find protection and feeding positions (Palm Citation2007; Kemp Citation2010). Both adult and juvenile trout establish and defend feeding territories (Klemetsen et al. Citation2003) and the amount of available territories may regulate a trout population in a stream (Elliott Citation1994; Milner et al. Citation2003). Although grayling establish feeding hierarchies, they do not defend individual feeding grounds as fiercely as trout or salmon (Hughes Citation1992; Northcote Citation1995; Greenberg Citation1999; Klemetsen et al. Citation2003). Grayling also seem to be less tied to cover substrate than trout (Greenberg et al. Citation1996), and Mäki-Petäys et al. (Citation2000) reported that 0+ grayling utilize the cover of in-stream structure to a lower degree than 0+ trout. Such behavioural differences may make the effect of increased streambed heterogeneity less pronounced in grayling than in trout. Grayling are also known to be more flexible in their habitat preferences (Greenberg et al. Citation1996; Riley et al. Citation2006). For example, studies have reported larger grayling (>20 cm) to prefer water velocities from 0.1 to 0.8 m/s (Greenberg Citation1999; Vehanen et al. Citation2003; Riley et al. Citation2006), in contrast to the more narrow ranges preferred by trout and salmon (Armstrong et al. Citation2003). Furthermore, several studies could not distinguish a clear preference for certain substrates, or have reported a wide range of preferred substrate, suggesting grayling to be a generalist regarding substrate composition (Greenberg et al. Citation1996; Mallet et al. Citation2000; Vehanen et al. Citation2003; Riley et al. Citation2006; Riley et al. Citation2009). Flexibility in habitat use may make grayling less sensitive to habitat degradation caused by channelization compared to brown trout or Atlantic salmon, and this may explain the lack of positive effects of streambed restoration seen in this study.
Based on what parameter you investigate, results from in-stream restoration may need up to 10 years before being detectable (Roni et al. Citation2002). Apparent effects on abundance may take particularly long time to detect due to generational lag times in population growth, especially at low abundances (Elliott Citation1994). This study compared population data 3 years before restoration with 3 years after restoration and it is therefore possible that the lack of response seen in this study is because not enough time had passed since restoration. Still, a change in a parameter such as habitat occupancy is driven by behaviour and would likely be detectable shortly after the habitat is restored. The fact that no such change was detected indicated that the restoration did not improve the habitat to such an extent that grayling altered its habitat preference compared to unrestored habitat.
The study sections in our study were open to recreational fishing. Grayling are considered more vulnerable to angling than other salmonids (Northcote Citation1995; Linökken Citation1995), and high fishing pressure may reduce both the average size and the abundance of their population (Clark Citation1992; Näslund et al. Citation2005). As reliable catch data are missing, it is difficult to evaluate the impact of angling on the results seen in this study. However, there is no indication that the fishing pressure has dramatically changed over the years, and there was no trend in the proportion of grayling with mouth injuries over the 6 years the study was conducted. It is likely that the low average length reported from both sections (235 mm and 225 mm) is a direct consequence of the minimum size limit set by the fishing regulations (250 mm). Hence, a positive restoration effect on length may have been constrained by the size limit set by the harvest regulation.
Our study was conducted in a regulated river with hydropeaking flow conditions. Flow regulation is known to have a negative effect on salmonid populations by reducing available habitat and increasing stress (Young et al. Citation2011), and it is possible that the impact of flow regulation may have masked, or reduced, the effect of streambed restoration in our study. The few studies investigating the impact of impoundment and flow regulation on European grayling report contrasting results. Auer et al. (Citation2017) found increased risk of stranding of juvenile European grayling following nocturnal hydropeaking events, and Vehanen et al. (Citation2003) claimed that the effect of impoundment and flow regulation had nullified the natural reproduction of grayling in a regulated river in northern Finland. Contrarily, Thorfve (Citation1995) could not detect any clear negative effect of flow regulation on grayling in a northern Swedish river, and even reported positive effects on growth, possibly due to stabilized winter temperatures. Kriström et al. (Citation2010) also found grayling to have higher growth in regulated rivers compared to unregulated. Henricson (Citation1984) and Gönczi et al. (Citation1986) suggested that flow regulation had a lower influence on grayling compared to trout, owing to the greater flexibility in habitat preferences of grayling. In our study, hydropeaking conditions at the study sites are regulated by water-right court rulings and therefore have been largely similar between the years. A more detailed investigation regarding the effect of flow regulation has to be conducted in order to make reliable conclusions.
This study is one of very few reporting abundance and survival estimates of grayling in large boreal rivers. Although the study did not find any effect of restoration on the grayling populations, the abundance and survival estimates reported still provide important information in the management and conservation of European grayling in boreal Scandinavian rivers. The abundance estimates in this study are lower compared to estimates from rivers with very low fishing pressure (Henricson Citation1984; Näslund et al. Citation2005), suggesting that the outtake from recreational fisheries may suppress the population at the study sites and not allow it to respond positively to the restoration efforts. Henricson (Citation1984) reported densities of grayling above >20 cm to be 111 ha−1 in a regulated river in northern Sweden, a number regarded very high compared to other estimates of grayling densities (Northcote Citation1995), and also considerably higher than the average abundance seen in this study. However, Näslund et al. (Citation2005), estimated number of graylings above >20 cm to 449 individuals ha−1 in an unregulated river in the same geographical region as the Henricson (Citation1984) study, and such high densities suggests absence of flow regulation to be beneficial for grayling. Few estimates of survival of adult grayling have been published. In a long-term study, Buzby and Deegan (Citation2004) estimated the average annual survival of adult grayling in a remote, unexploited Alaskan river to be 0.71 ± 0.05 (min= 0.39, max = 1.0) and suggested this figure to act as a baseline against which anthropogenic effects may be evaluated. Compared to Buzby and Deegan (Citation2004), the average survival was lower in our study and this may be a consequence of the anthropogenic impact from channelization, flow regulation and/or recreational fisheries.
Although large efforts are made to restore channelized streams in Sweden (Nilsson et al. Citation2005), it is important to evaluate the effect of such restoration in the context of other anthropogenic disturbances. The combination of channelized riverbeds, flow regulation and high fishing pressure is today common in many Swedish grayling rivers. Identifying what factors limit the populations in these environments is important in order to prioritize what restoration actions should be taken (Roni et al. Citation2002). The positive effects of streambed restoration may be undetectable if not hydrological processes are restored first or if harvest mortality from fishing is poorly regulated. Future studies should focus on identifying what factors limit salmonid populations in these highly disturbed ecosystems in order to decide what restoration measures should be prioritized.
Acknowledgements
We thank Anders Bruks for valuable help in collecting the data.
Disclosure statement
No potential conflict of interest was reported by the authors.
Additional information
Notes on contributors
Gustav Hellström
Gustav Hellström is an assistant professor in fish biology. He run the statistical analysis and wrote the mansuscript.
Daniel Palm
Daniel Palm is a fish biologist. He helped with the writing and analysis.
Tomas Brodin
Tomas Brodin is a professor in animal behavior. He helped with the writing and analysis.
Peter Rivinoja
Peter Rivinoja is a fish biologist. He helped with the writing and analysis.
Mikael Carlstein
Micael Carlstein is a fish biologist. He designed the study and collected the data.
Related Research Data
References
- Armstrong JD, Kemp PS, Kennedy GJA, Ladle M, Milner NJ. 2003. Habitat requirements of Atlantic salmon and brown trout in rivers and streams. Fish Res. 62(2):143–170.
- Auer S, Zeiringer B, Führer S, Tonolla D, Schmutz S. 2017. Effects of river bank heterogeneity and time of day on drift and stranding of juvenile European grayling (Thymallus L.) caused by hydropeaking. Sci Total Environ. 575:1515–1521. pp
- Burnham KP, Anderson DR. 2002. Model selection and multi-model inference: a practical information-theoretic approach. New York (NY): Springer.
- Buzby KM, Deegan LA. 2004. Long-term survival of adult Arctic grayling (Thymallus arcticus) in the Kuparuk River, Alaska. Can J Fish Aquat Sci. 61(10):1954–1964.
- Chapman DW, Knudsen E. 1980. Channelization and livestock impacts on salmonid habitat and biomass in Western Washington. Trans Am Fish Soc. 109(4):357–363.
- Clark RA. 1992. Influence of stream flows and stock size on recruitment of Arctic grayling (Thymallus arcticus) in the Chena River, Alaska. Can J Fish Aquat Sci. 49(5):1027–1034.
- Degerman E, Näslund I, Sers B. 2000. Stream habitat use and diet of juvenile (0+) brown trout and grayling in sympatry. Ecol Freshwater Fish. 9(4):191–201.
- Downes BJ, Barmuta LA, Fairweather PG, Faith DP, Keough MJ, Lake PS, Mapstone BD, Quinn GP. 2002. Monitoring ecological impacts: concepts and practice in flowing waters. Cambridge (UK): Cambridge University Press.
- Elliott JM. 1994. Quantitative ecology and the brown trout. Oxford (UK): Oxford University. Press.
- Gönczi A, Henricsson J, Sjöberg G. 1986. Fiskervård i älvmagasin (in Swedish), Fiskeriverket Informerar (Technical Report). Sweden: Swedish Board of Fisheries.
- Greenberg L. 1999. Effects of predation and discharge on habitat use by brown trout, Salmo trutta, and grayling, Thymallus, in artificial streams. Freshwater Biol. 145(4):433–446.
- Greenberg L, Svendsen P, Harby A. 1996. Availability of microhabitats and their use by brown trout (Salmo trutta) and grayling (Thymallus thymallus) in the River Vojmån, Sweden. Regul Rivers Res Manage. 12:287–303.
- He J, Bence J, Johnson J, Clapp D, Ebener M. 2008. Modeling variation in mass-length relations and condition indices of Lake Trout and Chinook Salmon in Lake Huron: a hierarchical Bayesian approach. Trans Am Fish Soc. 137(3):801–817.
- Henricson J. 1984. Harrbeståndets storlek I ett kraftverksmagasin i Indalsälven uppskattad med fångst-återfångstmetoder (in Swedish). Fiskeriverket Informerar (Technical Report). Sweden: Swedish Board of Fisheries.
- Hubbs C, Lagler KF. 1958. Fishes of the Great Lakes region. Ann Arbor (MI): University of Michigan Press.
- Hughes NF. 1992. Ranking of feeding positions by drift-feeding Arctic grayling (Thymallus arcticus) in dominance hierarchies. Can J Fish Aquat Sci. 49(10):1994–1998.
- Jutila E, Ahvonen A, Laamanen M, Koskiniemi J. 1998. Adverse impact of forestry on fish and fisheries in stream environments of the Isojoki basin, western Finland. Boreal Environ Res. 3:395–404.
- Kemp P. 2010. In-channel placement of structure to enhance habitat complexity and connectivity for stream-dwelling salmonids. Salmonid Fisheries. Oxford (UK): Wiley-Blackwell.
- Kendall WL, Pollock KH, Brownie C. 1995. A likelihood-based approach to capture-recapture estimation of demographic parameters under the robust design. Biometrics. 51(1):293–308.
- Klemetsen A, Amundsen PA, Dempson JB, Jonsson B, Jonsson N, O'Connell MF, Mortensen E. 2003. Atlantic salmon Salmo salar L., brown trout Salmo trutta L. and Arctic charr Salvelinus alpinus (L.): a review of aspects of their life histories. Ecol Freshwater Fish. 12(1):1–59.
- Kriström B, Raneby B, Greenberg L, Calles O, Paulrud A, Leonardsson K. 2010. Hydropower - Environmental impacts, mitigation measures and costs in regulated waters (Technical Report No. 10:90). Elforsk.
- Lepori F, Palm D, Brännäs E, Malmqvist B. 2005. Does restoration of structural heterogeneity in streams enhance fish and macroinvertebrate diversity?. Ecol Appl. 15(6):2060–2071.
- Lindell C. 2008. The value of animal behavior in evaluations of restoration success. Restor Eco. 16(2):197–203.
- Linökken A. 1995. Angling pressure, yield and catch per effort of grayling, Thymallus (L)., and brown trout, Salmo trutta L., on the rivers Glomma and Rena, southeastern Norway. Fish Manage Ecol. 2:249–262. doi:10.1111/j.1365-2400.1995.tb00117.x.
- Mallet JP, Lamouroux N, Sagnes P, Persat H. 2000. Habitat preferences of European grayling in a medium size stream, the Ain river, France. J Fish Biol. 56(6):1312–1326.
- McClintock BT, White GC. 2009. A less field-intensive robust design for estimating demographic parameters with mark–resight data. Ecology. 90(2):313–320.
- McClintock BT, White GC, Antolin MF, Tripp DW. 2009. Estimating abundance using mark-resight when sampling is with replacement or the number of marked individuals is unknown. Biometrics. 65(1):237–246.
- Meretsky VJ, Valdez RA, Douglas ME, Brouder MJ, Gorman OT, Marsh PC. 2000. Spatiotemporal variation in length–weight relationships of endangered humpback chub: implications for conservation and management. Trans Am Fish Soc. 129(2):419–428.
- Milner NJ, Elliott JM, Armstrong JD, Gardiner R, Welton JS, Ladle M. 2003. The natural control of salmon and trout populations in streams. Fish Res. 62(2):111–125.
- Molin J, Kagervall A, Rivinoja PK. 2010. Linking habitat characteristics with juvenile density to quantify Salmo salar and Salmo trutta smolt production in the river Sävarån, Sweden. Fish Manage Ecol. 17(5):446–453.
- Muller K. 1961. Die Biologie der ächen (Thymallus thymallus) im Luleå älv (Swedish Lappland) (in German. Zeitschrift Fur Fischerei Und Deren Hilfswissenschaften. 10:173–200.
- Mäki-Petäys A, Vehanen T, Muotka T. 2000. Microhabitat use by age-0 brown trout and grayling: seasonal responses to streambed restoration under different flows. Trans Am Fish Soc. 129(3):771–781.
- Nash RDM, Valencia AH, Geffen AJ. 2006. The origin of Fulton’s condition factor—setting the record straight. Fisheries. 31:236–238.
- Nilsson C, Lepori F, Malmqvist B, Törnlund E, Hjerdt N, Helfield JM, Palm D, Östergren J, Jansson R, Brännäs E, Lundqvist H. 2005. Forecasting environmental responses to restoration of rivers used as log floatways: an interdisciplinary challenge. Ecosystems. 8(7):779–800.
- Northcote TG. 1995. Comparative biology and management of Arctic and European grayling (Salmonidae, Thymallus). Rev Fish Biol Fish. 5(2):141–194.
- Nykänen M, Huusko A, Mäki-Petäys A. 2001. Seasonal changes in the habitat use and movements of adult European grayling in a large subarctic river. J Fish Biol. 58:506–519.
- Näslund I. 1989. Effects of habitat improvement on the brown trout, Salmo trutta L., population of a northern Swedish stream. Aquacult Res. 20(4):463–474.
- Näslund I. 1999. Fisheries, forestry and watersheds (in Swedish). Swedish board of Fisheries. Ammeråprojektet.
- Näslund I, Nordwall F, Eriksson T, Hannersjö D, Eriksson LO. 2005. Long-term responses of a stream-dwelling grayling population to restrictive fishing regulations. Fish Res. 72(2–3):323–332.
- Palm D. 2007. Restoration of streams used for timber floating: egg to fry survival, fry displacement, over-wintering and population density of juvenile brown trout (Salmo trutta L.) [PhD thesis]. Swedish University of Agricultural Sciences.
- Persson BG, Walter U. 1981. Harren i två kraftverksmagasin - en studie av näringsval, ålder och tillväxt (in Swedish). Fiskeriverket Informerar (Technical Report). Sweden: Swedish Board of Fisheries.
- Pinheiro J, Bates D, DebRoy S, Sarkar D. and the R Development Core Team. 2010. nlme: linear and nonlinear mixed effects models. R Package Version. 3.1–97. https://CRAN.R-project.org/package=nlme
- Pollock KH, Nichols JD, Brownie C, Hines JE. 1990. Statistical inference for capture-recapture experiments. Wildlife Monographs. 3–97.
- R Development Core Team. 2017. R: a language and environment for statistical computing. R Foundation for Statistical Computing, Vienna, Austria. ISBN 3-900051-07-0, http://www.R-project.org.
- Ricker WE. 1975. Computation and interpretation of biological statistics of fish populations: Bulletin of the Fisheries Research Board of Canada. Vol. 191. Fisheries Research Board of Canada. Blackburn Press.
- Riley WD, Ives MJ, Pawson MG, Maxwell DL. 2006. Seasonal variation in habitat use by salmon, Salmo salar, trout, Salmo trutta and grayling, Thymallus, in a chalk stream. Fish Manage Ecol. 13(4):221–236.
- Riley WD, Maxwell DL, Pawson MG, Ives MJ. 2009. The effects of low summer flow on wild salmon (Salmo salar), trout (Salmo trutta) and grayling (Thymallus thymallus) in a small stream. Freshwater Biol. 54(12):2581–2599.
- Rivinoja P, Calles O, Thorfve S, Lundqvist H, Leonardsson K. 2010. Assessment of potential passage probabilities and reproduction areas for Atlantic salmon (Salmo salar L.) in the fragmented regulated River Ljusnan-A baseline of hypothetical scenarios for eco-eco analyses. (Technical report). Dept. Wildlife, Fish, and Environmental studies, Swedish University of Agricultural Studies, Umeå 2010.
- Roni P. 2005. Habitat rehabilitation for inland fisheries: global review of effectiveness and guidance for rehabilitation of freshwater ecosystems (Fisheries Technical Paper No. 484). Rome, Italy: Food and Agriculture Organization of the United Nations (FAO).
- Roni P, Anders P, Beechie T, Kaplowe D. 2018. Review of tools for identifying, planning and implementing habitat restoration for Pacific Salmon and steelhead. North Am J Fish Manage. 38(2):355–376.
- Roni P, Beechie TJ, Bilby RE, Leonetti FE, Pollock MM, Pess GR. 2002. A review of stream restoration techniques and a hierarchical strategy for prioritizing restoration in Pacific Northwest Watersheds. North Am J Fish Manage. 22(1):1–20.
- Sempeski P, Gaudin P. 1995. Habitat selection by grayling-II. Preliminary results on larval and juvenile daytime habitats. J Fish Biol. 47:345–349.
- Thorfve S. 1995. Resultat av undersökningar i Österdalälven ovan Spjutmo inom kontrollarbetet för samlingsmålet i Trängslet, årsregleringar m.m. (in Swedish). Fiskeriverket Informerar (Technical Report). Sweden: Swedish Board of Fisheries.
- Thorfve S. 2002. Habitat mapping of salmon and brown trout habitat in river Ljusnan and river Voxnan (in Swedish). (Technical report). Gävle, Sweden: County Board Gävleborg.
- Törnlund E, Ostlund L. 2002. Floating timber in Northern Sweden: the construction of floatways and transformation of rivers. Environ Hist. 8(1):85–106.
- van Zyll De Jong M, Cowx IG, Scruton DA. 1997. An evaluation of instream habitat restoration techniques on salmonid populations in a Newfoundland stream. Regul Rivers Res Manage. 13:603–614.
- Vehanen T, Huusko A, Yrjänä T, Lahti M, Mäki-Petäys A. 2003. Habitat preference by grayling (Thymallus thymallus) in an artificially modified, hydropeaking riverbed: a contribution to understand the effectiveness of habitat enhancement measures. J Appl Ichthyol. 19(1):15–20.
- West RL, Smith MW, Barber WE, Reynolds JB, Hop H. 1992. Autumn migration and overwintering of Arctic grayling in coastal streams of the Arctic National Wildlife Refuge, Alaska. Trans Am Fish Soc. 121(6):709–715.
- White GC, Burnham KP. 1999. Program MARK: survival estimation from populations of marked animals. Bird Study. 46(supp. 1):S120–S139-S120-S139.
- Wootton RJ. 1998. Ecology of teleost fishes. New York (NY): Chapman and Hall.
- Young PS, Cech JJ, Thompson LC. 2011. Hydropower-related pulsed-flow impacts on stream fishes: a brief review, conceptual model, knowledge gaps, and research needs. Rev Fish Biol Fish. 21(4):713.