
 ?Mathematical formulae have been encoded as MathML and are displayed in this HTML version using MathJax in order to improve their display. Uncheck the box to turn MathJax off. This feature requires Javascript. Click on a formula to zoom.
Abstract
We investigated how the N:P ratio can shape the structure of picophytoplankton and Microcystis, which are abundant and widespread in eutrophic lakes. Unialgal culture and coculture batch experiments were conducted to study the growth and interspecific competition of Microcystis and two freshwater picophytoplankton species, Mychonastes and Synechococcus, with varying N:P ratios. The results showed that the Ks values of Mychonastes and Synechococcus were more than two times smaller than those of Microcystis, and their μmax values were much higher than those of Microcystis due to their small size. Our results also revealed that the N:P ratio is important for shaping phytoplankton community structure even under high nutrient conditions. The optimal N:P ratios are 64, 32, and 32 for Mychonastes, Microcystis, and Synechococcus, respectively. Thus, Mychonastes outcompeted Microcystis when the N:P ratio was higher than 64, while Microcystis and Synechococcus grew equally well under all of the N:P ratio levels, since they have the same optimal N:P ratio.
Introduction
Many lakes in the middle-lower reaches of the Yangtze River are eutrophic, which is the most urbanized and developed region of China. This area is also the most widespread area of freshwater lake distribution in China. Microcystis blooms have been observed in most of the lakes. However, concurrent with Microcystis, picophytoplankton (with cell sizes less than 3 μm) are also abundantly present in eutrophic lakes (Sieburth et al. Citation1978). Picophytoplankton can contribute 9–55% of primary production in eutrophic lakes (Li et al. Citation2016). Picophytoplankton comprises small prokaryotic picocyanobacteria and eukaryotic picophytoplankton (Stockner and Antia Citation1986). In eutrophic lakes, Synechococcus is a common prokaryotic picocyanobacteria. Mychonastes is the dominant eukaryotic picophytoplankton in most eutrophic lakes, e.g. Lake Chaohu and Lake Poyang (Li et al. Citation2016; Shi et al. Citation2019). Our previous study revealed that the concentrations of eukaryotic picophytoplankton were significantly positively correlated with TN: TP (Li et al. Citation2016). Thus, the ratio of N:P might have an important impact on the competition of Microcystis, Synechococcus and Mychonastes in eutrophic lakes.
Although phytoplankton cells on average have a ratio of N and P of approximately 16:1 (Redfield Citation1958), optimal algal N:P ratios will vary from 8.2 to 45.0 (Klausmeier et al. Citation2004). In fact, the nutrient requirements of species are determined by their structural stoichiometry, which is species-specific (Rhee and Gotham Citation1980). It is widely known that low nitrogen-to-phosphorus ratios favor the dominance of cyanobacteria (Xie et al. Citation2003). However, field investigation data from natural lakes have indicated that cyanobacteria blooms are more strongly correlated with variations in total P and total N than the ratio of N:P (Downing et al. Citation2001). Thus, it may be increasing P (or N) concentrations rather than a decrease (or increase) in the N:P ratio that affects phytoplankton community structure (Trimbee and Prepas Citation1987; Scheffer et al. Citation1997). Therefore, it is worthwhile to test whether the N:P ratio can influence the competition of phytoplankton under the eutrophic condition.
So far, there is no information about how the N:P ratio shapes the structure of picophytoplankton and Microcystis, which is the common dominant species in algal blooms, in eutrophic lakes. In this study, we examined the competitive abilities of Microcystis, Synechococcus, and Mychonastes in single species and in mixed cultures with various N:P supply ratios under high nutrient concentrations, aiming to reveal how the N:P ratio impacts the competition of Microcystis and Synechococcus as well as Mychonastes in eutrophic lakes.
Materials and methods
Algal strains and experimental setup
Microcystis and Synechococcus were obtained from the Institute of Hydrobiology, Chinese Academy of Sciences (CAS). Mychonastes was isolated from Lake Chaohu and preserved in our laboratory at Nanjing Institute of Geography and Limnology, CAS. Before the experiment, all of the algal cultures were inoculated in BG-11 culture medium without nitrogen and phosphorus for 3 days to achieve nutrient starvation. The initial algal density was set at 3 × 10⁵ cells mL−1, and the cultures were kept at 25 ± 0.5 °C under light of 25 μmol photo m−2 s−1 with a 12:12 dark light cycle. The flasks were shaken once a day. The experimental design consisted of additions of N (as NaNO3) and P (as K2HPO4) in seven different molar N:P ratios. To ensure that the algae were eutrophic, the phosphorus concentration was set as 1 mg L−1. The nitrogen concentration was adjusted accordingly to obtain N:P ratios of 2, 16, 32, 48, 64 and 80. In this experiment, three batches of five culture groups were set up the unialgal cultures of Mychonastes, Synechococcus, and Microcystis; the Mychonastes and Microcystis coculture group; and the Synechococcus and Microcystis coculture group.
Determination of phytoplankton biomass and nutrition concentration
Samples were taken every two days after the experiment began, a sterile environment was ensured during the sampling process, and 5 mL of the phytoplankton solution was taken each time. The phytoplankton was counted by flow cytometry. The samples were analyzed using a FACSJazzSE flow cytometer (Becton Dickinson, San José, CA, USA) equipped with two lasers emitting at 488 nm and 640 nm as described previously (Li et al. Citation2015). The full details of the discrimination and counting of the different picophytoplankton groups were described in the previous study (Li et al. Citation2015). Mychonastes were characterized by higher forward scattering (FSC) and rich far-red fluorescence from Chl-a, and Synechococcus and Microcystis were characterized by lower FSC and rich phycocyanin fluorescence. The phosphate and nitrate concentrations in the medium were determined using a continuous flow analyzer (San plus system, Skalar, Breda, The Netherlands) and following the manufacturer’s instructions; before analysis, the water samples were filtered through a 0.22 μm hydrophilic membrane.
Data analysis methods
Specific growth rate – The specific growth rate was calculated according to the concentration of phytoplankton cells by the equation:
(1)
(1)
where μn is the specific growth rate on day n; Nn is the cell density on day n (cells mL−1); Nn–1 is the cell density on day n-1 (cells mL−1); tn is the culture time corresponding to Nn; tn–1 is the culture time corresponding to Nn–1; and the specific growth rate of phytoplankton calculated from the beginning of the experiment to the maximum biomass.
Growth curve fitting – The growth process of phytoplankton was fitted with the logistics equation,
(2)
(2)
where K is the maximum biomass (cells mL−1); Nn is the cell density on day n (cells mL−1); r is the intrinsic growth rate; a is a constant; and tn is the culture time corresponding to Nn. The least squares method was used for the regression analysis to obtain the estimated values of the slope and intercept of the fitting equation as r and a, respectively.
Monod equations – The Monod equation was used to describe the relationship between phytoplankton growth and the concentration of the limiting nutrient (Caperon and Meyer Citation1972). Monod equation:
(3)
(3)
Using the Lineweaver-Burk plot method, the Monod equation was transformed into
(4)
(4)
where μ is the growth rate of the phytoplankton; μmax is the max growth rate of the phytoplankton; S is the external nutrient concentration (mg L−1); and Ks is the half-saturation constant for uptake, that is, the mass concentration of the substrate at μ = μmax/2. Ks is usually used to measure the affinity of phytoplankton for nutrients. The slope (Ks/μmax) and the intercept (1/μmax) of EquationEquation (4)
(4)
(4) were obtained by using the least squares method, and thus, the half-saturation constant Ks and max growth rate μmax were obtained.
Statistical analysis
The experimental data were analyzed and plotted with SPSS 16.0 and Origin 8.5. One-way analysis of variances (ANOVA) was used to test for significant differences in the algal maximum biomass and specific growth rates, with varying N:P ratios. If the difference was significant, a least significant difference (LSD) test was used to detect which treatments differed. All results are presented as mean values ± SD.
Results
Nutrient concentrations
The concentration of nitrogen declined rapidly during the first 7 days and then was relatively stable afterwards. The final N concentration was not completely exhausted when the N:P ratio was 2 except in the Mychonastes unialgal culture group. In contrast, nitrogen seemed to be replete when the N:P ratio was 32 and 80, as the final N concentration was 5 and 12 mg L−1. The changing trend in the nitrogen concentration was similar for the culture groups with medium and the high N:P ratios. The N concentration declined sharply first and then declined slowly at a relatively low level in the unialgal cultures of Microcystis and Mychonastes and their mixed culture. Meanwhile, the N concentration declined slowly during the first 11 days and then declined sharply in the Synechococcus unialgal culture and the Syn-Mic mixed culture ().
Figure 1. Nitrate and phosphate concentrations. (a) N:P ratio of 2, (b) N:P ratio of 32, and (c) N:P ratio of 80. Myc-Mic = Mychonastes and Microcystis coculture group; Syn-Mic = Synechococcus and Microcystis coculture group.
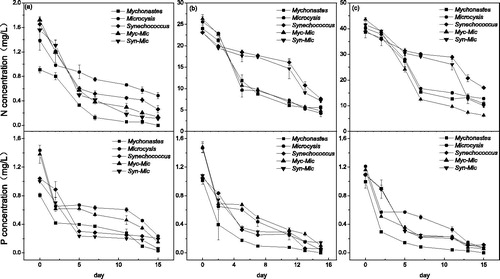
The concentration of phosphorus declined sharply during the first 2 and 5 days and then fluctuated at a relatively low level. Notably, phosphorus was not completely consumed in the Myc-Mic mixed culture when the N:P ratio was 2, with a final concentration of 0.24 mg L−1. However, P was completely consumed for the rest of the mixed culture groups ().
Monod equation parameters
The Ks value of Microcystis was more than two times that of Mychonastes and Synechococcus, and the μmax of Microcystis was much smaller than that of the picophytoplankton. Compared with Synechococcus, Mychonastes had relatively high Ks values and low μmax values ().
Table 1. The Monod equation and related parameters of the different phytoplankton.
Maximum biomass
The maximum biomass of Mychonastes and Microcystis was low when the N:P ratio was 2, both in the unialgal culture and the coculture condition (p < .05). In the unialgal culture group, the maximum biomass of Mychonastes reached a maximum of 800 × 105 cells mL−1 when the N:P ratio was 64 and 80. The maximum biomass of the Mychonastes in coculture was significantly lower than that in the unialgal culture (p < .05) and reached the peak value when the N:P ratio was 80. However, for Microcystis, when the N:P ratio was higher than 32, the maximum biomass was at the same level both in the unialgal culture and the coculture, approximately 225 × 105 cells mL−1 ( and ).
Figure 2. Maximum biomass of the unialgal phytoplankton cultures with varying N:P ratios.
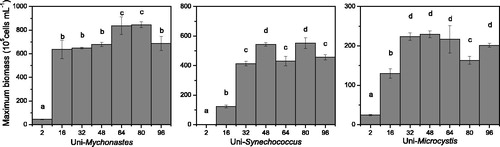
Figure 3. Maximum biomass of the cocultures of phytoplankton with varying N:P ratios. Myc = Mychonastes; Syn = Synechococcus; Mic = Microcystis; Myc (or Mic) in Myc-Mic = Mychonastes (or Microcystis) in the Mychonastes and Microcystis coculture group; and Syn-Mic = Synechococcus (or Microcystis) in the Synechococcus and Microcystis coculture group.
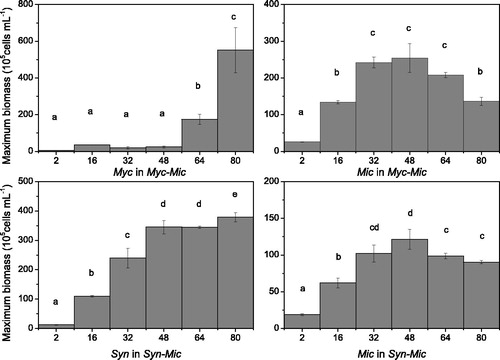
The maximum biomass of Synechococcus and Microcystis was low, with an N:P ratio of 2 in the unialgal culture and in the coculture (p < .05). After the N:P ratio exceeded 32, the maximum biomass of Synechococcus fluctuated at approximately 500 × 105 cells mL−1 in the unialgal culture and approximately 350 × 105 cells mL−1 in the coculture. The maximum Microcystis biomass after the N:P ratio reached 32 (p < .05) was 225 × 105 cells mL−1 in the unialgal culture and 100 × 105 cells mL−1 in the coculture ( and ).
Specific growth rate
In the unialgal culture, the growth rate of Mychonastes increased with the N:P ratio up to 64 and then leveled off abruptly (p < .05). In comparison, the growth rate of Mychonastes was relatively low in the coculture, which showed a clear increase and peaked at an N:P ratio of 64. Meanwhile, the growth rate of Microcystis was identical in the unialgal culture and the coculture, increasing with the N:P ratio up to 32 and then abruptly leveling off (p < .05). In general, the specific growth rate of Mychonastes in the unialgal culture was greater than that of Microcystis, which was greater than that of Mychonastes in the coculture (p < .05) ().
Figure 4. Specific growth rates of phytoplankton with varying N:P ratios. Myc = Mychonastes; Syn = Synechococcus; Mic = Microcystis; Myc (or Mic) in Myc-Mic = Mychonastes (or Microcystis) in the Mychonastes and Microcystis coculture group; and Syn-Mic = Synechococcus (or Microcystis) in the Synechococcus and Microcystis coculture group.
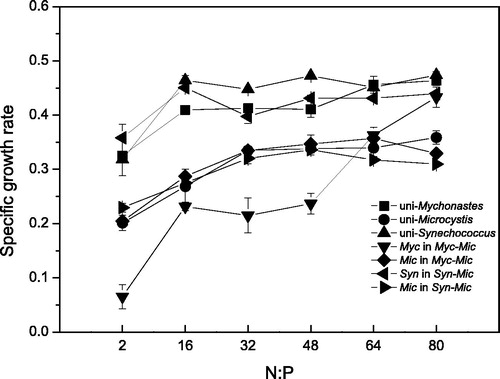
The changing patterns of the growth rate with the rise of the N:P ratio were similar for Synechococcus and Microcystis, both in the unialgal culture and the coculture. The Synechococcus growth rate was low when the N:P ratio was 2 and increased to a stable level for the rest of the N:P treatments. The Microcystis growth rate increased with the increase in the N:P ratio, peaked at an N:P ratio of 32 and then declined afterwards. Generally, the growth rate of Synechococcus was higher than that of Microcystis (p < .05) ().
Discussion
In the unialgal culture, the growth rates of Mychonastes and Synechococcus were higher than the growth rate of Microcystis (p < .05), and their maximal biomass was more than two times higher than that of Microcystis. The cell diameter of the picophytoplankton was less than 3 μm, while the cell size of Microcystis was approximately 4 μm in diameter. It is believed that the absorption capacity of phytoplankton to nutrient concentrations is determined by the specific surface area (Reynolds et al. Citation1981). A large surface area per unit volume and minimal diffusion boundary layer thickness allow for the ready exchange of solutes between picophytoplankton cells and their environment (Fogg Citation1986; Raven Citation1998). Therefore, Mychonastes and Synechococcus have a relatively large nutrient concentration absorption capacity and fast growth rate. The maximum specific growth rate (μmax) and half saturation constant (Ks) are important indicators to evaluate algae competitiveness, and a larger μmax and smaller Ks indicate a stronger competitiveness of phytoplankton, especially in a resource deficiency environment (Tilman Citation1981). In the unialgal culture, the Ks of the picophytoplankton (Mychonastes and Synechococcus) was smaller than that of Microcystis, and the μmax was greater than Microcystis, so the affinity to nitrogen was higher and the growth of the picophytoplankton was faster than those of Microcystis.
The optimum N:P ratio of phytoplankton varies by species (Klausmeier et al. Citation2004). Therefore, when the external N:P ratio changes, the competitiveness of phytoplankton changes, leading to the replacement of the dominant species in the environment, which is regarded as the ‘N:P rule’ (Trimbee and Prepas Citation1987; Scheffer et al. Citation1997; Stevenson et al. Citation2012). However, some researchers have perceived that changes in the concentration of N or P affect the interspecific competition of phytoplankton instead of the N:P ratio itself (Fujimoto et al. Citation1997). Furthermore, it was reported that if the concentrations of bioavailable N and P are significantly greater than the threshold values, 1–2 μmol L−1 of N and 0.1 μmol L−1 of P, the ratio of the available resources is quite irrelevant to the regulation of species-specific growth rates, since neither element imposes a rate-limiting constraint upon the growth of any alga (Reynolds Citation2006). If this is true, the ratio of N:P should not impose any influence on the competition of phytoplankton in eutrophic ecosystems. Thus far, the impact of the N:P ratio on algal competition has not been verified in the laboratory (Reynolds Citation2006).
The uniculture experimental results showed that the optimal N:P ratios of Mychonastes, Microcystis and Synechococcus are 64, 32 and 32, respectively. The results of the coculture experiment revealed that when the N:P ratio is smaller than 32 (the optimal N:P ratio of Microcystis), the specific growth rate of Microcystis is significantly higher than that of Mychonastes, and Microcystis dominates. When the N:P ratio was greater than 64, Mychonastes instead dominated. Therefore, these results show that the N:P ratio affects the growth competitiveness of phytoplankton when nutrients are replete, resulting in a change in community structure. Consistent with the previous study, Microcystis dominated in the treatments with low N:P ratios (Liu et al. Citation2011), and Mychonastes became the dominant species at high N:P ratios (Wehr Citation1989).
The proportions of Synechococcus and Microcystis in the coculture system did not change with varying N:P ratios because they have similar optimal N:P ratios, and they should have the same competitive ability (Rhee and Gotham Citation1980). Meanwhile, Synechococcus always dominants due to its small size for picophytoplankton. Therefore, Synechococcus has a stronger ability to exchange nutrients with the external environment and uptake nutrients. Under conditions of phosphate deficiency, Synechococcus can produce polypeptides, which are located in the cell wall and were found to be involved with high affinity phosphate uptake (Scanlan et al. Citation1993; Scanlan et al. Citation1997). Our result was consistent with previous studies showing that small phytoplankton are dominant in P-limited (high N:P ratio) conditions (Smith and Kalff Citation1982; Currie and Kalff Citation1984).
Previous work revealed that phytoplankton A, with a low optimum N:P ratio, would be dominant when the external N:P ratio is lower than its value, while phytoplankton B, with a high optimum N:P ratio, would be prevalent when the external N:P ratio is higher than its value. However, when the external N:P ratio is between A and B, their competitiveness is the same (Rhee and Gotham Citation1980). Therefore, the direct cause of succession in the dominant species with changes in the N:P ratio is the shift in nutrition limitation with the different types. This conclusion was drawn as the nutrient concentration of P was set at a relatively low level, e.g. 1–10 μmol L−1 (Ducobu et al. Citation1998; Stelzer and Lamberti Citation2001). In our experiment, we set the initial phosphorus concentration at 1 mg L−1 to simulate eutrophic water for the batch culture. In fact, our results indicated that neither N nor P was limited during most of the experimental period, when the N:P ratio was greater than 32, P was only replete at the end of the experiment and N was replete during the whole experimental period. Thus, the ratio of N:P affected the competition of the phytoplankton in eutrophic water.
It has been suggested that any pattern in phytoplankton community structure that might result from resource competition is destroyed by the high variability in resource supplies in nature (Lagus et al. Citation2004). However, despite the short duration (15 days) of our experiment and the dominance of the fast-growing opportunistic species, we were able to explain the species-specific responses to the N:P ratio under nutrient enrichment conditions. This indicates that the N:P ratio can be an important factor in determining phytoplankton community structure in natural eutrophic aquatic ecosystems. Our results revealed that the optimal N:P ratios of Mychonastes, Microcystis and Synechococcus are 64, 32 and 32, respectively. The change in the phytoplankton community structure was caused by the N:P ratio rather than the nutrient concentration. Mychonastes outcompeted Microcystis when the N:P ratio was higher than 64, while Microcystis and Synechococcus grew equally well under all of the N:P ratio levels, since they have the same optimal N:P ratio.
Notes on contributors
Changqing Liu is a MS student from University of Chinese Academy of Sciences, and focus on the ecology and genomics of picophytoplankton in lake.
Xiaoli Shi is an associate professor in Nanjing Institute of Geography and Limnology, Chinese Academy of Sciences. She is working on the phytoplankton ecology of freshwater lake. Her interests include the diversity of picophytoplankton, the effect of environmental factors on cyanobacterial bloom.
Fan Fan is a Ph. D student from University of Chinese Academy of Sciences, working on the physiological characteristics of Microcystis in natural eutrophic lake.
Fan Wu is a MS student from University of Chinese Academy of Sciences, and focus on the ecological characteristic of eukaryotic picophytoplankton.
Jin Lei is a MS student from Nanjing Normal University, and focus on the picophytoplankton diversity in lake.
Author contributions
Changqing Liu and Xiaoli Shi contributed the central idea, analyzed most of the data, and wrote the initial draft of the paper. Fan Fan and Fan Wu performed the experiment. Jin Lei carried out additional analyses and finalized this paper.
Disclosure statement
No potential conflict of interest was reported by the authors.
Additional information
Funding
References
- Caperon J, Meyer J. 1972. Nitrogen-limited growth of marine phytoplankton.1. Changes in population characteristics with steady-state growth-rate. Deep Sea Res. 19:601.
- Currie DJ, Kalff J. 1984. A comparison of the abilities of fresh-water algae and bacteria to acquire and retain phosphorus. Limnol Oceanogr. 29(2):298–310.
- Downing JA, Watson SB, McCauley E. 2001. Predicting cyanobacteria dominance in lakes. Can J Fish Aquat Sci. 58(10):1905–1908.
- Ducobu H, Huisman J, Jonker RR, Mur LR. 1998. Competition between a prochlorophyte and a cyanobacterium under various phosphorus regimes: comparison with the droop model. J Phycol. 34(3):467–476.
- Fogg GE. 1986. Picoplankton. Proc Royal Soc Ser B Biol Sci. 228:1–30.
- Fujimoto N, Sudo R, Sugiura N, Inamori Y. 1997. Nutrient-limited growth of Microcystis aeruginosa and Phormidium tenue and competition under various N:P supply ratios and temperatures. Limnol Oceanogr. 42(2):250–256.
- Klausmeier CA, Litchman E, Daufresne T, Levin SA. 2004. Optimal nitrogen-to-phosphorus stoichiometry of phytoplankton. Nature 429(6988):171–174.
- Lagus A, Suomela J, Weithoff G, Heikkila K, Helminen H, Sipura J. 2004. Species-specific differences in phytoplankton responses to n and p enrichments and the N:P ratio in the Archipelago Sea, northern Baltic sea. J Plankton Res. 26(7):779–798.
- Li S, Shi X, Lepère C, Liu M, Wang X, Kong F. 2016. Unexpected predominance of photosynthetic picoeukaryotes in shallow eutrophic lakes. J Plankton Res. 38(4):830–842.
- Li S, Zhou J, Wei L, Kong F, Shi X. 2015. A review of diversity of freshwater picophytoplankton and its related research methods. Chin J Ecol. 34:1174–1182.
- Li SN, Zhou J, Wei LJ, Kong FX, Shi XL. 2016. The effect of elevated co2 on autotrophic picoplankton abundance and production in a eutrophic lake (Lake Taihu, China). Mar Freshwater Res. 67(3):319–326.
- Liu X, Lu XH, Chen YW. 2011. The effects of temperature and nutrient ratios on Microcystis blooms in Lake Taihu, China: an 11-year investigation. Harmful Algae. 10(3):337–343.
- Raven JA. 1998. The twelfth Tansley lecture. Small is beautiful: the picophytoplankton. Funct Ecol. 12(4):503–513.
- Redfield AC. 1958. The biological control of chemical factors in the environment. Am. Sci. 46:205–221.
- Reynolds CS. 2006. Ecology of phytoplankton. Cambridge (UK): Cambridge University Press.
- Reynolds CS, Jaworski GHM, Cmiech HA, Leedale GF. 1981. On the annual cycle of the blue-green-alga Microcystis-Aeruginosa Kutz emend Elenkin. Philos Trans Royal Soc London Ser B-Biol Sci. 293(1068):419–477.
- Rhee GY, Gotham IJ. 1980. Optimum n-p ratios and coexistence of planktonic algae. J Phycol. 16(4):486–489.
- Scanlan DJ, Mann NH, Carr NG. 1993. The response of the picoplanktonic marine cyanobacterium synechococcus species wh7803 to phosphate starvation involves a protein homologous to the periplasmic phosphate-binding protein of Escherichia coli. Mol Microbiol. 10(1):181–191.
- Scanlan DJ, Silman NJ, Donald KM, Wilson WH, Carr NG, Joint I, Mann NH. 1997. An immunological approach to detect phosphate stress in populations and single cells of photosynthetic picoplankton. Appl Environ Microbiol. 63:2411–2420.
- Scheffer M, Rinaldi S, Gragnani A, Mur LR, van Nes EH. 1997. On the dominance of filamentous cyanobacteria in shallow, turbid lakes. Ecology 78(1):272–282.
- Shi X, Li S, Fan F, Zhang M, Yang Z, Yang Y. 2019. Mychonastes dominates the photosynthetic picoeukaryotes in Lake Poyang, a river-connected lake. FEMS Microbiol Ecol. 95(1):fiy211.
- Sieburth JM, Smetacek V, Lenz J. 1978. Pelagic ecosystem structure – heterotrophic compartments of plankton and their relationship to plankton size fractions – comment. Limnol Oceanogr. 23(6):1256–1263.
- Smith REH, Kalff J. 1982. Size-dependent phosphorus uptake kinetics and cell quota in phytoplankton. J Phycol. 18(2):275–284.
- Stelzer RS, Lamberti GA. 2001. Effects of N: P ratio and total nutrient concentration on stream periphyton community structure, biomass, and elemental composition. Limnol Oceanogr. 46(2):356–367.
- Stevenson RJ, Bennett BJ, Jordan DN, French RD. 2012. Phosphorus regulates stream injury by filamentous green algae, do, and ph with thresholds in responses. Hydrobiologia 695(1):25–42.
- Stockner JG, Antia NJ. 1986. Algal picoplankton from marine and fresh-water ecosystems –- a multidisciplinary perspective. Can J Fish Aquat Sci. 43(12):2472–2503.
- Tilman D. 1981. Tests of resource competition theory using 4 species of Lake-Michigan algae. Ecology 62(3):802–815.
- Trimbee AM, Prepas EE. 1987. Evaluation of total phosphorus as a predictor of the relative biomass of blue-green-algae with emphasis on Alberta lakes. Can J Fish Aquat Sci. 44(7):1337–1342.
- Wehr JD. 1989. Experimental tests of nutrient limitation in fresh-water picoplankton. Appl. Environ. Microbiol. 55:1605–1611.
- Xie LQ, Xie P, Li SX, Tang HJ, Liu H. 2003. The low TN:TP ratio, a cause or a result of Microcystis blooms? Water Res. 37(9):2073–2080.