
Abstract
Uganda does not have a biomonitoring system for assessing the water quality of its rivers basing on benthic macroinvertebrates. An alternative system has been suggested in Tanzania. Differences in characteristics between Tanzania and Uganda may contribute to differences in the physical and chemical characteristics of rivers between the two countries, resulting in variations in macroinvertebrate assemblages and sensitivity levels in relation to disturbance. River Mpanga lies along the equator in western Uganda and shows heterogeneity of impacted and non-impacted sites along its course. The disturbance gradient of River Mpanga was determined using habitat integrity scores. The ability of the Tanzania River Scoring System (TARISS) to distinguish test from reference sites using macroinvertebrate assemblages was validated. Both qualitative and quantitative data were obtained through purposive sampling in both the wet and dry seasons. Macroinvertebrates were sampled following a slightly modified TARISS protocol. Canonical analysis of principle coordinates (CAP) showed that macroinvertebrate assemblages vary along a disturbance gradient, grouping test sites distinct from reference sites. Of the TARISS metrics, average score per taxon was able to distinguish between test and reference sites (p = .009) among the TARISS metrics. Five taxa not included in TARISS were found in river Mpanga and were assigned sensitivity scores based on CAP predictive model in PERMANOVA. It was concluded that TARISS could be reliable for eastern African river systems but should be updated and/or modified by users in different regions to include missing taxa.
Introduction
Bioassessment protocols are based on the premise that biotic communities respond to changes in habitat and water quality resulting from anthropogenic disturbance and that such community responses are integrated indicators of stream health (Barbour et al. 1999; United States Environmental Protection Agency [USEPA] 2005). Properly developed methods, metrics and reference conditions provide a tool that enables a direct measure of the ecological condition of a water body. Once a bioassessment index is developed for a region, biological monitoring can be relatively inexpensive, and easily performed with standard protocols (USEPA 2005).
Rapid bioassessment methods (RBMs) for assessing ecological conditions in river ecosystems using macroinvertebrates have been developed and used worldwide, for instance in the European Union, Canada, the United States of America, southern Africa and recently in Tanzania (Kaaya et al. Citation2015). RBMs have been developed in response to the need in water management for quick and cost-effective methods for assessing water quality given the rising negative impact of anthropogenic activities on water systems. Bioassessment provides indications of cumulative impacts of multiple stressors, not just water quality. Biological community condition reflects both short- and long-term effects, and directly evaluates the condition of the water resource (Elias et al. Citation2014). The macroinvertebrate community at a particular site reflects the organisms which are adapted to the physical structure of the habitat, limnological conditions and ecological interactions.
Despite the undisputable usefulness of bioassessment systems, many regions of the world have not developed these systems. The good news is that bioassessment indices, especially macroinvertebrate-based indices, developed in one region can be applied in other regions with calibration and modification (Dallas et al. Citation2010; Kaaya et al. Citation2015). For instance, indices developed from non-tropical countries often need to be modified before they are applied in the tropical countries. The challenge of adapting bioassessment in tropical countries like Uganda, however, is the poorly known taxonomical resolution and sensitivity of macroinvertebrate taxa to pollution (Jacobsen et al. Citation2008). Even within similar regions, say tropics, considerable variations in seasonality are known. The pattern of climatic seasonality influences almost all aspects of the ecology of stream invertebrates, particularly, their distribution, life histories and timing of life-cycle events (Jacobsen et al. Citation2008). Therefore, it is very important that bioassessment systems developed are extensively tested within a given region and the taxa and their sensitivities to anthropogenic disturbances updated.
In Africa, six biotic indices based on aquatic macroinvertebrates have been developed, one of which is the Tanzania Rivers Scoring System (TARISS) in Tanzania by Kaaya et al. (Citation2015). The other five including: South African Scoring System (SASS) in South Africa (Dickens and Graham Citation2002), the Namibian Scoring System (NASS) in Namibia (Palmer and Taylor Citation2004), the Okavango Assessment System (OKAS) in the Okavango Delta (Dallas Citation2009) and the Zambia Invertebrate Scoring System (ZISS) in Zambia (Lowe et al. Citation2013) were all developed in the south African region and therefore are non-tropical systems. SASS has been extensively tested in South Africa and has proven its capability and reliability as an index for the assessment of water quality and general river condition (e.g. Dallas Citation1997; Dickens and Graham Citation2002; Dallas et al. Citation2010). The Tanzanian system, the only tropical system, developed from SASS has been suggested for East African countries by Kaaya et al. (Citation2015) and recently applied in a few Rwandan rivers (Dusabe et al. Citation2019). However, the system has not been tested for its reliability as a biomonitoring system for the Ugandan rivers including river Mpanga which is located in mid-western Uganda originating from the Rwenzori mountains in the Nile basin. It has been noted in Ojija and Laizer (Citation2016) that differences in climate, geology, longitude and latitude, and other geographic characteristics may contribute to differences in the physical and chemical characteristics of rivers between two countries such as between Tanzania and Uganda. This results in variations in macroinvertebrate assemblages and sensitivity levels in relation to disturbance and general ecosystem impairment. Such variation might affect the capability, functioning and reliability of the TARISS method when directly applied in Ugandan rivers. It is therefore important that TARISS be tested for its reliability as a cost effective bioassessment system for monitoring the water quality of Ugandan rivers, e.g. river Mpanga, given Uganda is more continental sandwiched in the African rift valley and lying entirely in the Nile basin as opposed to Tanzania.
The aim of this study was therefore to test the reliability of TARISS for use in Ugandan rivers with particular focus on River Mpanga as a case study. The existence of a disturbance gradient from pristine, nearly pristine, moderate to very high disturbance in addition to the location of the river along the equator at the Albertine rift valley makes it a good site for testing TARISS. The ability of TARISS metrics to distinguish between test and reference sites along the anthropogenic disturbance gradient was tested. In addition, the question of whether TARISS taxa were representative of all taxa in river Mpanga was addressed. We discuss general applicability of TARISS for East African riverine systems shedding more light on the need for extensive testing of bioassessment systems developed or adapted within any region of the world.
Materials and methods
Study area
River Mpanga () is located in Midwestern Uganda and flows over a distance of about 200 km, with an altitude ranging from 2124 m in the Rwenzori mountains (source area) to 914 m (Lake George), traversing three different districts of Kabarole, Kyenjojo and Kamwenge. In this area, the annual rainfall ranges from 600 to 1000 mm (PROTOS and MWE 2011).
Figure 1. A map of East Africa (right), expanded (left) is part of western Uganda showing the districts, lakes and protected area in the study area where the river Mpanga passes and sampled points (QGIS version 2.6.1-1).
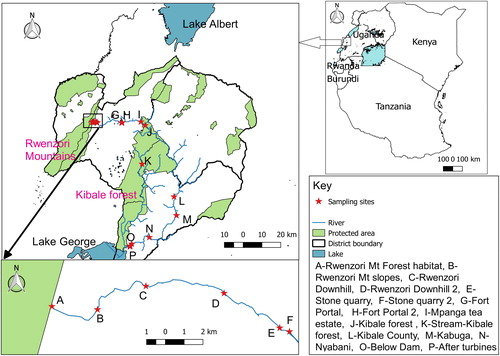
The Mpanga catchment is bound by strong upstream–downstream relationships. The Rwenzori Mountains region is currently under high anthropogenic pressure due to high population growth rate and density (Reinhardt et al. Citation2018) and suffers a variety of poor land use practices such as deforestation of their steep slopes, mining (sand, gravel and stones) by the local communities (PROTOS and MWE 2011; Reinhardt et al. Citation2018), water abstraction, poor waste disposal and agriculture. The human activities affect River Mpanda directly and/or indirectly as it flows through Fort Portal town to rural areas with various tea plantations (where large groundwater abstractions are operational) into Kibale Forest. The forest ecosystem is one of the most important indigenous forests still present in Uganda and has high conservation value and Mpanga River plays a key role in its existence and conservation (PROTOS and MWE 2011). The river flows through different wetlands in Kamwenge District towards Lake George where heavy deforestation, cultivation of crops and livestock farming are common along the banks of the river. The red sandy-clay soils of Kiamara series in Mwenge, Kibale, Burahya and Bunyangabo counties and peaty clays along the Mpanga, are the most productive soils in the region (PROTOS and MWE 2011) favouring the cultivation of crops like bananas, yam, sugar cane, vegetables and maize. River Mpanga flows into Lake George over Mpanga falls, a natural habitat for different species of fauna and flora, bordering Queen Elisabeth National Park. At this point, the river joins a wetland system Lake George classified as Ramsar site. The Mpanga Falls Gorge itself is known to be the world only habitat for rare cycad species Encephalartos whitelockii (Byaruhanga Citation2001; Ogwal Citation2017). At this site a hydropower dam was recently constructed and is operational.
Sampling strategy
Sampling was done in September 2016 through January 2017 to cover both wet and dry seasons. Samples were collected from a total of 18 sites in different zones of the river; upstream, midstream and downstream. In each of the sections, sampling sites were selected to include disturbed (test) and undisturbed/least disturbed (reference) sites. Each of the sections was sampled twice between September to October and December to January though the samples were not collected from necessarily the same points in the dry season since the water levels were low in the upstream at stone quarry site and the river dived into small streams due to siltation. Effort was made to include all forms of human effects on water quality. At each sampling site, latitude, longitude and altitude, were taken using a Garmin GPS IV. Human impact at each site was recorded according to the disturbances (none, domestic, agricultural and industrial waste water, cattle drinking, irrigation, etc.), and by the surrounding habitat (urbanisation, natural forest, wetland, pasture/grassland, agriculture, tree plantation). To minimise inter-observer bias, all estimates were taken by the same person throughout the study period.
Data collection
Disturbance gradient
Data on human activities and ecosystem stressors were collected and weighted at each site and used to develop a disturbance gradient across sites. Local catchment human disturbance score (LCHDS), instream habitat integrity score (IHIS) and riparian zone habitat integrity score (RZHIS) were used as environmental variables for indicating levels of human disturbance across sites. The IHIS and RZHIS are as described by Kleynhans (Citation1996) and the LCHDS were a set of 20 criteria as described by Kaaya et al. (Citation2015). LCHDS are used to give a quick snapshot of potential reference and test sites. Sites with the LCHDS ≤ 10% were considered to be reference sites. Sites were further reassessed using RZHIS and IHIS to eliminate sites that had considered reference by LCHDS but had instream and riparian zone stresses not expected of a reference site. Sites with RZHI and IHI ≥80% were selected as reference sites in line with Kleynhans (Citation1996) who emphasises that reference sites are natural or largely natural and the modifications are minimal not to cause significant changes in natural habitats and therefore ecosystem functioning is essentially unchanged. The instream and riparian zone habitat integrity weightings of the disturbance impact are shown in . The total impact score is a result of the assigned impact score multiplied by the weight of the impact divided by the maximum possible impact score (25). The calculated total impacts of all criteria were then summed and expressed as a percentage and subtracted from 100 to give an instream or riparian zone habitat integrity score. Some of the sampled sites are shown (). The degrees and type of perturbation varied considerably from one site to another.
Figure 2. Characteristics of some of the study sites both at site and riparian zone: (A) Construction up at the bank in Fort Portal, (B) Bear bank shared by humans and animals, (C) Crop growing mountain slopes, (D) Pristine Kibale forest and (E) Plastics in water at Fort Portal. Photos taken by Godwin Tumuhairwe during field sampling (C taken on 18/01/2017; A, D, E on 19/01/2017 and B on 20/01/2017).
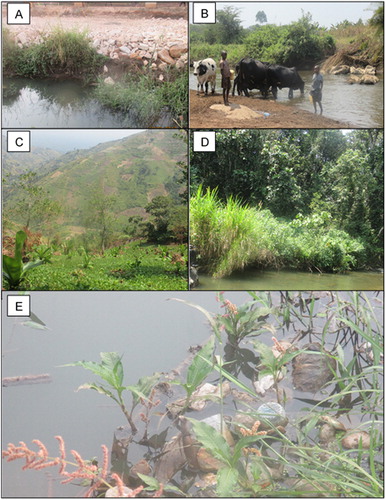
Table 1. Weighted criteria for instream habitat integrity and riparian zone habitat integrity.
Macroinvertebrate sampling
Macroinvertebrates were sampled following a modified sampling protocol adopted from the TARISS sampling protocol (Kaaya Citation2015). A scoop net (diameter: 30 cm, mesh size: 1 mm) attached to a long handle was placed on the stream bed against the flow and the substrate in front of the net was agitated by simple kicks and steps. Samples were collected in three biotopes, namely stones, vegetation and gravel sand mud (GSM) biotopes. Sampling procedures for each biotope are described below. Sampling times mentioned for each biotope refers to the effective sampling time (kicking, stirring or sweeping).
Stones
The stone biotope comprises samples collected from stones in current (SIC) and out of current (SOOC). In sampling stones in current (SIC), the net was placed close to and downstream of the kicked stones to allow dislodged organisms to be carried into the net by the current. Where necessary, stones were turned over to dislodge organisms. In bedrock-dominated areas, hands and feet were used to rub off attached organisms. Kicking in loose stones was done for two minutes while kicking in embedded stones, in particular bedrock, was prolonged for up to a maximum of five minutes and sampling time was noted. In stones out of current (SOOC), stones were kicked, scraped, turned or rubbed with hands and feet while the disturbed area was continuously being swept by the scoop net for a period of one minute.
Vegetation
The vegetation biotope includes marginal and aquatic vegetation, depending on what is present at a site. Marginal vegetation refers to vegetation on the edge of river banks and aquatic vegetation refers to submerged vegetation in the river channel, including filamentous algae and roots and stems of floating vegetation. Approximately 2 m length of marginal vegetation was sampled. The two-metre length was spread over different locations to allow different types of marginal vegetation to be sampled (reeds, shrubs or grasses) and different flow velocities (fast or slow). The net was vigorously pushed back and forth along the marginal vegetation while moving upstream in order to catch dislodged organisms. When sampling aquatic vegetation, a net was repeatedly pushed through the submerged or floating aquatic vegetation over an area of approximately one square metre.
Gravel, sand and mud (GSM)
Samples were collected from gravel (2–16 mm), sand (0.06-2 mm) and mud, silt or clay (<0.06 mm) in different available water currents for a period of one minute. Gravel, sand and mud (GSM) biotopes were stirred by shuffling one’s feet while the shuffled area was continuously swept over by a net to catch dislodged organisms. Collection of sand and mud into the net was avoided by sweeping the net sufficiently far from the feet and giving few seconds for large sediment particles to settle before sweeping the net.
Hand-picking and visual observation
Substrate was visually searched for attached organisms especially on the rocks, gravel and submerged decaying wood and any organisms seen were picked up.
The macroinvertebrates collected from the different biotopes were combined and transferred into a container with 70% ethanol using feather-weight forceps for preservation and identified later in the laboratory. Sampling effort was constantly 90 minutes by one person for each site.
Macroinvertebrate identification
Macroinvertebrates were identified to family level except for phylum Annelida whose members were identified to sub-class level. The taxonomic level of identification corresponded to the TARISS taxa. Some keys used included those developed for the East and southern African sub-region (Cape Province to northern Zambia; Day et al. Citation1999, Citation2002; Day et al. Citation2001a, Citation2001b; Stals and de Moor Citation2007).
TARISS metrics tested during this study were TARISS scores, Number of Taxa and Average score per taxon (ASPT). The TARISS scores were obtained by adding up the sensitivity scores of the different taxa found at a site with no consideration of abundance. Sensitivity scores were obtained from the score sheet developed by Kaaya (Citation2014), while the new taxa were assigned sensitivity scores following Canonical Analysis of Principal Coordinates (CAP) predictive model (Anderson et al. Citation2008). ASPT was obtained by dividing the TARISS scores by the number of taxa at a given site.
Data analysis methods
Disturbance gradient
A principal component analysis (PCA) of Local Catchment Human Disturbance Scores (LCHDS), In-stream Habitat Integrity Scores (IHIS) and Riparian Zone Habitat Integrity Scores (RZHIS) was performed and the resulting first PCA axis (PC1 axis) was used as an overall human disturbance gradient across sites using Paleontological statistics (PAST) software (Hammer et al. Citation2001).
Validating TARISS along the human disturbance gradient
According to Anderson et al. (Citation2008), Canonical Analysis of Principal Coordinates (CAP), which is a constrained ordination, has a high ability to show group differences along a certain dimension. Thus, macroinvertebrate abundance data across different sites were log (x + 1) transformed and a Bray-Curtis resemblance matrix was obtained using Primer version 6 (Anderson et al. Citation2008). The resultant matrix was analysed along PC1 as the axis for the overall anthropogenic disturbance gradient. This was used to test for the ability of TARISS to distinguish between test and reference sites since the test sites are expected to group differently from reference sites according to Kaaya (Citation2014).
TARISS metrics were correlated with the human disturbance gradient (PC1) to ascertain how TARISS metrics respond to the disturbance continuum in the study area and in the river zones using Primer version 6 (Clarke and Gorley Citation2006). The TARISS metrics were compared for differences between test and reference sites in the whole study area using Man Whitney U test using SPSS version 20 (Kirkpatrick and Feeney Citation2012).
Assigning sensitivity scores to new taxa
Assigning sensitivity scores to new taxa was based on the assumption that TARISS macroinvertebrate sensitivity weightings are appropriate reflections of pollution and general disturbance in a river’s condition. Thus the TARISS macroinvertebrate sensitivity scale of 1–15 was used. Canonical analysis of principal coordinates (CAP) was used to predict sensitivity weightings of newly identified macroinvertebrate taxa in this study along the gradient of original TARISS sensitivity weightings (1–15). All the taxa that were found and existed in TARISS were used to predict the sensitivity of new taxa. Macroinvertebrate taxa of original SASS sensitivity weightings, used as a model, were presence/absence transformed and analysed by Bray-Curtis coefficient and a resemblance matrix was produced. The number of appropriate PCO axes (m) which explains the model’s matrix variability while minimising the chances of misclassifying a new taxon to a wrong group was noted. The number of appropriate PCO’s is expected to explain at least 60–80% of the resemblance in a matrix while minimising the residual sum of squares according to Anderson et al. (Citation2008). Another Bray-Curtis resemblance matrix including both model and new macroinvertebrate taxa was produced using the same number of PCO’s and sensitivity weightings of new macroinvertebrate taxa were calculated along the original TARISS sensitivity weightings gradient. A CAP ordination was produced showing placement of new taxa along the sensitivity weightings gradient using PERMANOVA + adds on for Primer version 6 software (Anderson et al. Citation2008).
Results
A disturbance gradient of river Mpanga
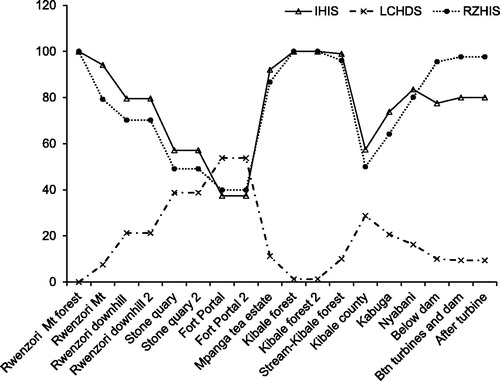
A total of 18 sites were sampled of which 17 lie along the course of the river and one is at a stream (tributary) in Kibale forest. Eight sites were considered to be reference sites based on the assessment of Instream Habitat Integrity Scores (IHIS), Riparian Zone Habitat Integrity Scores (RZHIS) and Local Catchment Habitat Disturbance Scores (LCHDS) and 10 were considered as test sites. Habitat integrity changes considerably from the source of the river in Mt. Rwenzori forest which is completely pristine and protected down to Mpanga gorge close to the mouth of the river ().
Figure 3. The change in In-stream Habitat Integrity Score (IHIS), Local Catchment Habitat Disturbance Scores (LCHDS) and Riparian Zone Habitat Integrity Scores (RZHIS) of river Mpanga from upstream (left) to downstream (right) obtained during the entire period of study.
A Principal component analysis (PCA) of LCDHS, IHIS and RHIS () yielded an overall disturbance gradient of the river (PC1) which explained 95.33% of the disturbance while PC2 represented 3.91%. PC1 was thus considered to be representative of the disturbance gradient of the river and was used for subsequent analysis. All the three scores of habitat integrity had a very strong correlation with PC1 (LCDHS = –0.99, RZHIS = 0.98 and IHIS = 0.97). The more negative end on the axes represents most disturbed sites.
Figure 4. Principle component analysis output of the In-stream Habitat Integrity Score (IHIS), Local Catchment Habitat Disturbance Scores (LCHDS) and Riparian Zone Habitat Integrity Scores (RZHIS) showing the major study sites in relation to human disturbance. The loadings on PC1 are 0.6469, 0.5820, and –0.4928 for RZHIS, IHIS, and LCHDS respectively (N = 13. For clarity, repeated sites were not included in the graph).
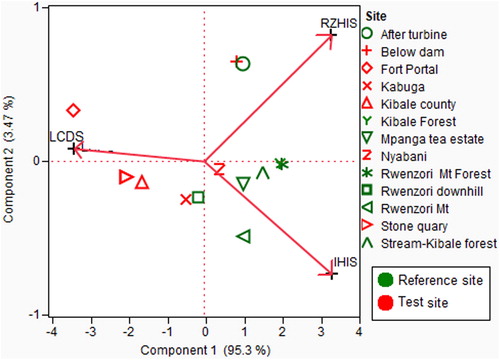
Fort Portal town has the highest degree of anthropogenic disturbance with Mt. Rwenzori forest and Kibale forest having the lowest disturbance. Clearly, urbanization had the greatest negative effect on ecosystem integrity in all aspects. The riparian zone and stream integrity varied according to the intensity and type of human activity as one moves away from the pristine protected area.
Distinction between test and reference site based on TARISS
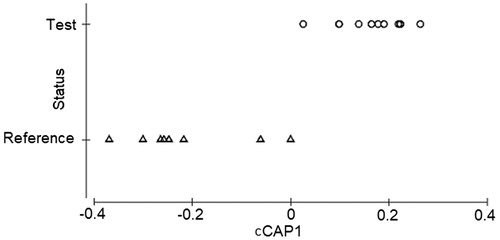
A canonical analysis of principle coordinates (CAP) was performed to test the hypothesis of no difference in the macroinvertebrate assemblages between test and reference study sites and results indicate that a significant difference in macroinvertebrate assemblages exists (δ2 = 0.75574, p = .025, ). The positive end of the disturbance gradient represents sites with the least disturbance while increase in the negative end represents increased disturbance. A constrained CAP visualises the distinction between test and reference sites in terms of macroinvertebrate assemblages (). The results show that macroinvertebrates in test and reference site are significantly different (δ2 = 0.8157, p = .007) though there are some overlaps. A total of 14 sites (77.8%) were correctly classified and 22.2% were misclassified. Rwenzori Mountain slopes, after turbines in the gorge and between turbines and dam sites were misclassified as reference sites while before stone quarry site was misclassified as test using habitat integrity scores. However, these sites are transition sites between clearly test and reference sites.
Figure 5. Canonical Analysis of Principle Coordinates (CAP) output showing the grouping of sites along the human disturbance gradient using macroinvertebrate assemblages (N = 18).
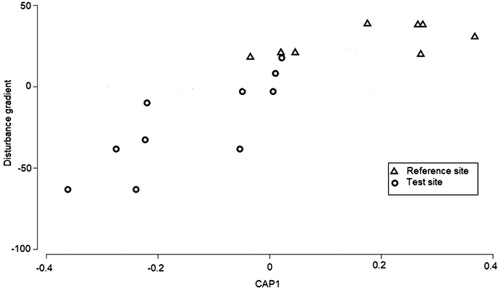
Figure 6. Constrained Canonical Analysis of Principle Coordinates (cCAP) showing how macroinvertebrate assemblages distinguish between test and reference sites on River Mpanga (N = 18).
TARISS metrics
The TARISS metrics include number of families, ASPT and TARISS score were correlated with disturbance gradient (). TARISS scores and ASPT values correlate significantly with disturbance gradient (p = .036) and (p = .000) respectively. ASPT values have a very high positive correlation (ρ = 0.788) and TARISS scores show a moderate correlation (ρ = 0.496). Highly sensitive taxa to pollution tend to inhabit areas with minimum human disturbance while the least sensitive taxa can tolerate polluted sites as indicated by TARISS scores and ASPT values as. The number of families thus has a small insignificant relationship with degree of disturbance (ρ = 0.269, p = .281). Fort Portal town has the most polluted water (ASPT = 4) while Rwenzori mountain forest has the least polluted/disturbed water quality (ASPT = 8). The nonparametric Mann Whitney U test shows significant differences in ASPT (p = .009) between test and reference sites but insignificant results for TARISS scores and number of taxa.
Table 2. TARISS metrics across test and reference site on river Mpanga from upstream to downstream in the dry and wet seasons; highlighted are the sites with low water quality as indicated by Average score per Taxon (ASPT) values, red highlight shows the critically low water quality sites.
Assigning sensitivity scores to new taxa
Five new taxa including Chordodidae, Ptilodactylidae, Aspidytidae, Leptopodidae and Paraecnomidae were identified to be missing in the TARISS. Chordodidaea (order Gordioidea) was represented by the Paragordius sp. found in Fort Portal town where the substrate is mainly mud and macrophytes. Ptilodactylidae and Leptopodidae were found in Mpanga Gorge where the substrate type is exclusive rocks and the water levels generally high. Aspidytidae larvae were found in the pristine Rwenzori mountain forest at an altitude of 2124 m in the cold slow flowing stream whose substrate is mainly sand and decaying organic matter.
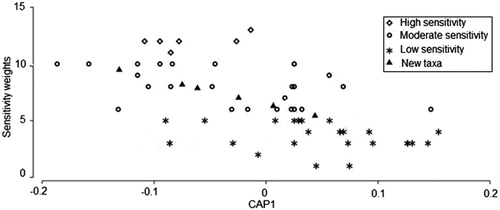
When a CAP predictive model was performed, the sensitivity weighting of the new taxa obtained is: Chordodidae (7), Aspidytidae (9), Parecnomidae (8), Leptopodidae (5) and Ptilodactylidae (8), with a correlation square (δ2 = 0.3736). The appropriate number of principle coordinates (m) was seven which significantly explained the variability in the model by 93.53%. It was thus found that four of the new taxa lie under the moderate sensitivity category while one family (Leptopodidae) lies under the low sensitivity category based on the classification by Gerber and Gabriel (Citation2002). The predicted position of the new taxa in the cloud of other taxa along the sensitivity gradient of the TARISS taxa is shown in .
Figure 7. Canonical Analysis of Principle Coordinates (CAP) prediction of sensitivity of new taxa in a cloud of other taxa along the sensitivity gradient (N = 58).
Discussion
Results indicate that macroinvertebrate assemblages differ between test and reference sites with few overlaps along a disturbance gradient. The Tanzania River Scoring System (TARISS) is able to represent the water quality at a given site based on the macroinvertebrate assemblage within the river. However, we found that the TARISS is does not contain some of the taxa found in river Mpanga system
Human activities have varying impact on ecological integrity and ecosystem functioning, a basis on which the different sites should have different integrity scores based on the nature and intensity of the human activity. Discrimination analysis degree of correctness between two categories (e.g. test and reference sites) expected by chance is 50% (Anderson et al. Citation2008). However, the discrimination correctness obtained in this study was greater than expected by chance (77.78%) suggesting that macroinvertebrates communities are affected by degree of disturbance (Nilsson Citation1987; Mayfield et al. Citation2010; Carreño-Rocabado et al. 2012). However, like other biological systems, the difference from reference and test conditions is not discrete but rather a gradual change with intermediate conditions (Whittaker Citation1956). This explains why there were sites in the transition zone misclassified as either reference or test as shown by the CAP during analysis.
TARISS metrics between test and reference site
Results of the CAP indicate that macroinvertebrate assemblages differ significantly along the anthropogenic disturbance gradient with overlaps in the transition zones. Anthropogenic disturbance therefore results in shift in macroinvertebrate community structure (Feld et al. Citation2014) with new taxa occupying empty niches along the disturbance gradient. However, this study also shows that some sites overlap between greatly and less impacted areas along the disturbance gradient in line with the findings of Larsen and Ormerod (Citation2010). The number of taxa, reduction in dominance and diversity are seen to increase initially with the disturbance gradient before reducing to even lower values as disturbance increases. This agrees with Hall et al. (Citation1992) who note that individuals of a species tend to follow a normal distribution pattern within their geographic range. Whittaker et al. (Citation1973) argue that organisms survive in their optimum and suboptimum range, which may indicate that moderately disturbed sites support tax from undisturbed and highly disturbed niches. Thus moderate anthropogenic disturbance tends to offer better condition for a more varied community structure (Townsend et al.Citation1997; Stein et al. Citation2018; Willig and Presley Citation2018) whereas extremes favour dominant better adapted taxa.
The misclassification of sites within Mpanga gorge after the dam could be attributed to the damming of the river which diverts a very large volume of water from the river course. Whereas other attributes of the study sites qualify them to be reference, damming alone causes major transformation in channel characteristics (Brandt 2000; Granzotti et al. Citation2018) similar to multiple disturbances.
TARISS metrics
Macroinvertebrate assemblages at a particular site represent the ecological health in relation to anthropogenic disturbance (e.g. Kaaya Citation2014). Properly assigned sensitivity scores will therefore result in reliable and consistent results of water quality at a given site. This study found that indeed TARISS scores and ASPT correlate significantly with the disturbance gradient. The number of taxa however does not correlate with disturbance gradient. As discussed earlier, Feld et al. (Citation2014) suggest that anthropogenic disturbance results in change of community structure with new taxa replacing others depending on their degree of tolerance to disturbance resulting in an almost uniform community in terms of complexity. The change in community structure is not linear in nature but rather curved with relatively fewer but dominant taxa at extremes of the disturbance gradient. This study also found that critically disturbed sites like Fort Portal had much lower number of taxa than other sites including reference sites.
Of the TARISS metrics therefore, the most reliable is ASPT which describes the average degree of disturbance at the site as indeed is the case with related bioassessment methods of water quality like SASS (Dickens and Graham Citation2002) and BMWP (Hawkes Citation1998). Hence, it was able to distinguish between test and reference sites along the anthropogenic disturbance gradient. ASPT combines both TARISS scores and number of families; and the results can be interpreted easily to relate to water quality (Gerber and Gabriel Citation2002). They classified organisms with sensitivity 1–5 as having low sensitivity, 6–10 moderate sensitivity and 11–15 high sensitivity. Urbanisation was found to have the greatest negative impact on water quality as seen in Fort Portal town. This is because multiple stressors (Freeman and Schorr Citation2004) such as poor waste management, discharges from abattoirs, runoff from town and washing of vehicles, as discussed earlier, all destroy the integrity of the river ecosystem favouring pollution tolerant taxa which have low scores hence the low ASPT. With reduction in human footprint away from Fort Portal downstream to Kibale forest, the ASPT values recover as the level of disturbance reduces.
Sensitivity scores of new taxa
Bioassessment systems developed in certain regions can be adopted for use in other regions provided they are tested and calibrated accordingly (Dallas et al. Citation2010). According to Day and King (Citation1995), factors like geology and climate which vary from one region to another can influence water chemistry there by affecting distribution and sensitivity of related macroinvertebrate assemblages. In this study, five taxa were found to be missing in TARISS; four of these taxa were found to be moderately sensitive to disturbance while one has low sensitivity based on CAP predictive model by Anderson et al. (Citation2008). Aspidytidae is a family of beetles (Coleoptera) described recently in South Africa and China (Balke et al. Citation1997; Ribera et al. Citation2002; Alarie and Bilton Citation2014) and its range and habitat characteristics are barely known. This beetle taxon was found in river Mpanga at its early stages in the pristine Rwenzori mountain forest explaining its high sensitivity weight of 9. Chordodidae (horse-hair worms) are mainly tropical and they are rarely found in temperate regions according to Spiridonov (Citation2003). They are haemocoel parasites of insects like grasshoppers but mature forms reproduce in water. It was found in Fort Portal where the substrate is mainly mud and macrophyte explaining the borderline moderate sensitivity weight of 6 close to low sensitivity. Ptilodactylidae which are believed by Chatzimanolis et al. (Citation2012) to have a worldwide distribution were found in Mpanga gorge downstream which is relatively not greatly modified by human activity given that the diverted water upstream re-joins the river and the area is forested.
Finding of new taxa in river Mpanga not included in TARISS suggests that a bioassessment developed within a given country may not necessarily be applied in other countries within the same region without modifications and/or additions. More taxa could potentially be discovered in other rivers within the region resulting in an improved bioassessment system for the region which will need to be added to the Tanzanian system to form a comprehensive scoring system to be used by East African countries.
Conclusions
Extreme human disturbance resulted in fewer tolerant species while moderate human disturbance resulted in generally higher number of taxa and reduced dominance. Thus moderate disturbance levels provide (temporarily) tolerable conditions for both highly sensitive and less sensitive taxa though at lower populations than in optimum conditions.
TARISS sensitivity weights are reliable and can be used to represent ecosystem health of a river over time since the taxa have adapted to the conditions in the river. However, the list of taxa in TARISS is not exhaustive and may not be applicable to all rivers in East Africa (and Uganda in particular) without revision and modification. The findings of our study are a very important contribution to the development of a critically needed regional scoring system for East African countries that is all inclusive. Bioassessment systems developed for regions or adopted in different region with different characteristics need to be extensively tested and validated before they are used.
Using high taxonomic levels of classification in assessing water quality gives a quick picture of the health of a river but obscures species or generic level differences in sensitivity to disturbance resulting in low levels of precision. Whereas the information obtained can be useful, more precise measures could give more reliable hidden information by use of lower level identification perhaps based on DNA-based identification of taxa such as meta-barcoding.
Notes on contributors
Julius Tumusiime is interested in freshwater studies, ecology, parasitology, and conservation. He holds an MSc. in Biology (Natural resources' ecology, management and conservation) since 2017.
Dr. Casim Umba Tolo is Senior Lecturer in the Department of Biology, Faculty of Science, and the Center Leader/Director of Pharmbiotechnology and Traditional Medicine Center (PHARMBIOTRAC), under the Eastern and Southern Africa Higher Education Centers of Excellence (ACE II) at Mbarara University of Science and Technology, Uganda. He holds M.Sc. and Ph.D in Biology. He has wide research experience and published articles in peer-reviewed journals and has contributed book chapters in the areas ranging from Conservation Biology, Ecology, Environment, Climate Change Adaptation and Indigenous Knowledge Systems.
Marie Claire Dusabe currently serves as bat project coordinator under the Rwanda Wildlife Conservation Association (RWCA). She has a master's in Biology (Natural resources ecology management and conservation) and has served as researcher in the field of environmental conservation especially freshwater quality and macroinvertebrates taxonomy since 2013. Claire became fascinated with environmental conservation as a researcher in the field school held in Uganda where best students from Umutara Polytechnic in wildlife and aquatic resources management were invited to attend the international field school regarding environmental conservation. Claire got her first grant in Congo Basin grant Program in 2016 about Assessment of water quality and macro-invertebrates diversity of a major tributary to ancient Lake Tanganyika, the Rusizi catchment; as the project investigator she was in charge of coordinating the team of research assistants for the field and laboratory work. Her dreams since she was young was being a good biologist. Marie Claire can be reached by email at [email protected].
Christian Albrecht is interested in biodiversity, evolution and biogeography of African freshwater invertebrates.
Acknowledgment
Field assistance from Mr. Muhairwe Godwin during data collection was appreciated.
Disclosure statement
No potential conflict of interest was reported by the authors.
Related Research Data
Cited literature
- Alarie Y, Bilton DT. 2014. Larval morphology of Aspidytidae (Coleoptera: Adephaga) and its phylogenetic implications. Ann Entomol Soc Am. 98(4):417–430.
- Anderson M, Gorley RN, Clarke RK. 2008. PERMANOVA + for PRIMER: Guide to Software and Statistical Methods. Plymouth (UK): PRIMER-E.
- Balke M, Dettner K, Hendrich L. 1997. Agabus (“Metronectes”) aubei Perris: habitat, morphological adaptations, systematics, evolution, and notes on the phanerofluicolous fauna (Coleoptera: Dytiscidae). Aquat Insect. 19(2):75–90.
- Barbour MT, Gerritsen J, Snyder BD, Stribling JB. 1999. Rapid bioassessment protocols for use in streams and wadeable rivers: periphyton, benthic macroinvertebrates and fish. 2nd ed. Washington DC: US Environmental Protection Agency Office of Water; p. 339. http://doi.org/EPA841-B-99-002
- Brown DS. 1994. Freshwater snails of Africa and their medical importance. 2nd ed. London (UK): Taylor and Francis; p. 166–260.
- Byaruhanga A. 2001. Mpanga gorge Uganda’s ecological treasure in danger! – Cycad Plant Articles. Jurassic Garden; [retreived on 2016 Apr 04]. http://www.cycadpalm.com/enwhectrinda.html
- Carreño‐Rocabado G, Peña ‐Claros M, Bongers F, Alarcón A, Licona JC, Poorter L. 2012. Effects of disturbance intensity on species and functional diversity in a tropical forest. J Ecol. 100(6):1453–1463.
- Chatzimanolis S, Cashion ME, Engel MS, Falin ZH. 2012. A new genus of Ptilodactylidae (Coleoptera: Byrrhoidea) in mid-Cretaceous amber from Myanmar (Burma). Geodiversitas. 34(3): 569–575.
- Clarke KR, Gorley RN. 2006. PRIMER V6: user manual-tutorial. Plymouth (UK): PRIMER-E.
- Dallas HF, Kennedy M, Taylor J, Lowe S, Murphy K. 2010. SAFRASS: Southern African River Assessment Scheme. WP4: review of existing biomonitoring methodologies and appropriateness for adaptation to river quality assessment protocols for use in southern tropical Africa. SAFRASS Deliverable Report to the ACP Group Science and Technology Programme. Scotland:University of Glasgow. Contract AFS/2009/219013. .
- Dallas HF. 1997. A preliminary evaluation of aspects of SASS (South African Scoring System) for the rapid bioassessment of water quality in rivers, with particular reference to the incorporation of SASS in a national biomonitoring programme. Afr J Aquat Sci. 23:79–94.
- Dallas HF. 2009. Wetland monitoring using aquatic macroinvertebrates. Technical Report. Prepared for the Biokavango Project, Harry Oppenheimer Okavango Research Centre, University of Botswana, by the Freshwater Consulting Group, University of Cape Town. Report 5/2009.
- Day JA, de Moor IJ, Stewart BA, Louw AE. 2001a. Guides to the Freshwater Invertebrates of Southern Africa. Vol. 3, Crustacea 2: Ostracoda, Copepoda and Branchiura. South African Water Research Commission Report TT140/08. Pretoria (SA): Beria printers; p. 1–177.
- Day JA, Harrison AD, de Moor IJ. 2002. Guides to the freshwater invertebrates of Southern Africa. Vol. 3, Diptera. South African Water Research Commission Report TT201/02. Pretoria (SA): Beria printers; p. 1–200.
- Day JA, King JM. 1995. Geographical patterns, and their origins, in the dominance of major ions in South-African rivers. S Afr J Sci. 91(6):299–306.
- Day JA, Stewart BA, de Moor IJ, Louw AE. 1999. Guides to the freshwater invertebrates of Southern Africa. Vol. 2, Crustacea 1: Notostraca, Anostraca, Conchostraca and Cladocera. South African Water Research Commission Report, TT 121/00. Pretoria (SA): Beria printers; p. 1–123.
- Day JA, Stewart BA, de Moor IJ, Louw AE. 2001b. Guides to the freshwater invertebrates of Southern Africa. Vol. 4, Crustacea 3: Bathynellacea, Amphipoda, Isopoda, Spelaeogripacea, Tanaidacea and Decapoda. South African Water Research Commission Report TT 141/00. Pretoria (SA): Beria printers; p. 1–141.
- Dickens CW, Graham PM. 2002. The South African Scoring System (SASS) Version 5 rapid bioassessment method for rivers. Afr J Aquat Sci. 27(1):1–10.
- Dusabe M-C, Wronski T, Gomes-Silva G, Plath M, Albrecht C, Apio A. 2019. Biological water quality assessment in the degraded Mutara rangelands, northeastern Rwanda. Environ Monit Assess. 191(3):139.
- Elias JD, Ijumba JN, Mamboya FA. 2014. Effectiveness and compatibility of non-tropical bio-monitoring indices for assessing pollution in tropical rivers – A review. Int J Ecol. 4(3):128–134.
- Feld CK, Bello F, Dolédec S. 2014. Biodiversity of traits and species both show weak responses to hydromorphological alteration in lowland river macroinvertebrates. Freshwater Biol. 59(2):233–248.
- Freeman PL, Schorr MS. 2004. Influence of watershed urbanization on fine sediment and macroinvertebrate assemblage characteristics in Tennessee Ridge and Valley streams. J Freshwater Ecol. 19(3):353–362.
- Gerber A, Gabriel MJM. 2002. Aquatic invertebrates of South African rivers field guide. Pretoria (SA): Institute for Water Quality Studies Department of Water Affairs and Forestry; p. 5–145.
- Granzotti RV, Miranda LE, Agostinho AA, Gomes LC. 2018. Downstream impacts of dams: shifts in benthic invertivorous fish assemblages. Aquat Sci. 80:1–14.
- Hall CA, Stanford JA, Hauer FR. 1992. The distribution and abundance of organisms as a consequence of energy balances along multiple environmental gradients. Oikos, 377–390.
- Hammer Ø, Harper DAT, Ryan PD. 2001. PAST: Paleontological statistics software package for education and data analysis. Palaeontol Electron. 4(1):9. http://palaeo-electronica.org/2001_1/past/issue1_01.htm
- Hawkes HA. 1998. Origin and development of the biological monitoring working party score system. Water Res. 32(3):964–968.
- Jacobsen D, Cressa C, Mathooko JM, Dudgeon D. 2008. Macroinvertebrates: Composition, life histories and production. In: Tropical stream ecology, Academic Press; p. 65–105.
- Kaaya LT, Day J, Dallas HF. 2015. Tanzania River Scoring System (TARISS): a macroinvertebrate-based biotic index for rapid bioassessment of rivers. Afr J Aquat Sci. 40(2):109–117.
- Kaaya LT. 2014. Biological assessment of tropical riverine systems using aquatic macroinvertebrates in Tanzania, East Africa [dissertation]. Cape Town (SA): University of Cape Town.
- Kaaya LT. 2015. Towards a classification of Tanzanian rivers: a bioassessment and ecological management tool. A case study of the Pangani, Rufiji and Wami-Ruvu river basins. Afr J Aquat Sci. 40(1):37–45.
- Kirkpatrick LA, Feeney BC. 2012. A simple guide to IBM SPSS: for version 20.0. Ontario (CA): Nelson Education.
- Kleynhans CJ. 1996. A qualitative procedure for the assessment of the habitat integrity status of the Luvuvhu River (Limpopo system, South Africa). J Aquat Ecosyst Stress Recov. 5(1):41–54.
- Larsen S, Ormerod SJ. 2010. Low‐level effects of inert sediments on temperate stream invertebrates. Freshwater Biol. 55(2):476–486.
- Lowe S, Dallas H, Kennedy M, Taylor JC, Gibbins C, Lang P, Sichingabula H, Find K, Ntobolo C, Kabangu K, et al. 2013. The SAFRASS biomonitoring scheme: general aspects, macrophytes (ZMTR) and benthic macroinvertebrates (ZISS) protocols. SAFRASS Deliverable Report to the ACP Group Science and Technology Programme. Glasgow Scotland (UK): University of Glasgow. Contract No. AFS/2009/219013.
- Mandahl-Barth G. 1954. The freshwater mollusks of Uganda and adjacent territories. Tervuren, Denmark: Danish Bilharziasis Laboratory. 1–192.
- Mayfield MM, Bonser SP, Morgan JW, Aubin I, McNamara S, Vesk PA. 2010. What does species richness tell us about functional trait diversity? Predictions and evidence for responses of species and functional trait diversity to land‐use change. Glob Ecol Biogeogr. 19(4):423–431.
- Meybeck M. 2003. Global analysis of river systems: From Earth system controls to Anthropocene syndromes. Philos Trans R Soc Lond B Biol Sci. 358(1440):1935–1955.
- Nilsson C. 1987. Distribution of stream-edge vegetation along a gradient of current velocity. J Ecol. 75(2):513–522.
- Ogwal JJ. 2017. . Population Structure of the Cycad along River Mpanga, Western Uganda. AFJRD. 2(1):95–103.
- Ojija F, Laizer H. 2016. Macro invertebrates as bio indicators of water quality In Nzovwe stream, In Mbeya, Tanzania. Int J Sci Technol Res. 5(6):211–222.
- Palmer RW, Taylor ED. 2004. The Namibian Scoring System (NASS) version 2 rapid bio-assessment method for rivers. Afr J Aquat Sci. 29(2):229–234.
- PROTOS, MWE. 2011. Involving local communities in preparing a long term CC and IWRM action plan to enhance their adaptive capacity to CC, and integrate improved water management in the Mpanga Catchment of the Nile Basin in Uganda. Available at https://nilebdc.wikispaces.com/file/…/Mpanga+Catchment+-+Uganda+-+PROTOS.doc
- Reinhardt J, Liersch S, Abdeladhim M, Diallo M, Dickens C, Fournet S, Hattermann FF, Kabaseke C, Muhumuza M, Mul L, Pilz T, Otto IM, Walz A. 2018. Systematic evaluation of scenario assessments supporting sustainable integrated natural resources management: evidence from four case studies in Africa. Ecol Soc. 23(1):5.
- Republic of Uganda. 2012. Uganda Vision 2040, 1–120.
- Resh VH, Norris RH, Barbour MT. 1995. Design and implementation of rapid assessment approaches for water-resource monitoring using benthic macroinvertebrates. Austral Ecol. 20(1):108–121.
- Ribera I, Beutel RG, Balke M, Vogler AP. 2002. Discovery of Aspidytidae, a new family of aquatic Coleoptera. Proceedings of the Royal Society of London. Series B: Biol Sci. 269(1507): 2351–2356.
- Rios SL, Bailey RC. 2006. Relationship between riparian vegetation and stream benthic communities at three spatial scales. Hydrobiologia. 553(1):153–160.
- Spiridonov SE. 2003. A Chordodid Worm (Nematomorpha, Gordiacea) from Orenburg Region of Russia. Vestn.zool. 37(1): 85–88.
- Stals R, De Moor IJ. 2007. Guides to the freshwater invertebrates of Southern Africa. Coleoptera. South African Water Research Commission Report TT, 320(07).
- Stein K, Stenchly K, Coulibaly D, Pauly A, Dimobe K, Steffan-Dewenter I, Konaté S, Goetze D, Porembski S, Linsenmair KE. 2018. Impact of human disturbance on bee pollinator communities in savanna and agricultural sites in Burkina Faso, West Africa. Ecol Evol. 8(13):6827–6838.
- Taylor BR. 1997. Rapid assessment procedures: Radical re-invention or just sloppy science? Hum Ecol Risk Assess. 3(6):1005–1016.
- Townsend CR, Scarsbrook MR, Dolédec S. 1997. The intermediate disturbance hypothesis, refugia, and biodiversity in streams. Limnol Oceanogr. 42(5):938–949.
- United States Environmental Protection Agency (USEPA). 2005. Baseline water quality data inventory and analysis: Golden Gate National Recreation Area. National Park Service. 1215. http://www.nature.nps.gov/water/horizon.cfm
- Vörösmarty CJ, McIntyre PB, Gessner MO, Dudgeon D, Prusevich A, Green P, Glidden S, Bunn SE, Sullivan CA, Liermann CR, et al. 2010. Global threats to human water security and river biodiversity. Nature. 467(7315):555–561.
- Whittaker RH, Levin SA, Root RB. 1973. Niche, habitat, and ecotope. Am Nat. 107(955):321–338.
- Whittaker RH. 1956. Vegetation of the great smoky mountains. Ecol Monograph. 26(1):1–80.
- Willig MR, Presley SJ. 2018. Biodiversity and Disturbance. The Encyclopedia of the Anthropocene. 3:45–51.