
 ?Mathematical formulae have been encoded as MathML and are displayed in this HTML version using MathJax in order to improve their display. Uncheck the box to turn MathJax off. This feature requires Javascript. Click on a formula to zoom.
Abstract
In this study, the effects of short-term aerobic conditions on phosphorus (P) mobility in sediment were investigated in the eutrophic lakes. To accomplish this, an indoor cultivation system was established and short-term cultivation (3, 8 and 15 days) was conducted under control and aerobic treatments. High-resolution diffusive gradients in thin films (DGT) and dialysis (HR-Peeper) techniques were used to determine the mobility patterns of P in sediments. The results showed that: (1) Aerobic treatment significantly increased oxygen concentrations (maximum 17.1%) in overlying water within 15 days, with no significant effects on sediment oxygen penetration depth or redox potential. Additionally, aerobic treatment inhibited soluble reactive phosphorus (SRP) and DGT-labile P release from sediment to overlying water. (2) Aerobic treatment decreased the pore water SRP and soluble Fe(II) on day 3 with no impact on sediment SRP/DGT-labile P and soluble/DGT-labile Fe on day 8 and 15. (3) Model simulation using DGT Induced Fluxes in Sediments (DIFS) showed that the pore water SRP replenishment ability of sediment particle P was lower in the aerobic group than the control group, and the sediment system equilibration time was elongated after pore water SRP decreased in the aerobic group on day 3. (4) On day 3, SRP and soluble Fe(II), DGT-labile P and DGT-labile Fe showed significant positive correlations (r > 0.888, p < 0.001), indicating that reduced pore water SRP concentration was related to decreased pore water soluble Fe(II).
1. Introduction
Lake water eutrophication has become a serious global environmental problem (Ding et al. Citation2018; O'Neil et al. Citation2012). Phosphorus (P) has been recognized as the limiting nutrient for the eutrophication (Schindler et al. Citation2016). Sediment is the sinks and sources of P pollutants in the water column (Chen et al. Citation2018). Phosphorus present in the sediments can be released into the water column, hindering water quality improvement and sustaining the lake eutrophication for 5-15 years after the decrease of external P input (Watson et al. Citation2016; Welch and Cooke Citation2005). According to the classic phosphorus (P)-iron (Fe) coupling theory proposed by Mortimer (Citation1941), Fe(II) is oxidized into Fe(III) and P is absorbed under aerobic conditions, while Fe(III) is reduced into Fe(II) and P is released under anaerobic conditions.
However, traditional destructive sampling methods, such as centrifugation, vacuum (Bertolin et al. Citation1995), and the Rhizon (Seeberg-Elverfeldt et al. Citation2005) methods have commonly been employed for sediment P mobility studies, resulting in destruction of sediment structure and changes in sediment properties because of contact with air. Thus, the actual internal P mobility processes could not be reflected properly because of large errors (Wu and Wang Citation2017). Moreover, the low resolution analyses (cm level) provided no practical evidence of P-Fe coupling theory. To overcome these defects, in situ microelectrode measurement, high-resolution dialysis (HR-Peeper) and diffusive gradients in thin films (DGT) were developed (Chen X. et al. Citation2016; Xu et al. Citation2012a; Ding et al. Citation2013, Citation2015; Lewandowski and Hupfer Citation2005; Zhang et al. Citation1998). Microelectrode (Unisense, Denmark) sensitivity is on the micrometer level, and the precision of the three-dimensional control moter was found to be up to 1 micrometer, with almost no disturbance caused during the measurement of sample structures (Revsbech et al. Citation1980). This technique possesses advantages such as high accuracy, low detection limit, rapid response, and the ability to be conducted in situ in a non-destructive manner. The HR-Peeper is based on diffusion equilibrium. For analysis using the HR-Peeper, the device is filled with deionized water, after which pore water P and Fe(II) are allowed to freely diffuse into the device through an exposed window after it is placed into sediments. When conducting analysis with this device, diffusion equilibrium is achieved after 48 h, and the P and Fe(II) concentrations represent the actual pore water SRP and soluble Fe(II) concentrations (Xu et al. Citation2012a). The DGT technique, which was proposed by (Davlson and Zhang Citation1994), is based on Fick's first law. In this method, pore water SRP and soluble Fe(II) pass through a diffusion layer, after which they are adsorbed by an immobilized membrane, which ensures that no SRP or soluble Fe(II) remains in the diffusion layer. When pore water SRP and soluble Fe(II) decrease, sediment P and Fe are replenished into the pore water, resulting in a new liquid-solid phase equilibrium. The DGT measures the active sediment labile P/Fe, and the average P and Fe adsorbed on the DGT binding membrane after 24 h represent the sediment labile P/Fe concentrations (Ding et al. Citation2013). These methods cause minor damage to sediments and prevent the sample from coming into contact with air, thereby improving the accuracy of the collected samples.
On the other hand, aeration technologies have been generally used to improvement the water quality in the eutrophic fresh water environment (Xu and Cao Citation2006). However, the mobility of P in sediments on the aeration training was still not clear. In the present study, the pore water SRP and soluble Fe(II) and information regarding sediment labile P/Fe were acquired using the HR-Peeper and DGT techniques, and the sediment P mobility processes in a eutrophic lake under the aerobic condition were investigated. We also attempted to verify the P-Fe coupling theory and provide scientific evidence for elucidation of the eutrophic lake sediment P release mechanism.
2. Materials and methods
2.1. Experimental design
Six sediment cores (9 cm in diameter, 30 cm in length) using for laboratory simulation experiments were collected on 10th November, 2014 from the sampling site (31°24′12.5″N, 120°42′21.3″) in Yangcheng Lake a small eutrophic shallow lake in China. The lake area, average water depth, and the water depth of sampling site were 18 km2, 2.05 m, and 2.2 m, respectively. Overlying water was collected together with surface mud using a Petersen grab sampler (length × width × height = 36 × 20 × 15 cm). The TN, TP, TOC, and pH values in the sampling sediments were 3.68 g/kg, 0.42 g/kg, 29.35 g/kg, and 7.5, respectively. The sediments average particle size was 0.049 mm including 60.3% silt, 21.2% sand, and 19.5% clay. The temperature in the overlying water and air were 20 and 25 °C, respectively. The concentrations of TN, NH4, NO3, TP, and PO4 in the overlying water were 1.23, 0.37, 0.51, 0.65, and 0.25 mg/L, respectively. Collected samples were delivered to the laboratory as soon as possible, after which they were sectioned at a 2 cm interval and filtered (0.6 mm diameter) to remove large particles and zoobenthos. The same depth sediments were putted together and thoroughly homogenized. About 11 layers (22 cm high) sediments were placed into six tubes (9 cm diameter, 30 cm length) according to their original depth. After that, the tubes were divided evenly into two polythene barrels (45 cm high), filled with overlying water, pre-cultured in a constant temperature (22 °C) cultivation system at least 16 days to stabilization. Three sediment tubes in one barrel were connected with aerobic devices, where air was introduced at a flow rate of 0.8 L/min to provide continuous aerobic conditions (the concentration of DO > 2 mg/L (Munger et al. Citation2016)) (aerobic group), while the other three were placed in a barrel without aerobic conditions (control group).
2.2. Sample collection and analysis
2.2.1. Preparation of HR-Peeper and DGT devices
Pore water SRP and soluble Fe(II) were measured together using a HR-Peeper device that was prepared according to (Xu et al. Citation2012a). First, the device was filled with deionized water (avoiding air bubbles), after which it was covered with 0.45 μm diameter nitrocellulose membrane (Whatman); finally, stuck the window (1.8 cm × 15 cm) to membrane and tighten the device. The device was then placed into deionized water, purged with nitrogen more than 16 h and then stored until use. Two DGT devices were prepared with Zr-oxide and ZrO-Chelex binding membrane, respectively. First, the binding membrane was placed on the bottom of the device, after which it was sequentially covered with an agarose diffusive gel and a 0.45 μm diameter nitrocellulose membrane (Whatman) (avoiding air bubbles), closed and tightened. The device was then placed into 0.01 M NaCl and stored until use.
2.2.2. Sample collection
The system was exposed to continuous aerobic conditions for 15 days, during which time 2 ml of overlying water were collected daily and filtered through a 0.45 μm diameter nitrocellulose filter, after which the SRP concentrations were measured immediately. On day 3, 8 and 15, the sediments DO and Eh were measured using a microelectrode (OX-100 and RD-500, respectively; Unisense, Denmark). The HR-Peeper device was then placed in the sediments at about 12 cm depth for 24 h, after which the DGT device was added. After another 24 h, both devices were removed simultaneously and cleaned of particles. Next, one core from each group was selected, separated into seven layers (0–0.5 cm, 0.5–1 cm, 1–2 cm, 2–3 cm, 3–4 cm, 4–5 cm and 5–6 cm) and then used for P fractions measurement.
2.2.3. Measurement of SRP and Fe concentration
Briefly, 2 ml of overlying water were collected from 0.5 cm above the sediment-water interface every hour for 5 h. Following filtration, the overlying water SRP was measured by molybdenum blue colorimetry as reported by Murphy and Riley (Citation1962). First, 200 μL of water were added into a 96-well plate, after which 20 μL of Mo-Sb colorimetric reagent (sample: reagent = 10: 1) were added. Samples were subsequently subjected to 45 min of shaking in 35 °C to enable sufficient coloration to occur, after which samples were analyzed within 2 min at 700 nm using a microplate reader (M2e, Molecular Devices, USA). Finally, the actual P concentrations were calculated according to a standard curve. For pore water SRP, samples (6 μL) were pipetted from each HR-Peeper cell and added into a 384 microplate, after which 24 μL deionized water and 3 μL colorimetric reagent were added (sample: reagent = 10: 1). The samples were then processed as described for the overlying water SRP measurement.
For pore water soluble Fe(II), samples (6 μL) were pipetted from each HR-Peeper cell and added into a 384 microplate, after which they were diluted to 15 μL using 0.1 M HCl. Next, 1.5 μL reducing agent (1% hydroxylamine hydrochloride) and 15 μL colorimetric reagent (0.5% phenanthroline: acetic acid buffer 1:1) were added and samples were subjected to 20 min of shaking at 35 °C. Samples were examined at 520 nm using a microplate reader. The absorbance at 520 nm was then read and converted into actual pore water soluble Fe(II) concentrations by comparison to a standard curve (Tamura et al. Citation1974).
2.2.4. Measurement of DGT-labile P and Fe
The two-dimensional distribution of sediment DGT-labile P was determined as described by Ding et al. (Citation2013) using a DGT device with a Zr-oxide binding membrane. Briefly, the DGT device was laid face up in a small plot, after which 300 ml of colorimetric reagent (deionized water: Mo-Sb colorimetric reagent = 10:1) was added and samples were incubated for 45 min in 35 °C. The samples were then washed 2–3 times with ice water, after which the device surface was dried using filter paper. The binding membrane was subsequently scanned at 600 dpi resolution, after which a blue two-dimensional picture was acquired and converted into grey levels (42 μm × 42 μm resolution) using image J (from http://rsb.info.nih.gov/ij). Finally, the DGT-labile P accumulation in the membrane was calculated using a grey level-concentration conversion standard curve.
For one-dimensional DGT-labile P/Fe, the ZrO-Chelex binding membrane was removed from the DGT device, placed on a ceramic slicer and cut into 1 mm wide pieces, then placed into 1.5 ml centrifuge tubes one by one and numbered according to depth. Next, 400 µL 1 mol/L HNO3 was added, after which samples were incubated for 16 h and HNO3 was then transferred into a new 1.5 ml centrifuge tube and used for DGT-labile Fe measurement. Subsequently, 400 μL deionized water was added into the previous tube to remove the residual HNO3 for 2 h, after which the residual water was removed and 400 μL 1 mol/L NaOH were added. Following 16 h of incubation, the membrane was removed and the liquid remaining in the tube was used for measurement of DGT-labile P (Xu et al. Citation2013). The DGT-labile P/Fe was measured using microcalorimetry as for the HR-Peeper using 200 µL samples and 96-well plates; however, the colorimetric reagents were increased accordingly.
Sediment P fractionation was conducted using the SMT method (Ruban et al. Citation2001). The P species in sediments were divided into five fractions: total P (TP), inorganic P (IP), organic P (OP), NaOH-P (P associated with Fe, Mn, and Al oxides and hydroxides), and HCl-P (P bound to Ca).
2.3. Calculation and statistical analysis
The DGT-labile P/Fe accumulation (M) adsorbed on the DGT membrane was measured through HNO3 and NaOH extraction, after which the actual sediment DGT-labile P/Fe concentrations were calculated according to formula (1) (Davison and Zhang Citation2012; Ding et al. Citation2010; Xu et al. Citation2013).
(1)
(1)
where D represents the diffusion index of P and Fe in the diffusion layer at 22 °C, A represents the contact area of the DGT window and sediment (1.8 mm2), t represents the deployment time; Δg represents the thickness of the diffusive layer.
The DIFS model was developed by (Harper et al. Citation1998) to simulate pore water metal ions replenishment from sediment solid particles. The DIFS model can be used to investigate phosphate release from the sediment-water interface (Xu et al. Citation2012b), as well as the pore water SRP replenishment ability of sediment solid particles (Chen et al. Citation2016a). This model combines the dynamics method based DGT technique and the HR-Peeper technique to calculate the dynamic characteristics of sediment-water interface phosphate mobility between sediment and pore water and analyze the kinetic characteristics of P mobility in the sediment-water interface (Harper et al. Citation2000). The DIFS model was calculated according to formula (2)–(5).
(2)
(2)
(3)
(3)
(4)
(4)
(5)
(5)
Where R represents the ratio of DGT-labile metal concentration to soluble metal concentration, Kd represents the distribution coefficient, Tc represents the exchange process response time, k1 represents the adsorption rate constants, and k-1 represents the desorption rate constants.
The DO, P and Fe in different treatment groups were compared using one-way repeated ANOVA, with different groups as the host variables. If significant differences existed between two groups (p < 0.05), Tukey’s post hoc test was then conducted to identify significant differences between groups at each time point. All significant differences between two groups identified by Tukey’s post hoc test were marked in the respective figures (*p < 0.05, **p < 0.01, ***p < 0.001) or identified in tables, if needed. All statistical analyses were performed using SPSS17.0 (SPSS, USA). Pictures were plotted using Surfer 10.0 and Origin 8.0.
3. Results
3.1. Changes in DO and Eh values in sediments
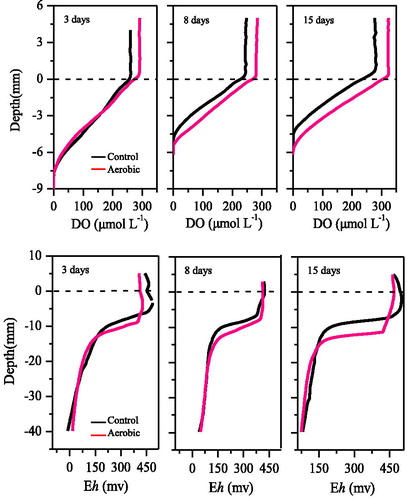
Sediment DO and Eh in the control and aerobic treatments are shown in . The overlying water DO concentration increased significantly in the aerobic treatment (one-way ANOVA, treatment effect, p < 0.000), with the greatest increase occurring on day 15 (Tukey’s HSD test, p < 0.000) (17.1%). However, aerobic treatment had little effect on oxygen penetration depth (OPD) in sediments. The OPD only a slightly increased on day 15 (one-way ANOVA, treatment effect, p = 0.030). The OPD of the aerobic treatment (6.2 mm) was 0.8 mm higher than that of the control treatment (5.4 mm) on day 15, indicating that oxygen diffused slowly. The vertical variation in Eh was consistent with that of OPD. Specifically, 15 days of continuous aerobic conditions did not significantly increase the sediment Eh (one-way ANOVA, treatment effect, p > 0.411).
Figure 1. DO and Eh profiles in sediments of aerobic and control treatments.
3.2. Phosphorus mobility in aerobic sediments
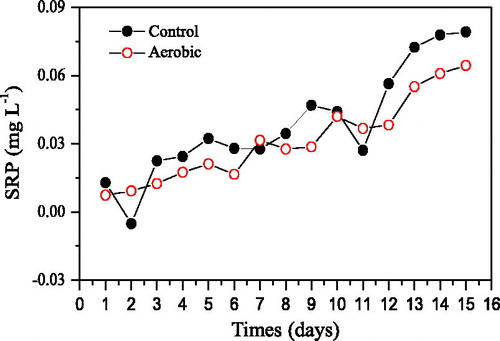
As shown in , the SRP in both groups increased as cultivation days increased, indicating that sediments released SRP to overlying water during the 15 days of cultivation. The overlying water DO in the aerobic group was higher than in the control group throughout the entire cultivation period (), which inhibited the release of SRP from sediment to overlying water; thus, the overlying water SRP in the aerobic group was lower than in the control group. As shown in , the overlying water SRP in the aerobic group was only higher than that in the control group on day 3 and 11, while it was lower in the other 13 days. On day 15, aerobic conditions decreased the overlying water SRP by 21% on average.
Figure 2. Effects of aerobic conditions on SRP concentrations in overlying water during 15 days of incubation.
Compared to the control, the aerobic treatment did not affect the overlying water SRP concentration in the 3-day, but decreased it gradually in the 8- and 15-day (). The variation in overlying water SRP measured using the HR-Peeper was consistent with that measured directly. However, the variations in the pore water SRP differed from those observed in the overlying water. Specifically, 3 days of continuous aerobic significantly influenced the pore water SRP (one-way ANOVA, treatment effect, p < 0.000), with the levels in the aerobic group being 34% lower than those in the control at depths of -10 mm to -60 mm. After day 3, the effects decreased gradually, and there were no differences in pore water SRP on day 15 (one-way ANOVA, treatment effect, p = 0.291). The variations in pore water SRP were consistent with those of OPD ().
Figure 3. Effects of aerobic conditions on P concentrations in sediment profiles.
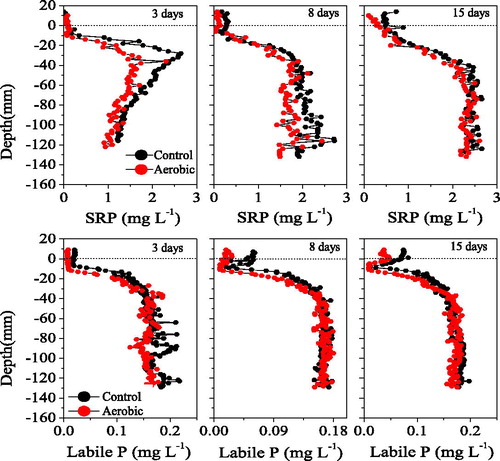
Three days of continuous aerobic conditions also affected the sediment DGT-labile P (one-way ANOVA, treatment effect, p = 0.009), as indicated by a decrease in DGT-labile P of 13% relative to the control. However, no significant differences in DGT-labile P were observed on day 8 or 15 (one-way ANOVA, treatment effect, p > 0.117) (). DGT-labile P increased gradually from 0 to −30 mm (maximum 0.2 mg/L), then remained stable until −120 mm.
The variations in overlying water DGT-labile P measured by DGT were consistent with those of overlying water SRP. Specifically, the DGT-labile P of the two groups did not differ significantly on day 3, while the overlying water DGT-labile P concentration in the aerobic group decreased gradually after day 3, which was also consistent with that of overlying water DO.
As shown in , the sediment in the control group released DGT-labile P to the overlying water, which caused the average concentrations of overlying water DGT-labile P to increase from 0.13 mg/L on day 3 to 0.18 mg/L on day 15. Aerobic conditions significantly decreased the overlying water DGT-labile P concentrations in the aerobic group, which were lower than those in the control group at all three sampling points. The increase of overlying water DO oxidized the aerobic metals and adsorbed the overlying water DGT-labile P, causing the DGT-labile P to decrease.
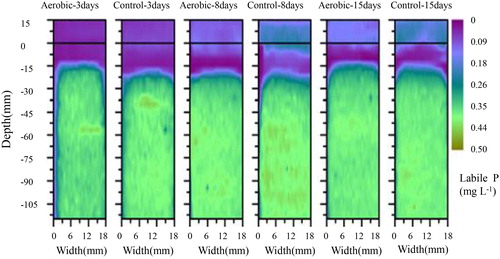
The two-dimensional DGT-labile P concentrations did not differ significantly between groups (). On day 3, the sediment DGT-labile P in the aerobic group showed similar changes as the control group, being very low at 0 to −15 mm in the control group, then increasing from −15 mm to −30 mm, and then remaining stable until −110 mm. On day 8 and 15, the variations in the two groups were similar to those observed on day 3. These findings indicated that aerobic conditions had little effect on sediment DGT-labile P, similar to the one-dimensional DGT-labile P pore water SRP pattern ().
Figure 4. Effects of aerobic conditions on two-dimensional labile P concentrations in sediment.
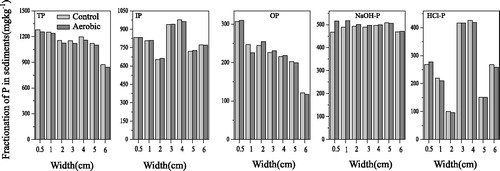
Phosphorus fractionation was conducted on day 3 of aerobic cultivation (). The NaOH-P of the aerobic group at 0–0.5 cm increased significantly (one-way ANOVA, treatment effect, p < 0.05), while the TP, IP, OP and HCl-P showed no significant differences (one-way ANOVA, treatment effect, p > 0.05). From 1 to 6 cm, all combined P showed no significant differences (one-way ANOVA, treatment effect, p > 0.05). These results indicated that 3 days of continuous aerobic cultivation only affected the surface sediment NaOH-P, and that it had no effects on sediments below 1.0 cm. Sediment NaOH-P was mainly affected by Eh, since the free diffusion of DO was slow, and 3 days of aerobic cultivation did not increase the OPD significantly (); thus, no effects on deep layer sediment NaOH-Ps were identified. Moreover, changes in TP, IP, OP and HCl-P required a relatively long time; thus, no significant differences were detected in this study because of the short cultivation period.
Figure 5. Fractionation of P in the upper 4 cm sediments with and without aerobic treatment.
3.3. Changes in Fe concentration in aerobic sediment
Pore water soluble Fe(II) changes are shown in . The effects of aerobic conditions on soluble Fe(II) and soluble P were similar. Specifically, 3 days of aerobic conditions decreased the pore water soluble Fe(II) by 16%, but no significant differences in this value were observed between the control and aerobic groups on day 8 or 15 (one-way ANOVA, treatment effect, p > 0.139). For overlying water measured using the HR-Peeper, aerobic conditions decreased the overlying water soluble Fe(II) by 59%.
Figure 6. Effects of aerobic conditions on Fe concentrations in sediment profiles.
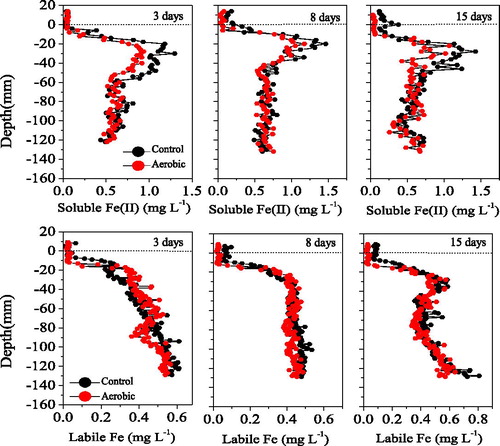
The variations in DGT-labile Fe were consistent with those in DGT-labile P. Specifically, aerobic conditions showed no effects on sediment DGT-labile Fe (one-way ANOVA, treatment effect, p > 0.05), while these conditions slightly decreased the overlying water DGT-labile Fe by 7%, 65% and 69% on 3, 8 and 15 days, respectively.
Aerobic conditions decreased the pore water SRP and soluble Fe(II) on day 3, but had no effects on sediment DGT-labile P or Fe, neither effects on SRP and soluble Fe(II) on day 8 and 15. Thus, the correlation between SRP and soluble Fe(II), as well as that between DGT-labile P and DGT-labile Fe on day 3 were analyzed by Pearson’s test (). Significantly positive correlations were observed between SRP and soluble Fe(II), as well as DGT-labile P and DGT-labile Fe on day 3 (r > 0.888, p < 0.001). These results showed that decreased pore water SRP concentrations in the aerobic group were related to decreased pore water soluble Fe(II).
Table 1 Correlation analyses between soluble/labile P and Fe.
3.4. Kinetics of phosphorus mobilization
On day 3, the replenishment kinetic abilities of the surface 0–4 cm sediment P from the solid phase to the liquid phase on day 3 was simulated by the DIFS model (). The average R value of the 0–4 cm sediment was lower for the aerobic group (0.079) than the control group (0.087). The sediment Kd and Tc values in the aerobic group (800.491 cm3/g for Kd and 3803 s for Tc) was higher than those of the control group (662.405 cm3/g for Kd and 3132 s for Tc). In contrast, the k1 and k-1 values in sediment of the aerobic group (2.630 × 10⁻⁴ s−1 and 5.494 × 10⁻⁷ s−1) were lower than those in the control group (3.193 × 10⁻⁴ s−1 and 8.278 × 10⁻⁷ s−1).
Table 2 DIFS model input and output parameters in the surface 0–4 cm sediment on day 3.
4. Discussion
Previous studies reported that the mobility of P in sediment was mainly controlled by the redox reaction of Fe (Ding et al. Citation2016; Chen M. et al. Citation2016; Smith et al. Citation2011; Wu and Wang Citation2017). In this study, strong positive correlations between SRP with soluble Fe(II) and between DGT-labile P with DGT-labile Fe supported this P-Fe coupling theory (). On day 3, aerobic treatment increased the overlying water DO (), after which DO diffused further into sediments and changed the sediment Eh. This, in turn, oxidized the surface sediment Fe(II) and overlying water Fe(II) into Fe(III) oxyhydroxides (Lewandowski and Hupfer Citation2005; Xu et al. Citation2012a), which were precipitated, leading to the black sediment at the sediment-water interface becoming brown. In addition, this process decreased the pore water soluble Fe(II), overlying water soluble Fe(II) and DGT-labile Fe by 16% (). The newly formed Fe(III) oxyhydroxides adsorbed SRP and DGT-labile P from overlying water and sediments (Einsele Citation1936; Søndergaard et al. Citation2003; Ding et al. Citation2018; Giles et al. Citation2016), fixed the P into sediment as NaOH-P (Chen et al. Citation2015; Lewandowski et al. Citation2007), decreased the SRP and DGT-labile P concentrations in overlying water and sediments (), and increased the NaOH-P in the surface 0–0.5 cm sediments ().
Moreover, the R value in the aerobic sediments was lower than that in the control sediments (), indicating that the SRP replenishment abilities of sediment particles in the aerobic group were lower than those of the control group (Harper et al. Citation1998). The sediment Kd value in the aerobic sediments was higher than that in the control sediments, indicating a stronger P fixation ability of solid sediment in the aerobic group (Xu et al. Citation2012b). The Tc value in the aerobic sediment was also higher than that in the control sediments, indicating that the equilibrium time of the sediment system under the aerobic condition was longer (Chen et al. Citation2016a; Harper et al. Citation2000). The k1 and k-1 values in the aerobic sediments were lower than in the control group, indicating the relatively slow adsorption and desorption processes in the sediment particle under the aerobic condition were consistent with the lower Tc values of the sediment system. Those indicated that the sediment particles under the aerobic condition showed lower SRP replenishment abilities, and aerobic condition inhibited the sediment particle release of P.
On day 8 and 15, aerobic cultivation deceased only the overlying water SRP and DGT-labile P concentrations, while it had no effects on sediment DGT-labile P and pore water SRP. This might have occurred because the DO free diffusion rate was low, with no external perturbations that damaged the sediment structures; therefore, the overlying water DO could not permeate into sediment, increase the oxygen penetration depth, or change the sediment redox condition. As a result, the sediment Fe(II) were not oxidized and had no effects on sediment SRP and DGT-labile P.
5. Conclusions
During 15 days of cultivation, aerobic treatment significantly increased the overlying water DO, inhibited the SRP and DGT-labile P release of sediment to overlying water, and decreased the pore water SRP and soluble Fe(II) on day 3. The decrease pore water SRP was related to the redox reaction of pore water soluble Fe(II). The DIFS model simulation results showed that the SRP replenishment rates of sediments in both the aerobic and control groups were very low. However, the P fixation abilities of solid sediment in the aerobic group were higher than those in the control group, and aerobic treatment slightly inhibited the release of P from sediment particles to pore water on day 4. Aerobic treatment had no significant effects on the SRP/DGT-labile P and soluble/DGT-labile Fe on day 8 or 15.
Notes on contributors
Wenming Yan is an associate professor in Hohai University, China. She studies environmental hydrology and water environment protection in shallow lakes.
Ling Liu is a professor in Hohai University, China. She is an ecologist who studies the aquatic biological diversity in rivers and lakes.
Tingfeng Wu is an associate professor in Nanjing Institute of Geography and Limnology, Chinese Academy of Sciences, China. He studies environmental hydrodynamics in shallow lakes.
Lanlan Song is an associate professor in Hohai University, China. She is good at ecological environment assessment.
Han Wang is an MSc student. China. He studies ecological water conservancy.
Zhanjin Lu is an engineer in Chongqing Research Institute of Coal Science and Industry Group Co., Ltd., China. He studies water resources and water environment.
Botao Li is an MSc student. China. He studies the structure characteristics of plankton community in the rivers.
Yan Zhu is an MSc student. China. She studies the structure characteristics of plankton community in the rivers.
Acknowledgments
This work was supported by the National Key R&D Program of China (2017YFC0405205), National Natural Science Foundation of China (Nos. 41701568, 41301531 and 51279060), Key Research Program of Frontier Sciences, Chinese Academy of Sciences (QYZDJSSWDQC008), and the “One-Three-Five” Strategic Planning of Nanjing Institute of Geography and Limnology, Chinese Academy of Sciences (NIGLAS2017GH04). We thank Jeremy Kamen, MSc, from Liwen Bianji, Edanz Group China (www.liwenbianji.cn/ac), for editing the English text of a draft of this manuscript.
References
- Bertolin A, Rudello D, Ugo P. 1995. A new device for in-situ pore-water sampling. Mar. Chem. 49(2-3):233–239.
- Chen M, Ding S, Chen X, Sun Q, Fan X, Lin J, Ren M, Yang L, Zhang C. 2018. Mechanisms driving phosphorus release during algal blooms based on hourly changes in iron and phosphorus concentrations in sediments. Water Res. 133:153–164.
- Chen M, Ding S, Liu L, Xu D, Gong M, Tang H, Zhang C. 2016. Kinetics of phosphorus release from sediments and its relationship with iron speciation influenced by the mussel (Corbicula fluminea) bioturbation. Sci Total Environ. 542(Pt A):833–840.
- Chen M, Ding S, Liu L, Xu D, Han C, Zhang C. 2015. Iron-coupled inactivation of phosphorus in sediments by macrozoobenthos (chironomid larvae) bioturbation: evidences from high-resolution dynamic measurements. Environ Pollut. 204:241–247.
- Chen X, Sun Q, Ding S, Chen M, Fan X, Zhang L, Zhang C. 2016. Mobile Arsenic Distribution and Release Kinetics in Sediment Profiles under Varying pH Conditions. Water Air Soil Poll. 228:1–12.
- Davison W, Zhang H. 2012. Progress in understanding the use of diffusive gradients in thin films (DGT) – back to basics. Environ Chem. 9(1):1–13.
- Davlson W, Zhang H. 1994. In situspeciation measurements of trace components in natural waters using thin-film gels. Nature. 367:546–548.
- Ding S, Han C, Wang Y, Yao L, Wang Y, Xu D, Sun Q, Williams PN, Zhang C. 2015. In situ, high-resolution imaging of labile phosphorus in sediments of a large eutrophic lake. Water Res. 74:100–109.
- Ding S, Wang Y, Wang D, Li YY, Gong M, Zhang C. 2016. In situ, high-resolution evidence for iron-coupled mobilization of phosphorus in sediments. Sci. Rep-UK. 6:1–11.
- Ding S, Wang Y, Xu D, Zhu C, Zhang C. 2013. Gel-Based Coloration Technique for the Submillimeter-Scale Imaging of Labile Phosphorus in Sediments and Soils with Diffusive Gradients in Thin Films. Environ Sci Technol. 47(14):7821–7829.
- Ding S, Xu D, Sun Q, Yin H, Zhang C. 2010. Measurement of dissolved reactive phosphorus using the diffusive gradients in thin films technique with a high-capacity binding phase. Environ Sci Technol. 44(21):8169–8174.
- Ding S, Chen M, Gong M, Fan X, Qin B, Xu H, Gao S, Jin Z, Tsang DCW, Zhang C. 2018. Internal phosphorus loading from sediments causes seasonal nitrogen limitation for harmful algal blooms. Sci Total Environ. 625:872–884.
- Einsele W. 1936. Über die Beziehungen des Eisenkreislaufs zum Phosphatkreislauf eutrophen, im eutrophen See. Arch. Hydrobiol. 29:664–686.
- Giles CD, Isles PDF, Manley T, Xu Y, Druschel GK, Schroth AW. 2016. Themobility of phosphorus, iron, and manganese through the sedimentewater continuum of a shallow eutrophic freshwater lake under stratified and mixed water-column conditions. Biogeochemistry. 127(1):15–34.
- Harper MP, Davison W, Tych W. 2000. DIFS—a modelling and simulation tool for DGT induced trace metal remobilisation in sediments and soils. Environ. Modell. Softw. 15(1):55–66.
- Harper MP, Davison W, Zhang H, Tych W. 1998. Kinetics of metal exchange between solids and solutions in sediments and soils interpreted from DGT measured fluxes. Geochim. Cosmochim. Ac. 62(16):2757–2770.
- Lewandowski J, Hupfer M. 2005. Effect of macrozoobenthos on two‐dimensional small‐scale heterogeneity of pore water phosphorus concentrations in lake sediments: A laboratory study. Limnol Oceanogr. 50(4):1106–1118.
- Lewandowski J, Laskov C, Hupfer M. 2007. The relationship between Chironomus plumosus burrows and the spatial distribution of pore-water phosphate, iron and ammonium in lake sediments. Freshwater Biol. 52(2):331–343.
- Mortimer CH. 1941. The Exchange of Dissolved Substances between Mud and Water in Lakes. J. Ecol. 29(2):280–329.
- Murphy J, Riley JP. 1962. A modified single solution method for the determination of phosphate in natural waters. Anal. Chim. Acta. 27:31–36.
- Munger ZW, Carey CC, Gerling AB, Hamre KD, Doubek JP, Klepatzki SD, McClure RP, Schreiber ME. 2016. Effectiveness of hypolimnetic oxygenation for preventing accumulation of Fe and Mn in a drinking water reservoir. Water Res. 106:1–14.
- O'Neil JM, Davis TW, Burford MA, Gobler CJ. 2012. The rise of harmful cyanobacteria blooms: the potential roles of eutrophication and climate change. Harmful Algae. 14:313–334.
- Revsbech NP, Jorgensen BB, Blackburn TH. 1980. Oxygen in the Sea Bottom Measured with a Microelectrode. Science. 207(4437):1355–1356.
- Ruban V, López-Sánchez JF, Pardo P, Rauret G, Muntau H, Quevauviller P. 2001. Harmonized protocol and certified reference material for the determination of extractable contents of phosphorus in freshwater sediments–a synthesis of recent works. Fresen. J. Anal. Chem. 370(2-3):224–228.
- Schindler DW, Carpenter SR, Chapra SC, Hecky RE, Orihel DM. 2016. Reducing phosphorus to Curb Lake eutrophication is a success. Environ Sci Technol. 50(17):8923–8929.
- Seeberg-Elverfeldt J, Schlüter M, Feseker T, Kölling M. 2005. Rhizon sampling of porewaters near the sediment-water interface of aquatic systems. Limnol Oceanogr Methods. 3(8):361–371.
- Smith L, Watzin MC, Druschel G. 2011. Relating sediment phosphorus mobility to seasonal and diel redox fluctuations at the sediment–water interface in a eutrophic freshwater lake. Limnol Oceanogr. 56(6):2251–2264.
- Søndergaard M, Jensen JP, Jeppesen E. 2003. Role of sediment and internal loading of phosphorus in shallow lakes. Hydrobiologia. 506:135–145.
- Tamura H, Goto K, Yotsuyanagi T, Nagayama M. 1974. Spectrophotometric determination of iron(II) with 1,10-phenanthroline in the presence of large amounts of iron(III). Talanta. 21(4):314–318.
- Watson SB, Miller C, Arhonditsis G, Boyer GL, Carmichael W, Charlton MN, Confesor R, Depew DC, Höök TO, Ludsin SA, et al. 2016. The re-eutrophication of Lake Erie: harmful algal blooms and hypoxia. Harmful Algae. 56:44–66.
- Welch EB, Cooke GD. 2005. Internal phosphorus loading in shallow lakes: importance and control. Lake. Reservoir Manage. 21(2):209–217.
- Wu Z, Wang S. 2017. Release mechanism and kinetic exchange for phosphorus (P) in lake sediment characterized by diffusive gradients in thin films (DGT). J Hazard Mater. 331:36–44.
- Xu X, Cao JS. 2006. Application of river aeration technology in river pollution control of Suzhou area. Water Resour. Prot. 22:30–33.
- Xu D, Wei W, Shiming D, Qin S, Chaosheng Z. 2012a. A high-resolution dialysis technique for rapid determination of dissolved reactive phosphate and ferrous iron in pore water of sediments. Sci. Total Environ. 422:245–252.
- Xu D, Ding S, Sun Q, Zhong J, Wu W, Jia F. 2012. Evaluation of in situ capping with clean soils to control phosphate release from sediments. Sci. Total Environ. 438:334–341.
- Xu D, Chen Y, Ding S, Sun Q, Wang Y, Zhang C. 2013. Diffusive gradients in thin films technique equipped with a mixed binding gel for simultaneous measurements of dissolved reactive phosphorus and dissolved iron. Environ Sci Technol. 47(18):10477–10484.
- Zhang H, Davison W, Gadi R, Kobayashi T. 1998. In situ measurement of dissolved phosphorus in natural waters using DGT. Anal. Chim. Acta. 370(1):29–38.