
Abstract
The interactions between bacteria and algae may play a significant part in the formation and development of algal blooms. The bloom-forming cyanobacterium Microcystis occurs mainly as colonial form in natural waters, and thus it is necessary to study the interaction between bacteria and colonial Microcystis. This paper aimed to investigate effects of the cultivable bacteria attached to Microcystis colonies on the colony size and growth of colonial Microcystis aeruginosa. Eleven bacterial strains were isolated from M. aeruginosa colonies collected from Lake Taihu. Among these bacteria, seven bacterial isolates significantly influenced the colony size of M. aeruginosa, and four bacterial isolates significantly influenced the growth rate of M. aeruginosa. Four isolates, related to the Exiguobacterium, Delftia, Bacillus and Stenotrophomonas, significantly decreased the colony size of M. aeruginosa by 36-51%, and two isolates, assigned to the Chryseobacterium and Pseudomonas chengduensis, significantly increased the M. aeruginosa colony size by 89% and 63%, respectively, while these isolates had no effect on the cyanobacterial growth rate. Two isolates, belonged to the Rheinheimera and Pseudomonas, significantly decreased the growth rate of M. aeruginosa by 47% and 36%, respectively, and one bacterial strain related to Aeromonas increased the cyanobacterial growth rate by 22%, while these isolates had no effect on the cyanobacterial colony size. One isolate belonged to Sphingomonas was found to significantly increase the colony size of M. aeruginosa by 80% and significantly decrease the growth rate of M. aeruginosa by 21%. PCR-denaturing gradient gel electrophoresis (PCR-DGGE) analysis showed that all of the bacterial isolates were able to colonize M. aeruginosa colonies. Our data suggested that the bacteria attached to Microcystis colonies might influence the cyanobacterial colony size and growth, and thus influence the formation and development of Microcystis blooms.
1. Introduction
Cyanobacterial blooms have become a common occurrence in eutrophic freshwater bodies worldwide. Among bloom-forming cyanobacteria, Microcystis spp. are the most commonly reported species in lakes and reservoirs. It is well known that Microcystis occurs mainly as colonial aggregates constrained by mucilaginous matrix in natural waters (Otsuka et al. Citation2000). However, Microcystis colonies separate into single cells following long-term cultivation under laboratory conditions (Zhang et al. Citation2007). Colony formation is highly important for the competitive advantage of Microcystis over other phytoplankton species in freshwater ecosystems (Yang et al. Citation2011). Formation of colonies is helpful for Microcystis to migrate vertically and defense against predation pressure (Fulton and Paerl Citation1987; Visser et al. Citation2005). Colonial Microcystis exhibits higher photosynthetic activities and can acclimate to iron deficiencies better than unicellular Microcystis (Li et al. Citation2016; Wu and Song Citation2008). Large colonies more readily overcome the stirring effects of water flows, waves and perturbations and gain access to the surface layer to form Microcystis blooms compared with small colonies (Zhu et al. Citation2014). Therefore, large Microcystis colonies are suggested to favor bloom formation (Li et al. Citation2013).
The interactions between bacteria and algae may play a significant part in the formation and development of algal blooms (Kodama et al. Citation2006), and thus have caught increasing attention. Numerous bacteria are embedded in the mucilage of Microcystis spp. (Brunberg Citation1999). The associated bacterial flora depends on both carbon and energy source from Microcystis, and supply Microcystis with vitamin B12, which is required for growth of Microcystis (Xie et al. Citation2016). Phosphorus exchange occurs between Microcystis aeruginosa and its attached bacterium (Pseudomonas sp.) (Jiang et al. Citation2007). Microcystin-degrading bacteria have been found in the mucilage of Microcystis colonies (Maruyama et al. Citation2003). Bacteria attached to Microcystis colonies may induce unicellular Microcystis to form colonies (Shen et al. Citation2011; Wang et al. Citation2016). Shi, Cai, Li, et al. (Citation2009) have reported that bacterial strains isolated from the mucilage of Microcystis colonies influence the growth of unicellular M. aeruginosa positively or negatively. As Microcystis occurs mainly as colonial form in natural waters, it is essential to study the interaction between bacteria and colonial Microcystis. The aim of this study was to investigate effects of the bacteria attached to Microcystis colonies on the colony size and growth of colonial M. aeruginosa.
2. Materials and methods
2.1. Bacterial isolation
Microcystis colonies were collected from Lake Taihu (Jiangsu, China) in August, 2017. Healthy M. aeruginosa colonies were picked under an optical microscope according to the morphological classification (Yu et al. Citation2007). To remove free-living bacteria, M. aeruginosa colonies were washed 10 times on sterile 20-μm nylon screen with sterile BG11 medium (Rippka Citation1988). One drop of BG11 medium from the last washing step was inoculated on a R2A agar plate (Reasoner and Geldreich Citation1985), and no bacterial colonies were found after 96 hours of incubation at 28 °C. M. aeruginosa colonies were then spread onto R2A agar plates, and incubated at 28 °C. Bacterial colonies of distinct morphologies were picked and purified further on R2A agar plates.
2.2. DNA isolation and sequencing
Bacterial genomic DNA was isolated using the method of Berg et al. (Citation2009). Microbial 16S rRNA gene was amplified with the universal primers pair 27 F (5′-AGAGTTTGATCCTGGCTCAG-3′) and 1492 R (5′-TACGGCTACCTTGTTACGACTT-3′) (Weisburg et al. Citation1991). The amplification was performed with an initial denaturation step of 94 °C for 1 min, followed by 30 cycles of 30 s at 94 °C, 30 s at 50 °C and 2 min at 72 °C, plus a final extension at 72 °C for 7 min. After being checked using 1% agarose gel electrophoresis, PCR products were purified using the SanPrep Column PCR Product Purification Kit (Sangon Biotech, Shanghai, China) and sequenced by GenScript Corporation Ltd. (Nanjing, China). The nucleotide sequences obtained in this study were deposited in GenBank under the accession numbers as shown in , and were compared to known 16S rRNA gene sequences in the GenBank database using BLAST to find the closest relatives.
Table 1. Characterization of 11 bacterial strains isolated from M. aeruginosa colonies based on 16S rRNA gene fragments.
2.3. Determination of the colony size and growth rate of M. aeruginosa
A colonial M. aeruginosa strain which was isolated from Lake Taihu in 2016 was grown in BG11 medium at 25 °C under cool-white fluorescent light at 30 μmol photons m−2 s−1 with a 12:12 h light-dark cycle. Cyanobacterial cultures were manually shaken three times per day. Bacteria were grown in R2A medium at 28 °C with shaking at 160 rpm. Bacterial cultures of exponential stage were harvested by centrifugation, and the cell pellets were rinsed and resuspended with sterile BG11 medium. After the bacterial isolates were inoculated into the cultures of M. aeruginosa, the co-cultures were incubated for 15 days. The control without inoculation of bacterial isolate was carried out at the same time. The density of the inoculated bacterial isolate was 1 × 10⁶ cells mL−1 in the co-cultures, and the initial chlorophyll a (Chl-a) concentration was 0.85 mg L−1.
The colony surface area of M. aeruginosa was used as an indicator for its volume and measured by a micrometer under the optical microscope (Eclipse E100, Nikon, Japan) (Wang et al. Citation2013). The colony was pressed into a thin-cake shape with a glass slide and cover slip before measurement. Fifty colonies were randomly chosen from each Microcystis culture. The growth rate (μ) of M. aeruginosa was measured according to equation: μ = (X2 − X1)/Δt (Wang et al. Citation2014), where X2 and X1 represent the Chl-a content at the time t2 and time t1, respectively, and Δt = t2 − t1. The Chl-a content in cyanobacterial cultures were determined spectrophotometrically after extraction with 95% ethanol (Luo et al. Citation2013). All the experiments were replicated three times.
2.4. Detection of the inoculated bacterial isolates in the colonies of M. aeruginosa through denaturing gradient gel electrophoresis (DGGE)
10 mL of cyanobacterial cultures were sampled after 15 days of incubation. The samples were filtered through a 5.0 μm polycarbonate filter (Isopore Membrane Millipore), and followed by washing 10 times with sterile BG11 medium to remove free-living bacteria. One drop of BG11 medium from the last washing step was inoculated on an agar plate, and no bacterial colonies were found after 96 hours of incubation at 28 °C. The filters were stored at −40 °C for DNA extraction. Microbial DNA was extracted as described by Tillett and Neilan (Citation2000). Partial bacterial 16S rRNA genes were amplified using primers 341f (5′-CCTACGGGAGGCAGCAG-3′) with a 40 bp GC-clamp (5′-CGCCCGCCGCGCGCGGCGGGCGGGGCGGGGGCACGGGGGG-3′) attached to its 5′ end and 907r (5′-CCGTCAATTCMTTTRAGTTT-3′) (Teske et al. Citation1996). A touchdown PCR was performed as described by Shi, Cai, Yang, et al. (Citation2009). The touchdown thermocycling program was as follows: initial denaturation at 94 °C for 5 min; 10 touchdown cycles of denaturation (at 94 °C for 1 min), annealing (at 65-56 °C for 1 min, decreasing 1 °C every cycle) and extension (at 72 °C for 1 min); 20 additional cycles of denaturation (at 94 °C for 1 min), annealing (at 55 °C for 1 min), and extension (at 72 °C for 1 min), and a final extension at 72 °C for 5 min. Amplicons were verified on a 1.2% agarose gel. DGGE was performed with a DGGE-2001 system (CBS Scientific Company, USA). PCR samples were loaded on 6% (wt/vol) polyacrylamide gels containing a 40%–70% linear gradient of denaturant (100% denaturant contains 40% deionized formamide and 7 M urea), and electrophoresis was performed in 1 × TAE running buffer (40 mM Tris, pH 7.4, 20 mM sodium acetate, 1 mM EDTA) at 60 °C for 16 h at 100 V. DGGE gels were stained in 1:10000 diluted GelRed (BIOTIUM, USA) for 30 min and photographed with a BioDoc-It® 220 Imaging System (UVP, USA).
2.5. Statistical analysis
The statistical analysis was carried out in the software IBM SPSS Statistics (version 19, IBM Company, Armonk, New York, USA) by using a one-way analysis of variance (ANOVA) with a Tukey post hoc test. Probability values of < 0.05 were considered statistically significant.
3. Results
3.1. Phylogenetic analysis of the isolated bacterial strains
Eleven bacterial strains were isolated from the mucilage of M. aeruginosa colonies collected from Lake Taihu. The bacterial isolates were assigned to Alphaproteobacteria (2/11), Betaproteobacteria (1/11), Gammaproteobacteria (5/11), Bacteroidetes (1/11) and Firmicutes (2/11) ().
3.2. Effects of the bacterial isolates on the colony size and growth of M. aeruginosa
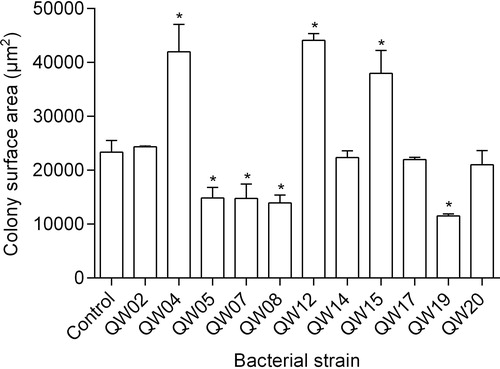
Different responses of M. aeruginosa colony size were observed after inoculation of each bacterial isolate ( and ). At the end of the experiment, four isolates (QW05, QW07, QW08 and QW19) significantly decreased the colony size of M. aeruginosa by 36-51% (P < 0.05), and three isolates (QW04, QW12 and QW15) significantly increased the M. aeruginosa colony size by 63-89% (P < 0.05), while four isolates (QW02, QW14, QW17 and QW20) had no effect on the M. aeruginosa colony size.
Figure 1. The variation curves of the colony surface area of M. aeruginosa inoculated with three selected bacterial isolates which exhibited differential effects on the cyanobacterial colony size. QW19 and QW12 exhibited negative and positive effects, respectively, and QW14 exhibited no effect. Values are means ± standard deviation (n = 3). Open and solid symbols represent control and culture with inoculation of bacterial isolates, respectively.
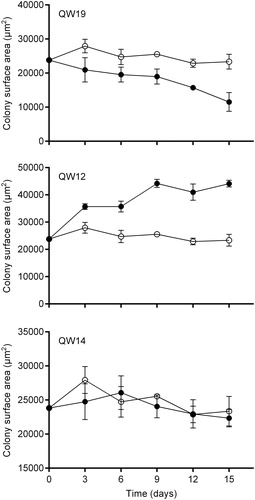
Figure 2. Effects of 11 bacterial isolates on the colony surface area of M. aeruginosa at the end of the test. Each point represents mean ± standard deviation (n = 3). The asterisks (*) indicate P < 0.05 compared to the control.
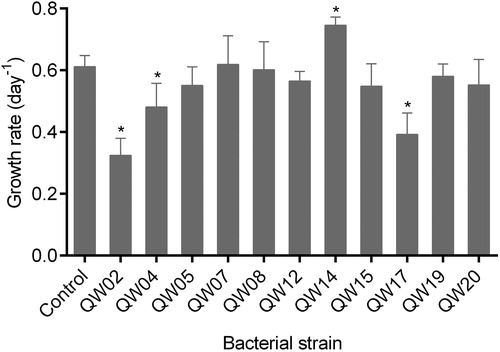
exhibits the effects of 11 bacterial isolates on the growth rate of M. aeruginosa. Three isolates (QW02, QW04 and QW17) significantly decreased the growth rate of M. aeruginosa by 21-47% (P < 0.05). Addition of one isolate (QW14) resulted in a significant increase of cyanobacterial growth rate by 22% (P < 0.05). Moreover, no significant effect on M. aeruginosa growth rate was observed with the other seven isolates (QW05, QW07, QW08, QW12, QW15, QW19 and QW20) (P > 0.05).
Figure 3. Effects of 11 bacterial isolates on the growth rate of M. aeruginosa. Each point represents mean ± standard deviation (n = 3). The asterisks (*) indicate P < 0.05 compared to the control.
Only one bacterial strain (QW04) was found to significantly influence both the growth rate and the colony size of M. aeruginosa ( and ). Six isolates (QW05, QW07, QW08, QW19, QW12 and QW15) had significant effect on the colony size of M. aeruginosa, while had no significant effect on cyanobacterial growth rate. Three isolates (QW14, QW02 and QW17) significantly influenced the cyanobacterial growth rate, while had no significant effect on the cyanobacterial colony size.
3.3. Detection of the inoculated bacterial isolates in the colonies of M. aeruginosa by DGGE
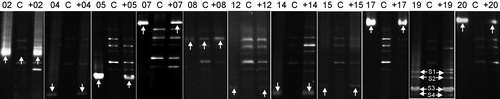
The DGGE profiles showed that each inoculated bacterial strain was present in M. aeruginosa colonies from the culture with addition of the bacterial isolate (). A single DGGE band was observed for 10 isolates (QW02, QW04, QW05, QW 07, QW08, QW12, QW14, QW15, QW17 and QW20), but four bands (S1, S2, S3 and S4) were observed for isolate QW19. The presence of 4 DGGE bands from strain QW19 was consistent with the previously reported four V3 region copies in the genome of some strains belonged to Stenotrophomonas maltophilia (the closest species of strain QW19) (Michon et al. Citation2012). Two isolates (QW02 and QW08) were found to be attached to M. aeruginosa colonies from both treatment and control cultures, indicating that they originally existed in the colonies of M. aeruginosa. Nine isolates (QW04, QW05, QW 07, QW12, QW14, QW15, QW17, QW19 and QW20) were presented only in M. aeruginosa colonies from the treatment cultures. The PCR-DGGE analysis showed that each bacterial isolate was able to colonize M. aeruginosa colonies.
Figure 4. DGGE profiles for monitoring bacterial isolates in M. aeruginosa colonies in the cultures. 02, 04, 05, 07, 08, 12, 14, 15, 17, 19 and 20 represent bacterial strain QW02, QW04, QW05, QW07, QW08, QW12, QW14, QW15, QW17, QW19 and QW20, respectively. C represents control cyanobacterial culture. +02, +04, +05, +07, +08, +12, +14, +15, +17, +19, +20 represent treatment cyanobacterial cultures with addition of bacterial strain QW02, QW04, QW05, QW07, QW08, QW12, QW14, QW15, QW17, QW19 and QW20, respectively. White arrows indicate the bands from the inoculated bacterial isolates. Four bands (S1, S2, S3 and S4) were from bacterial strain QW19.
4. Discussion
Sequencing of 16S rRNA gene revealed that all bacterial isolates in this study belonged to Alphaproteobacteria, Betaproteobacteria, Gammaproteobacteria, Bacteroidetes and Firmicutes, which have been previously reported to be among the bacterial community attached to Microcystis colonies collected from Lake Taihu (Cai et al. Citation2014; Shi et al. Citation2010). Alphaproteobacteria, Betaproteobacteria, Gammaproteobacteria and Bacteroidetes have also been found in Microcystis colonies collected from a French lake (the Villerest reservoir) (Parveen et al. Citation2013). Sphingopyxis, Sphingomonas, Stenotrophomonas, Pseudomonas, Rheinheimera and Chryseobacterium (the closest genus of the bacterial isolates QW20, QW04, QW19, QW15, QW02 and QW12, respectively) have been previously detected in Microcystis colonies harvested from Lake Taihu (Cai et al. Citation2014; Shi, Cai, Li, et al. Citation2009; Shi et al. Citation2010). Aeromonas, Exiguobacterium and Bacillus (the closest genus of the bacterial isolates QW14, QW05 and QW08, respectively) are present in Microcystis colonies collected from Lake Taihu, Lake Dianchi and Lake Donghu (China) (Wang et al. Citation2016). Delftia (the closest genus of the bacterial isolate QW 07) is associated with Microcystis blooms occurred in water bodies of Germany, India, Portugal, Wisconsin (USA) and China (Dziallas and Grossart Citation2011). Sphingopyxis, Sphingomonas, Aeromonas, Bacillus, Stenotrophomonas, Pseudomonas, Rheinheimera and Chryseobacterium have also been found to be associated with cyanobacterial blooms occurring in Finnish lakes and rivers (Berg et al. Citation2009). Sphingopyxis and Sphingomonas are involved in degradation of microcystin (Dziallas and Grossart Citation2011; Wang et al. Citation2018). Stenotrophomonas maltophilia is able to fix nitrogen (Liba et al. Citation2006). Pseudomonas may be a provisional phosphorus bank for M. aeruginosa (Jiang et al. Citation2007).
It has been previously reported that the colony size affects the grazing of zooplankton on Microcystis and the colony buoyancy (Han et al. Citation2012; Wu and Kong Citation2009). In this study, seven isolates (QW05, QW07, QW08, QW19, QW04, QW12 and QW15) were found to significantly influence the colony size of M. aeruginosa, suggesting that they might influence zooplankton grazing and vertical migration of Microcystis, and in turn influence the formation and development of Microcystis blooms. Two isolates (QW15 related to Pseudomonas and QW04 assigned to Sphingomonas) increased the colony size of M. aeruginosa. Pseudomonas sp. CM-1 and Sphingomonas sp. CM-2 have been reported to be present in the laboratory-grown Microcystis colonies, but disappeared in the cyanobacterial cultures after the colonies of Microcystis separate into single cells, suggesting that they may be conducive to maintain the colonial form of Microcystis (Wang et al. Citation2015). Sphingomonas is associated with Microcystis in all the samples from laboratory batch experiments, close-to field experiments and water bodies of Germany, India, Portugal, Wisconsin (USA) and China, and thus is considered to be an integral element of Microcystis blooms (Dziallas and Grossart Citation2011). Extracellular polysaccharide (EPS) is considered to be involved in the formation of Microcystis colony (Wang et al. Citation2016). Two compounds tetradecamethylhexasiloxane and octamethylcyclotetrasiloxane which play a crucial role in polymer formation have been previously found in a Microcystis-associated bacterium Shewanella putrefaciens (Wang et al. Citation2016). It might be speculated that certain Microcystis-attached bacteria may stimulate the excretion of Microcystis EPS through producing bioactive compounds, and in turn increase the colony size of Microcystis. On the other hand, two isolates (QW19 belonged to Stenotrophomonas maltophilia and QW08 related to Bacillus) were observed to decrease the colony size of M. aeruginosa in this study. The abundance of Bacillus in Lake Xuanwu (China) is increased from the outbreak to the decline of a Microcystis bloom, and Bacillus dominates the bacterial community at the decline of the bloom (Zheng et al. Citation2008). Stenotrophomonas maltophilia and Bacillus are able to produce polysaccharide lyases (MacDonald et al. Citation2016; Ochiai et al. Citation2007). The colony size of Microcystis in Lake Taihu decreases at the decline of the bloom (Li et al. Citation2013). It might be speculated that certain Microcystis-attached bacteria may decrease the colony size of Microcystis through degrading EPS. However, it needed further investigation.
Similar to the report on unicellular M. aeruginosa (Shi, Cai, Li, et al. Citation2009), some colony-attached bacteria were found to stimulate or inhibit the growth of colonial M. aeruginosa in the present study. Bacterial strain QW14 related to Aeromonas stimulated the growth of colonial M. aeruginosa. A strain of Aeromonas associated with cyanobacterial bloom is reported to enhance the growth of unicellular Microcystis (Berg et al. Citation2009). Nutrient regeneration and production of growth-promoting factors (e.g. vitamins) by heterotrophic bacteria may be possible mechanisms through which bacteria stimulate Microcystis growth (Liu et al. Citation2008; Zhao et al. Citation2012). Consistent with the report on unicellular M. aeruginosa (Shi, Cai, Li, et al. Citation2009), no bacterial isolate with algicidal activity against colonial M. aeruginosa was found in this study, suggesting that no algicidal bacteria were attached to healthy colonies of M. aeruginosa. Two isolates (QW04 belonged to Sphingomonas and QW17 assigned to Pseudomonas) inhibited the growth of colonial M. aeruginosa. Two strains of Sphingomonas associated with cyanobacterial bloom and Pseudomonas A8 isolated from M. aeruginosa colonies have been found to inhibit the growth of unicellular Microcystis (Berg et al. Citation2009; Shi, Cai, Li, et al. Citation2009). It is assumed that the production of bioactive compounds possessing growth-inhibiting activities might result in the inhibition of the cyanobacterial growth (Salomon et al. Citation2003). It was possible that the bacterial isolate QW04 may inhibit the growth of M. aeruginosa and increase the cyanobacterial colony size through producing bioactive compounds possessing growth-inhibiting and EPS excretion-stimulating activities.
5. Conclusions
Eleven bacterial strains were isolated from M. aeruginosa colonies harvested from Lake Taihu in this study. Among these bacteria, four bacterial isolates significantly influenced the growth rate of colonial M. aeruginosa, and seven bacterial isolates significantly influenced the colony size of M. aeruginosa. These data suggested that the bacteria attached to Microcystis colonies might influence the cyanobacterial colony size and growth, and in turn influence the formation and development of Microcystis blooms. In addition, three isolates (QW02, QW04 and QW17) significantly decreased the cyanobacterial growth rate, indicating that they might have the potential to control Microcystis growth in fresh water. To our knowledge, it is the first time to demonstrate that the bacteria attached to the colonies of Microcystis were able to influence the growth of colonial Microcystis and its colony size.
Funding
This study was supported by the National Natural Science Foundation of China (No. 31270447).
Disclosure statement
No potential conflict of interest was reported by the authors.
Additional information
Notes on contributors
Qiang Wu
Qiang Wu is a PhD student at School of Life Sciences, Nanjing University.
Xiaohong Zhang
Xiaohong Zhang is a master student at School of Life Sciences, Nanjing University.
Shujie Jia
Shujie Jia is a master student at School of Life Sciences, Nanjing University.
Jing Li
Jing Li is a PhD student at School of Life Sciences, Nanjing University.
Pengfu Li
Pengfu Li is an associate professor at School of Life Sciences, Nanjing University.
References
- Berg KA, Lyra C, Sivonen K, Paulin L, Suomalainen S, Tuomi P, Rapala J. 2009. High diversity of cultivable heterotrophic bacteria in association with cyanobacterial water blooms. ISME J. 3(3):314–325.
- Brunberg AK. 1999. Contribution of bacteria in the mucilage of Microcystis spp. (Cyanobacteria) to benthic and pelagic bacterial production in a hypereutrophic lake. FEMS Microbiol Ecol. 29(1):13–22.
- Cai H, Jiang H, Krumholz LR, Yang Z. 2014. Bacterial community composition of size-fractioned aggregates within the phycosphere of cyanobacterial blooms in a eutrophic freshwater lake. PLoS One. 9(8):e102879.
- Dziallas C, Grossart HP. 2011. Temperature and biotic factors influence bacterial communities associated with the cyanobacterium Microcystis sp. Environ Microbiol. 13(6):1632–1641.
- Fulton RS, Paerl HW. 1987. Effects of colonial morphology on zooplankton utilization of algal resources during blue-green algal (Microcystis aeruginosa) blooms. Limnol Oceanogr. 32(3):634–644.
- Han BP, Lin X, Lei LM, Gu JG. 2012. Survivals of D. galeata in sub-tropical reservoirs: harmful effects of toxic cyanobacteria in food source. Ecotoxicology. 21(6):1692–1705.
- Jiang LJ, Yang LY, Xiao L, Shi XL, Gao G, Qin BQ. 2007. Quantitative studies on phosphorus transference occuring between Microcystis aeruginosa and its attached bacterium (Pseudomonas sp.). Hydrobiologia. 581(1):161–165.
- Kodama M, Doucette GJ, Green DH. 2006. Relationships between bacteria and harmful algae. In: Granéli E, Turner JT, editors. Ecology of harmful algae. Berlin: Springer; p. 243–255.
- Li M, Zhu W, Gao L, Huang JY, Li L. 2013. Seasonal variations of morphospecies composition and colony size of Microcystis in a shallow hypertrophic lake (Lake Taihu, China). Fresenius Environ Bull. 22(12):3474–3483.
- Li ZK, Dai GZ, Juneau P, Qiu BS. 2016. Capsular polysaccharides facilitate enhanced iron acquisition by the colonial cyanobacterium Microcystis sp. isolated from a freshwater lake. J Phycol. 52(1):105–115.
- Liba CM, Ferrara FIS, Manfio GP, Fantinatti-Garboggini F, Albuquerque RC, Pavan C, Ramos PL, Moreira-Filho CA, Barbosa HR. 2006. Nitrogen-fixing chemo-organotrophic bacteria isolated from cyanobacteria-deprived lichens and their ability to solubilize phosphate and to release amino acids and phytohormones. J Appl Microbiol. 101(5):1076–1086.
- Liu JQ, Lewitus AJ, Brown P, Wilde SB. 2008. Growth-promoting effects of a bacterium on raphidophytes and other phytoplankton. Harmful Algae. 7(1):1–10.
- Luo JF, Wang Y, Tang SS, Liang JW, Lin WT, Luo LX. 2013. Isolation and identification of algicidal compound from Streptomyces and algicidal mechanism to Microcystis aeruginosa. Plos One. 8(10):e76444.
- MacDonald LC, Weiler EB, Berger BW. 2016. Engineering broad-spectrum digestion of polyuronides from an exolytic polysaccharide lyase. Biotechnol Biofuels. 9:43.
- Maruyama T, Kato K, Yokoyama A, Tanaka T, Hiraishi A, Park HD. 2003. Dynamics of microcystin-degrading bacteria in mucilage of Microcystis. Microb Ecol. 46(2):279–288.
- Michon AL, Jumas-Bilak E, Imbert A, Aleyrangues L, Counil F, Chiron R, Marchandin H. 2012. Intragenomic and intraspecific heterogeneity of the 16S rRNA gene in seven bacterial species from the respiratory tract of cystic fibrosis patients assessed by PCR-Temporal Temperature Gel Electrophoresis. Pathol Biol. 60(3):e30–e35.
- Ochiai A, Itoh T, Maruyama Y, Kawamata A, Mikami B, Hashimoto W, Murata K. 2007. A novel structural fold in polysaccharide lyases: Bacillus subtilis family 11 rhamnogalacturonan lyase YesW with an eight-bladed beta-propeller . J Biol Chem. 282(51):37134–37145.
- Otsuka S, Suda S, Li RH, Matsumoto S, Watanabe MM. 2000. Morphological variability of colonies of Microcystis morphospecies in culture. J Gen Appl Microbiol. 46(1):39–50.
- Parveen B, Ravet V, Djediat C, Mary I, Quiblier C, Debroas D, Humbert JF. 2013. Bacterial communities associated with Microcystis colonies differ from free-living communities living in the same ecosystem. Environ Microbiol Rep. 5(5):716–724.
- Reasoner DJ, Geldreich EE. 1985. A new medium for the enumeration and subculture of bacteria from potable water. Appl Environ Microbiol. 49(1):1–7.
- Rippka R. 1988. Isolation and purification of cyanobacteria. Meth Enzymol. 167:3–27.
- Salomon PS, Janson S, Graneli E. 2003. Molecular identification of bacteria associated with filaments of Nodularia spumigena and their effect on the cyanobacterial growth. Harmful Algae. 2(4):261–272.
- Shen H, Niu Y, Xie P, Tao M, Yang X. 2011. Morphological and physiological changes in Microcystis aeruginosa as a result of interactions with heterotrophic bacteria. Freshw Biol. 56(6):1065–1080.
- Shi LM, Cai YF, Li PF, Yang HW, Liu ZL, Kong LD, Yu Y, Kong FX. 2009. Molecular identification of the colony-associated cultivable bacteria of the cyanobacterium Microcystis aeruginosa and their effects on algal growth. J Freshw Ecol. 24(2):211–218.
- Shi LM, Cai YF, Wang XY, Li PF, Yu Y, Kong FX. 2010. Community structure of bacteria associated with Microcystis colonies from cyanobacterial blooms. J Freshw Ecol. 25(2):193–203.
- Shi LM, Cai YF, Yang HL, Xing P, Li PF, Kong LD, Kong FX. 2009. Phylogenetic diversity and specificity of bacteria associated with Microcystis aeruginosa and other cyanobacteria. J Environ Sci (China). 21(11):1581–1590.
- Teske A, Sigalevich P, Cohen Y, Muyzer G. 1996. Molecular identification of bacteria from a coculture by denaturing gradient gel electrophoresis of 16S ribosomal DNA fragments as a tool for isolation in pure cultures. Appl Environ Microbiol. 62(11):4210–4215.
- Tillett D, Neilan BA. 2000. Xanthogenate nucleic acid isolation from cultured and environmental cyanobacteria. J Phycol. 36(1):251–258.
- Visser PM, Ibelings BW, Mur LR, Walsby AE. 2005. The ecophysiology of the harmful cyanobacterium Microcystis - features explaining its success and measures for its control. In: Huisman J, Matthijs HCP, Visser PM, editors. Harmful cyanobacteria. Netherlands: Springer; p. 109–142.
- Wang R, Tai YP, Wan X, Ruan WF, Man Y, Wang JX, Yang YF, Yang Y. 2018. Enhanced removal of Microcystis bloom and microcystin-LR using microcosm constructed wetlands with bioaugmentation of degrading bacteria. Chemosphere. 210:29–37.
- Wang WJ, Shen H, Shi PL, Chen J, Ni LY, Xie P. 2016. Experimental evidence for the role of heterotrophic bacteria in the formation of Microcystis colonies. J Appl Phycol. 28(2):1111–1123.
- Wang WJ, Zhang YL, Shen H, Xie P, Yu J. 2015. Changes in the bacterial community and extracellular compounds associated with the disaggregation of Microcystis colonies. Biochem Syst Ecol. 61:62–66.
- Wang XY, Xie MJ, Wu W, Shi LM, Luo L, Li PF. 2013. Differential sensitivity of colonial and unicellular Microcystis strains to an algicidal bacterium Pseudomonas aeruginosa. J Plankton Res. 35(5):1172–1176.
- Wang YW, Wu M, Yu J, Zhang JJ, Zhang RF, Zhang L, Chen GX. 2014. Differences in growth, pigment composition and photosynthetic rates of two phenotypes Microcystis aeruginosa strains under high and low iron conditions. Biochem Syst Ecol. 55:112–117.
- Weisburg WG, Barns SM, Pelletier DA, Lane DJ. 1991. 16S Ribosomal DNA Amplification for Phylogenetic Study. J Bacteriol. 173(2):697–703.
- Wu XD, Kong FX. 2009. Effects of light and wind speed on the vertical distribution of Microcystis aeruginosa colonies of different sizes during a summer bloom. Internat Rev Hydrobiol. 94(3):258–266.
- Wu ZX, Song LR. 2008. Physiological comparison between colonial and unicellular forms of Microcystis aeruginosa Kutz. (Cyanobacteria). Phycologia. 47(1):98–104.
- Xie ML, Ren ML, Yang C, Yi HS, Li Z, Li T, Zhao JD. 2016. Metagenomic analysis reveals symbiotic relationship among bacteria in Microcystis-dominated community. Front Microbiol. 7:56.
- Yang HL, Cai YF, Xia M, Wang XY, Shi LM, Li PF, Kong FX. 2011. Role of cell hydrophobicity on colony formation in Microcystis (cyanobacteria). Int Rev Hydrobiol. 96(2):141–148.
- Yu GL, Song LR, Li RH. 2007. Taxonomic notes on water bloom forming Microcystis species (Cyanophyta) from China-An example from samples of the Dianchi Lake. Acta Phytotaxon Sin. 45(5):727–741.
- Zhang M, Kong FX, Tan X, Yang Z, Cao HS, Xing P. 2007. Biochemical, morphological, and genetic variations in Microcystis aeruginosa due to colony disaggregation. World J Microbiol Biotechnol. 23(5):663–670.
- Zhao GY, Du JJ, Jia Y, Lv YN, Han GM, Tian XJ. 2012. The importance of bacteria in promoting algal growth in eutrophic lakes with limited available phosphorus. Ecol Eng. 42:107–111.
- Zheng XH, Xia L, Ren J, Yang LY. 2008. The effect of a Microcystis aeruginosa bloom on the bacterioplankton community composition of Lake Xuanwa. J Freshw Ecol. 23(2):297–304.
- Zhu W, Li M, Luo Y, Dai X, Guo L, Xiao M, Huang J, Tan X. 2014. Vertical distribution of Microcystis colony size in Lake Taihu: its role in algal blooms. J Great Lakes Res. 40(4):949–955.