
Abstract
Freshwater resources are under stress because of anthropogenic activities and the demand for water increasing on a global scale, including hydropower. There are presently plans to expand the use of hydropower within eastern and southern Africa. A key river system identified as a potential source of energy is the Pungwe River, with the proposed Pavua Dam located within the middle reaches of the system in Mozambique. However, impoundments have been recorded to negatively influence ichthyofauna communities via alterations to water quality and discharge. Furthermore, information on the structure of the ichthyofauna community, community spatial shifts and fine-scale habitat preferences for the region are lacking. Accordingly, the research sought to address this issue, to provide baseline data as well as inform on management of the system. Ichthyofauna were collected utilising an array of passive and active techniques and species data modelled to fit spatial factors to ascertain spatial shifts. To ascertain fine-scale habitat preferences, fourth-corner modelling was undertaken to link mouth position and body shape traits to substrate composition and cover features. Spatial heterogeneity in environmental characteristics caused by the intrusion of the African Rift Valley had driven significant spatial shifts in the ichthyofauna community, with distinct groups of species occurring within the sample sites. The findings of the study indicated that the ichthyofauna community within the Muazi River were significantly different to the Pungwe River and the community will be lost from the region because of the dam footprint. Furthermore, habitat preferences were influenced by mouth position and body shape. Consequently, alteration to environmental characteristics and habitat features is likely to negatively influence the ichthyofauna community.
Introduction
To address the global need of water and energy demands, river systems are often impounded (McDonald et al. Citation2009; Vörösmarty et al. Citation2010). Presently, there are expansion plans for the development of hydropower impoundments/dams within eastern and southern Africa (McDonald et al. Citation2009; Conway et al. Citation2017). However, the construction of dams has caused river ecosystems to be radically transformed via alterations to water quality, hydrology and habitat characteristics (Kondolf Citation1997; Lessard and Hayes Citation2003; Malherbe et al. Citation2016; Ngor et al. Citation2018; Zhang et al. Citation2018). The dependence of the various biological aspects of ichthyofauna communities on the aforementioned ecosystem characteristics denote that they are particularly vulnerable to anthropogenic alterations (Skelton et al. Citation1995; Peacock et al. Citation2016; Akbaripasand and Closs Citation2018; Baggio et al. Citation2018; Ngor et al. Citation2018; Ramesh et al. Citation2018). Furthermore, the physical presence of dams negatively influences ichthyofauna species as they fragment habitat and are a barrier to migratory species (Lucas and Baras Citation2002; Rolls Citation2011; Hoeinghaus Citation2018).
The hydraulic characteristics and dynamics of a system facilitate instream abiotic and riparian characteristics (Buffington and Montgomery Citation1999; Kemp et al. Citation2000; Vesipa et al. Citation2017), and therefore, any alterations to the hydraulics of the system are likely to alter fine-scale habitat features. This negatively impacts on ichthyofauna species distributions and species assemblages (Grossman and Freeman Citation1987; Poff and Allan Citation1995; Bunn and Arthington Citation2002; Papadaki et al. Citation2016; Lee et al. Citation2017). Accordingly, information regarding species fine-scale habitat preferences is pertinent to sustainably manage a given system’s ichthyofauna population.
The Pungwe River basin traverses Mozambique and Zimbabwe, with the former generating 65–70% of the runoff and the latter generating 30–35% of the total runoff (Beilfuss et al. Citation2007). Surface water is the principal water resource within the Pungwe Basin with increasing demands for inter-basin transfers, municipal water supply, hydropower, flood mitigation, irrigated agriculture schemes among others (Beilfuss et al. Citation2007). Six large dam sites have been identified on the mainstem Pungwe with an additional 38 small to medium dams in tributaries in the catchment. The proposed location of the Pavua Dam is within this region of the Pungwe Basin. Moreover, forest degradation and deforestation associated with charcoal production are widespread and prominent in Mozambique (Sedano et al. Citation2016; Zorrilla-Miras et al. Citation2018) and were observed within the local catchment (MD pers. obs.). Based on observations of global trends, these anthropogenic activities could possibly alter the well-being of the Pungwe system. However, information on the ichthyofauna community within the middle reaches of the Pungwe River is lacking. Our aim was to ascertain the structure of the present ichthyofauna community and investigate the relationships between the ichthyofauna assemblage structure and the fine-scale habitat features within the middle region of the Pungwe River.
We hypothesised that the intrusion of the southern edge of the African Rift Valley causes geomorphic disparity upstream and downstream of its boundary. We predicted that this spatial heterogeneity causes a spatial shift in the structure of the ichthyofauna community. Considering the variation in fine-scale habitat features associated with the geomorphic transition, it was hypothesised species body shape and mouth position traits will link to habitat partitioning. Generally, species mouth position correlates to functional feeding guilds and therefore we predicted a spatial shift in the structure of the functional feeding guild community.
Methods
Study area
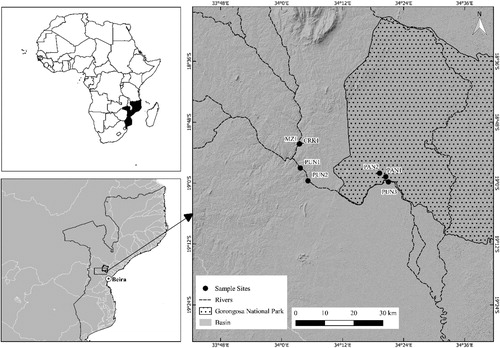
The Pungwe River is approximately 354 km in length and drains an area of 31,151 km2 (Beilfuss et al. Citation2007). The river system originates in the eastern highlands of Zimbabwe at 1318 m above sea level. The system flows east with an average slope of 0.6% with the mouth located at the city of Beira. Seven sites were sampled during 2017 and locations were based on the potential to be influenced by the proposed Pavua Dam as well as accessibility (). One site was located on the Muazi River (MZ1), one on an unnamed ephemeral tributary (CRK1) that drains into the Muazi River, three on the Pungwe mainstem (PUN1, PUN2 and PUN3) and two floodplain water bodies within the Gorongosa National Park (GNP) that are seasonally sustained by the Pungwe River (PAN1 and PAN2) (). Connectivity of these water bodies with the Pungwe River occurs during peak floods that inundates the DingeDinge marshes at the confluence of the Pungwe and Urema systems as well as surface water flow through the Nhanvu system (Beilfuss et al. Citation2007). The system has a marked change in geomorphology at PUN2 owing to the southern tip of the African Rift Valley traversing the region.
Figure 1. Map illustrating the study area and location of sample sites to ascertain the ichthyofauna assemblage structure and habitat preferences within the Pungwe system, Mozambique.
Ichthyofauna and habitat features
We sampled sites during the high-flow and low-flow seasons, apart from sites located within Gorongosa National Park because of logistical and time constraints. In addition, surface water was only present during the high-flow season at CRK1, thereby preventing sampling during the low-flow season. Ichthyofauna were collected utilising an array of passive and active techniques, depend on the flow and habitat conditions present at each site. Ichthyofauna were actively collected using a 35 m × 1.7 m × 12 mm mesh seine net with a 2 m bag, a 6 m × 1 m × 8 mm mesh seine net with a 1 m bag, a Halltech (Canada) HT-2000 backpack electrofisher and a nylon cast net with a 2.4 m diameter. Passive sampling involved deploying fyke nets (2 m traps × 700 mm opening with 1 × 6 m wing and a 23 mm mesh), gill nets (45 mm and 93 mm) each 25 m in length with weighted and floated segments, hexagonal umbrella minnow traps and angling. A summary of the effort of the techniques utilised per site is provided in .
Table 1. Summary of sampling effort per technique utilised for each site during the sampling seasons in the present study.
Sites were traversed and visually stratified into hydraulic biotopes based on the definitions provided by Kleynhans et al. (Citation2005) and Wadeson and Rowntree (Citation2005). Each hydraulic biotope was sampled using the appropriate sampling technique and, where possible, identified to species level using Skelton (Citation2001) and abundance of each species recorded.
We recorded several habitat features at each sampling unit. Three random replicates of depth and velocity were measured using a propeller velocity meter. The substrate composition as a percentage contribution of each substrate type was recorded by visual observation and physical contact. The classification of substrate types was based on modifications of the grade definitions provided by Wentworth (Citation1922). The seven substrate types considered in the study were bedrock, boulder, cobble, gravel, sand, silt and mud. In addition, cover features were assigned an ascending rank from 1 – five based on their suitability in providing cover. A rank of one indicated very poor suitability and five indicated high suitability. If a cover feature was absent from the biotope, it was assigned a zero. Eight cover features were considered in the study and consist of water column depth, substrate, aquatic vegetation, marginal vegetation, overhanging vegetation, roots, woody debris and rocky crevice.
Statistical analyses
All statistical analyses were performed using R version 3.5. Initially, a permutational ANOVA (PERMANOVA) test using 999 free permutations as a control was conducted on a Euclidean distance matrix of substrate proportion and cover feature ranks to ascertain the biotopes sampled differed significantly upstream and downstream of the Rift Valley intrusion at PUN2. The substrate proportion and cover feature rank data were normalised prior to analyses. The vegan package (Oksanen et al. Citation2018) was used to perform the statistical test and chart a non-metric multidimensional scaling (NMDS) ordination plot to visualise the grouping of biotopes sampled upstream and downstream.
A generalised linear model (GLM) approach was used to determine the presence of significant spatial shifts of the ichthyofauna community, based on counts, using site, location upstream or downstream of the Rift Valley and the site–location interaction as independent factors. The R-package mvabund was used to conduct the analysis (Wang et al. Citation2012). Due to the use of count data, a GLM with a log-link function was utilised with a negative binomial distribution because of overdispersion. The log10 of sampling effort was used as cofactor in the model because of inter- and intra-site effort disparity. An analysis of deviation using the likelihood ratio test (LRT) was conducted using 999 iterations via PIT-TRAP resampling. Univariate p-values were adjusted for multiple testing, using a step-down resampling procedure. In order to visualise results, principal coordinate analysis (PCoA) ordinations were plotted using the vegan package (Oksanen et al. Citation2018) and were derived from Hellinger-transformed catch per unit effort data.
The spatial shift in the ichthyofauna feeding guild community structure was ascertained using congruent analyses. The allocated feeding guilds comprised of detritivore (DV), benthic herbivore (HV-B), opportunistic predator (OP), omnivore (OV), piscivore (PV), zoobenthivore (ZB) and zooplanktivore (ZP). In this analysis, counts of the feeding guilds were used. Moreover, the hydraulic biotope sampled was an additional independent factor to verify if hydraulic biotope is a driver component of ichthyofauna feeding guilds. Feeding guild information was obtained from literature and online sources (Skelton Citation2001; Froese and Pauly Citation2018).
A ‘fourth-corner’ analysis based on a GLM with a negative binomial distribution was used to identify the fine-scale environmental drivers, namely substrate and cover features, that affected the ichthyofauna community based on the body shape and mouth position. Generally, fish body shape and mouth position correlate to fine-scale habitat residence and feeding behaviour. Therefore, the analysis was considered as the loss in habitat structure is expected because of the dam and accordingly will provide an indication of what species are likely to be affected. To achieve this, abundance data were fitted to the aforementioned biotope physiognomies using the traitglm function in the mvabund package (Wang et al. Citation2012). A least absolute shrinkage and selection operator (LASSO) penalty, estimated by cross-validation, was used for model selection. This method provides high predictive performance in species distribution models and facilitates interpretation by automatically setting to zero any terms in the model that do not explain any variation in the species response (Wang et al. Citation2012). P-values were calculated using 1000 resampling iterations by PIT-trap block resampling to account for correlation in testing.
Results
Site-habitat spatial variability
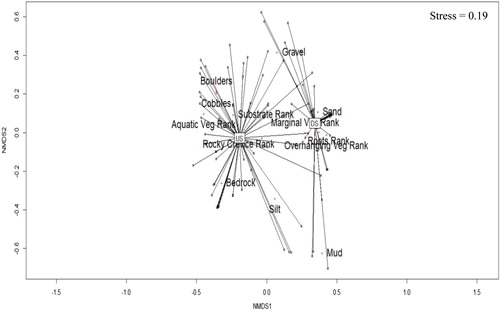
There was a significant difference between the hydraulic biotopes sampled upstream and downstream of the boundary at PUN2 (PERMANOVA, F = 25.76, p < .001) based on the substrate composition and cover features. Biotopes were congregated into upstream and downstream groups with overlap (). Consolidated substrates such as bedrock, boulders and cobbles were correlated with upstream sites, while downstream sites were associated with finer and relatively more mobile substrates, such as mud and sand. There was overlap with upstream and downstream biotopes that possessed a gravel substrate. In addition, cover features varied spatially (). Aquatic vegetation and rocky crevices were associated with upstream sites, whereas tree roots, marginal vegetation and overhanging vegetation were more correlated with downstream sites ().
Figure 2. Non-metric multidimensional scaling (NMDS) plot illustrating hydraulic biotope groupings and dispersion in the present study. Upstream and downstream labels overlay the average weighted centroid. US: upstream; DS: downstream of the African Rift Valley.
The study area exhibited spatial variation in the velocity and depth of the hydraulic biotopes sampled (). Sites CRK1 and PUN3 possessed the lowest and highest mean depth, based on median values, with an interquartile range from 15 to 40 cm and 72 to 151 cm, respectively (). However, PUN2 possessed the deepest biotopes with a depth of approximately 516 cm (). Median depth values were not considerably different between sites upstream and downstream of the Rift Valley boundary, with median depth values of 42 and 47.5 cm, respectively (). The interquartile range was greater for downstream sites, albeit the median value was proximal to the 25th percentile ().
Figure 3. Box and whisker plots illustrating the variation in mean depth and mean velocity on a spatial scale in the present study. Sites as per abbreviations in text and ; US: upstream; DS: downstream of the African Rift Valley. Box represents the interquartile, the horizontal line within the box represents the median value and vertical lines indicate extreme values. Open circles represent outliers.
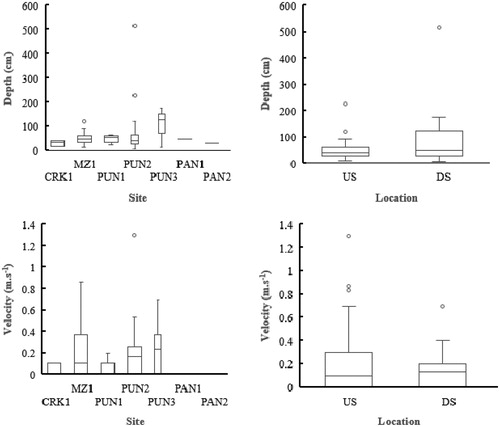
Biotopes at CRK1 and PUN1 possessed lower mean velocities compared with other lotic sites (). The highest recorded median mean velocity was at PUN3 at 0.2 m.s−1, although MZ1 possessed biotopes with higher velocities with the upper quartile at approximately 0.8 m.s−1 (), the median value at MZ1 was towards the lower quartile at 0.1 m.s−1 (). The highest recorded velocity was at PUN2 at 1.3 m.s−1 (). Overall, biotopes upstream of the Rift Valley possessed higher mean velocities than biotopes downstream. Nevertheless, the median mean values of upstream and downstream biotopes were not considerably dissimilar at 0.1 m.s−1 and 0.13 m.s−1, respectively ().
Ichthyofauna community spatial shifts
A total of 4704 individuals of 35 fish species representing 12 families were recorded within the study area during the study period (). The most speciose family was the Cyprinidae that had nine species within the study area, followed by the family Mormyridae that had four species present (). The most abundant species was Chiloglanis spp. The species was termed Chiloglanis spp. as, although it was similar to C. pretoriae, the population in the Pungwe system is likely a new species (R. Bills, pers. comm., 21 April 2017). Several species were recorded as single specimens within the study area and this list comprised of Zaireichthys monomotapa, Distichodus schenga, Malapterurus shirensis, Microphis fluviatilis and Mormyrus longirostris. These species were typically the only member of their respective family within the study area with the exception of M. longirostris ().
Table 2. Summary of fish species recorded within the study area and the respective feeding guild and physical traits.
Site and location were significant (p < .05) drivers of the ichthyofauna communities within the study area, denoting significant spatial shifts in the ichthyofauna communities although the interaction of site and location was not significant (). The deviation values of site and location were 449.2 and 80.9, respectively (). Grouping and dispersion of biotopes sampled on a site and location basis are shown in . Sample sites CRK1 and MZ1 as well as PAN1 and PAN2 overlapped in these (). MZ1 overlapped to some extent with PUN2 and PUN1, although the latter two sites were distinct from each other. PUN3 exhibited some overlap with PUN2, albeit that the former was distant from the remaining sites. Upstream and downstream biotopes showed minimal overlap with the average weighted centroid and 95% confidence limits distinct from each other ().
Figure 4. Principal coordinate analysis (PCoA) ordination plots of (a) biotopes sampled on a site basis and (b) location upstream or downstream of the Rift Valley boundary (B) in the present study. Sites as per abbreviations in text and ; US: upstream; DS: downstream. Plots were derived from Hellinger-transformed catch per unit effort data. Labels indicate average weighted centroid and ellipses 95% confidence limits.
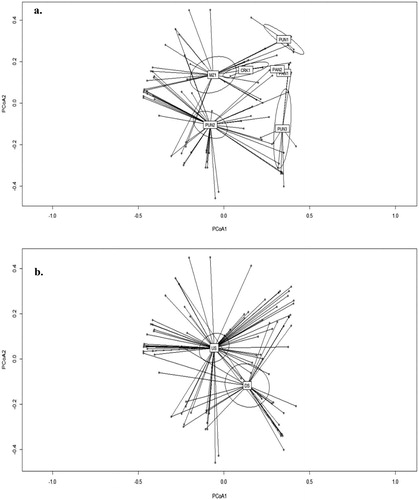
Table 3. Statistical summary of generalised linear models (GLMs) fitting ichthyofauna count data to spatial independent factors to elucidate spatial turnover of the ichthyofauna community within the study area.
Nine fish species were significantly associated with site as the independent factor with seven of the species from the family Cyprinidae (). Enteromius haasianus provided the highest deviance for the model and Labeo molybdinus the lowest, with deviance values of 31.15 and 11.48, respectively. Two species, Labeo altivelis and Synodontis zambezensis, were associated with location as the independent factor (). The latter species provided the highest deviance value at 23.99 ().
Ichthyofaunal species abundance based on catch per unit effort exhibited spatial variation within the study area, with clustering of significant species recorded (). As mentioned, Chiloglanis spp. was the most abundant species and was generally widespread throughout the study area (). The species occurred at a relatively high catch per unit effort at MZ1 but was typically absent from downstream sites (). In addition, the species was clustered with Labeo cylindricus. Enteromius haasianus was only recorded at the pans in Gorongosa National Park and clustered with E. annectens (). Brycinus imberi and L. altivelis were clustered together and although these species occurred at the highest abundance at PUN2 (), they were generally recorded downstream of the boundary (MD unpublished data; pers. obs.).
Figure 5. Heatmap illustrating standard deviation of catch per unit effort of ichthyofauna species per sample site. Scaling was undertaken on rows to permit visualisation of spatial variation per species. The colour scale indicates the number of standard deviations above or below the mean of its row. This gives a distribution centred around the midpoint of the colour scale. Row clustering is based on Euclidean distances using the average linking method. Species abbreviations are as in .
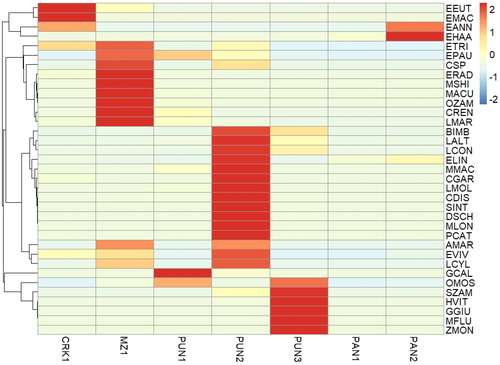
Sites CRK1 and MZ1 overlapped (), which was expected given the proximal distance of the sites. Nevertheless, the sites did display disparity because of the relative abundance of E. macrotaenia, E. annectens and E. eutaenia within CRK1. Five cyprinid species (E. trimaculatus, E. paludinosus, E. radiatus, L. marequensis and O. zambezense) and Chiloglanis spp. occurred at MZ1 in their highest relative abundance, whereas four cyprinid species (L. altivelis, L. congoro, L. molybdinus and E. lineomaculatus) and all four mormyrid species occurred at their highest relative abundances at PUN2 (). PUN3 possessed the highest catch per unit effort of H. vittatus, O. mossambicus and S. zambezense. Enteromius haasianus was limited to PAN1 and PAN2 (). Feeding guild structure was significantly (p < .05) associated with site and hydraulic biotope independent factors (). The deviance values for site and hydraulic biotope were 116.85 and 122.71, respectively (). However, location and the interactions of the independent factors did not significantly (p > .05) influence ichthyofauna feeding guild communities. Benthic herbivore, opportunistic predator and omnivore feeding guilds were significantly (p < .05) associated with site, whereas benthic herbivore, omnivore, zoobenthivore and zooplanktivore feeding guilds were significantly (p < .05) associated with hydraulic biotopes ().
Table 4. Statistical summary of generalised linear models (GLMs) fitting feeding guild count data to spatial and hydraulic biotope independent factors to elucidate spatial turnover of the feeding guild community within the study area.
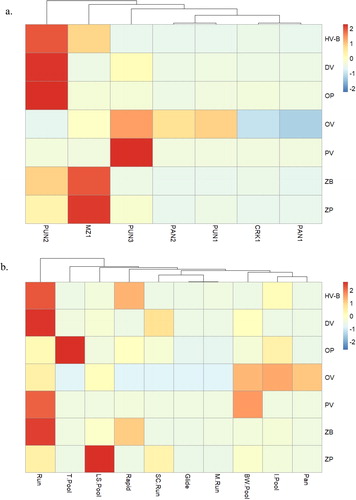
summarises the CPUE of different feeding guilds as follows. The highest catch per unit effort of fish benthic herbivore and opportunistic predator species was recorded at site PUN2. In addition, the site was not clustered with other sites and possessed the highest catch per unit effort of detritivore species. The omnivore feeding guild was generally widespread throughout the study area with peak catch per unit effort recorded at PUN3. Within a hydraulic biotope context, the highest benthic herbivore guild catch per unit effort was recorded in rapids and runs. Omnivorous species were recorded at higher relative abundances in backwater pools, isolated pools and pans. The zoobenthivore guild exhibited a preference for runs and rapids, whereas in contrast, the zooplanktivore guild exhibited a preference for lateral-scour pools.
Figure 6. Heatmaps illustrating (a) the standard deviation of catch per unit effort data of each feeding guild per site and (b) per hydraulic biotope in the present study. Scaling was undertaken on rows to permit visualisation of temporospatial variation per individual guild. The colour scale indicates the number of standard deviations above or below the mean of its row. This gives a distribution centred around the midpoint of the colour scale. BW Pool: backwater pool; I Pool: isolated pool; LS Pool: lateral-scour pool; M Run: marginal run; SC Run: side-channel run. Feeding guild abbreviations are as follows: detritivore (DV), benthic herbivore (HV-B), opportunistic predator (OP), omnivore (OV), piscivore (PV), zoo-benthivore (ZB) and zoo-planktivore (ZP).
Fine-scale habitat partitioning
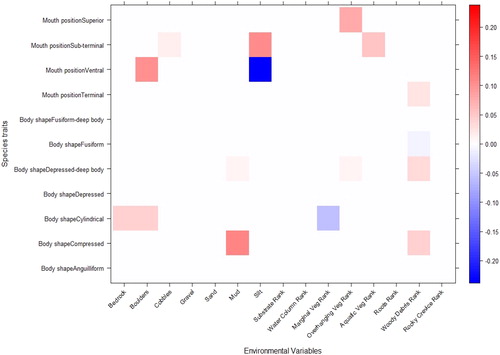
Trait modelling using ‘fourth-corner’ analysis indicated that fish body shape and mouth shape were significantly correlated to fine-scale habitat features within the study area (). Within the study area, substrate types that were significant in accounting for trait-based habitat partitioning comprised bedrock, boulders, cobbles, mud and silt. Significant cover features consisted of aquatic, marginal and overhanging and woody debris. Relationships with relatively higher strengths included the positive link between fish species possessing superior mouths and the rank of overhanging vegetation and the positive link between fish species possessing subterminal mouths and silt and aquatic vegetation. Moreover, there was a strong positive association of fish species with ventral mouths with boulders and the contrariwise negative association with silt. Significant relationships between habitat features and body shape were also recorded within the study area (). These included the positive relation of cylindrical fish species with bedrock and boulders and the negative relation to marginal vegetation and the fish species with compressed body shapes positive association with mud and woody debris.
Figure 7. Standardised coefficients (β) of ‘fourth-corner’ analysis for significant environment-guild interaction terms, derived from GLM analysis with a LASSO penalty in the present study. Positive coefficients are red and negative coefficients are blue. The intensity of the colours represents the strength of the relationship. White indicates no correlation.
Discussion
Results obtained from the study show the intrusion of the African Rift Valley as the major geological feature affecting fine-scale habitat features. The Rift Valley influences the channel profile and thalweg features, thereby influencing hydraulics (Newson and Newson Citation2000; Hirschowitz et al. Citation2007), and consequently, influences habitat features (Gilman Citation1993; Kemp et al. Citation2000). The transition of the consolidated or coarse-substrate dominance to non-consolidated substrate dominance from the upper to lower sites was likely because of the lower velocities downstream of the boundary at PUN2 (Rubey Citation1933). Furthermore, the disparity in cover features between sites and biotopes located upstream and downstream of the Rift Valley boundary was possibly because of the hydraulic dynamics and geological characteristics of the region (Kemp et al. Citation2000; Newson and Newson Citation2000; Wang et al. Citation2015). Aquatic vegetation at the upper site comprised exclusively of Hydrostachys polymorpha (MD pers. obs.), a perennial haptophyte that adheres to hardened substrates. This species was the only cover feature recorded at MZ1. The geomorphology of the upper sites dictated the substrate itself was a cover feature as well as numerous rocky crevices. The association of suitable woody debris and overhanging vegetation to serving as cover features within the lower reaches was attributed to the riparian vegetation found there.
There was a significant spatial shift in the ichthyofauna communities from the upper to lower sites and was characterised by a dominance of the overall ichthyofauna community by cyprinids. This was expected as the family is the most ubiquitous in Africa and especially within southern Africa (Skelton Citation1988; Skelton Citation2001). The families Mochokidae and Mormyridae are also widespread throughout Africa (Skelton Citation1988) and their prevalence within the study area was expected. There was a distinct shift in the fish community from the Muazi River to the mainstem Pungwe. The distinct community present at site MZ1 was likely because of the unique habitat structure created by the H. polymorpha at the site. In addition, depth has been demonstrated to influence community composition (Gelwick et al. Citation1997; Hitt and Angermeier Citation2006; Fonseca et al. Citation2014; Pokharel et al. Citation2018) and was a possible influence in the spatial shift. There was also a shift in the ichthyofauna communities from upstream to downstream of the Rift Valley boundary shown by the change in habitat characteristics. The pan sites are regarded as unique in the study area because of the presence of fish species not recorded within the mainstem Pungwe. Nevertheless, connectivity is important to allow for movement of fish species recorded in the mainstem, such as C. gariepinus, E. annectens and O. mossambicus, to and from these pans.
Within the middle–lower Pungwe system, specific feeding guilds were significantly associated with sites and hydraulic biotopes. Benthic herbivores were recorded in their highest catch per unit effort at PUN2 because of consolidated substrate dominance of the biotopes sampled, which typically possess a higher biomass of algae than mobile substrates (Tett et al. Citation1978). Conversely, benthic herbivores were not recorded at PUN1 and the downstream sites, because of the absence of suitable habitat for optimal microalgal growth. PUN2 also possessed the highest catch per unit effort of opportunistic predators and omnivorous species and may be as a result of the combination of consolidated substrates that provide suitable habitat for lower trophic benthic organisms and microalgae (Tett et al. Citation1978; Erman and Erman Citation1984; Quinn and Hickey Citation1990), as well as the abundance of fish species present at site.
Benthic herbivores and zoobenthivores were relatively abundant in runs and rapids. Typically, these biotopes were characterised by relatively high velocities with hard substrates, thereby providing optimal conditions for microalgal growth and benthic macro-invertebrates (Tett et al. Citation1978; Erman and Erman Citation1984; Quinn and Hickey Citation1990). Consequently, these biotopes provided optimal habitat for the aforementioned feeding guilds. Zooplanktivore species demonstrated a preference for lateral-scour pools. Zooplankton in lotic systems prefer slower velocity (Thorp et al. Citation1994; De Paggi and Paggi Citation2007), a feature associated with lateral-scour pools and therefore, provided suitable feeding habitat for this guild.
Species’ mouth position and body shape were significantly correlated with substrate and cover features denoting that feeding behaviour and the capability to fit into cover features dictate species habitat preferences. Overhanging vegetation provides habitat for terrestrial invertebrates or adults of species with aquatic larvae and plays an important role in providing this external food source to species (Allan et al. Citation2003; Baxter et al. Citation2005; de Oliveira-Junior et al. Citation2017). Therefore, species with superior mouths display a preference for overhanging vegetation because of the potential for fluxes of terrestrial invertebrates into the system. Species with ventral mouth positions were positively related to boulders and negatively related to silt, likely because of the relative abundance of lower trophic organisms associated with these substrates (Tett et al. Citation1978; Erman and Erman Citation1984; Quinn and Hickey Citation1990; Kemp et al. Citation2011). Nevertheless, fine sediments do harbour benthic communities that provide energy to higher trophic organisms including ichthyofauna (Kemp et al. Citation2011). The reason for the positive correlation between compressed species and silt is unclear. However, body shape is an indicator of a species swimming ability (Oikonomou et al. Citation2018). Silt typically dominates slow-velocity hydraulic biotopes, and species with compressed body shapes prefer biotopes with slower velocities because of the poorer swimming ability dictated by the body shape. Compressed and cylindrical body-shaped species were positively linked to woody debris and bedrock and boulders, respectively, likely because species being adapted to fit into gaps created by the cover features.
Conclusions
The intensifying demands for energy within Africa have increased the demand for hydropower within the continent (Conway et al. Citation2017). However, there is evidence that dams alter ichthyofauna communities (Ngor et al. Citation2018; Zhang et al. Citation2018). One of the key requirements to mitigate the influence of dams is understanding habitat use for flow management. The proposed Pavua Dam within the middle reaches of the Pungwe River is likely to alter the hydrology of the system, thereby influencing habitat physiognomies. However, information of the ichthyofauna community within the region is lacking and without the relevant data, there is the possibility of mismanaged flows, leading to negative impacts to the ichthyofauna community which could have been avoided. Therefore, the study sought to evaluate the spatial heterogeneity and fine-scale habitat preferences of the ichthyofauna communities within the middle to lower reaches of the Pungwe River. We demonstrated that there was a spatial shift in the communities with distinct groupings based on environmental characteristics that are driven by the intrusion of the African Rift Valley within the study area. Fine-scale habitat preferences within the study area, in the form of substrate and cover features, were based on species feeding ecology, which were based on both mouth position and body shape. Fish feeding guilds were significantly associated with discrete hydraulic biotopes denoting that alterations to the hydraulic characteristics will lead to declines and/or loss of these species. Furthermore, the geomorphic variability within the study area is a significant regional driver of fish community structure and species richness. The transformation arising from sedimentation because of exacerbated erosion from deforestation will negatively impact the community structure. It is hoped that the information within this study will form part of the evidence to make informed management decisions of this system and its catchment.
Notes on contributors
Dr Mahomed Desai, Dr Gordon O’Brien, Andrew Husted and Christian Fry are biologists with a special interest in freshwater ecosystems. Prof. Colleen T. Downs is a terrestrial vertebrate biologist and holds the NRF SARChI Research Chair in Ecosystem health and biodiversity in KwaZulu-Natal and the E. Cape at the University of KwaZulu-Natal, Pietermaritzburg campus.
Acknowledgements
The authors are grateful to the relevant Mozambique governmental bodies and to Gorongosa National Park for enabling the research to be undertaken. The efforts of those individuals who aided the researchers in undertaking fieldwork are gratefully appreciated. CTD and MD are grateful to the University of KwaZulu-Natal and the the National Research Foundation (ZA) for funding.
Disclosure statement
No potential conflict of interest was reported by the authors.
Data availability statement
Data are available on request.
Additional information
Funding
References
- Akbaripasand A, Closs GP. 2018. Effects of food supply and stream physical characteristics on habitat use of a stream-dwelling fish. Ecol Freshw Fish. 27(1):270–279.
- Allan JD, Wipfli MS, Caouette JP, Prussian A, Rodgers J. 2003. Influence of streamside vegetation on inputs of terrestrial invertebrates to salmonid food webs. Can J Fish Aquat Sci. 60(3):309–320.
- Baggio RA, Araujo SBL, Ayllón D, Boeger WA. 2018. Dams cause genetic homogenization in populations of fish that present homing behavior: evidence from a demogenetic individual-based model. Ecol Model. 384:209–220.
- Baxter CV, Fausch KD, Saunders WC. 2005. Tangled webs: reciprocal flows of invertebrate prey link streams and riparian zones. Freshw Biol. 50(2):201–220.
- Beilfuss R, Steinbruch F, Owen R. 2007. Long-term plan for hydrological research: adaptive management of water resources at Gorongosa National Park. Report prepared for Gorongosa Research Centre, Gorongosa National Park, Mozambique.
- Buffington JM, Montgomery DR. 1999. Effects of hydraulic roughness on surface textures of gravel-bed rivers. Water Resour Res. 35(11):3507–3521.
- Bunn SE, Arthington AH. 2002. Basic principles and ecological consequences of altered flow regimes for aquatic biodiversity. Environ Manage. 30(4):492–507.
- Conway D, Dalin C, Landman WA, Osborn TJ. 2017. Hydropower plans in eastern and southern Africa increase risk of concurrent climate-related electricity supply disruption. Nat Energy. 2(12):946–953.
- de Oliveira-Junior JMB, De Marco P, Dias-Silva K, Leitão RP, Leal CG, Pompeu PS, Gardner TA, Hughes RM, Juen L. 2017. Effects of human disturbance and riparian conditions on Odonata (Insecta) assemblages in eastern Amazon basin streams. Limnologica. 66:31–39.
- De Paggi S, Paggi J. 2007. Zooplankton in the Middle Parana River. In: Iriondo M, Paggi J, Parma M, editors. The Middle Paraná River: limnology of a subtropical wetland. New York: Springer Science and Business Media.
- Erman DC, Erman NA. 1984. The response of stream macroinvertebrates to substrate size and heterogeneity. Hydrobiologia. 108(1):75–82.
- Fonseca VF, Vasconcelos RP, França S, Serafim A, Lopes B, Company R, Bebianno MJ, Costa MJ, Cabral HN. 2014. Modeling fish biological responses to contaminants and natural variability in estuaries. Mar Environ Res. 96:45–55.
- Froese R, Pauly D. 2018. FishBase [WWW Document]. World Wide Web Electron. Publ. URL; [accessed 2018 Jan 6] www.fishbase.org.
- Gelwick FP, Stock MS, Matthews WJ. 1997. Effects of fish, water depth and predation risk on patch dynamics in a north-temperate river ecosystem. Oikos. 80(2):382–398.
- Gilman K. 1993. Stream hydrology: an introduction for ecologists. In: Nancy DG, Thomas AM, Brian LF, Christopher JG, Rory JN, Editors. Ecological engineering. Chichester: John Wiley and Sons Ltd; p. 166–169.
- Grossman GD, Freeman MC. 1987. Microhabitat use in a stream fish assemblage. J Zool. 212(1):151–176.
- Hirschowitz PM, Birkhead AL, James CS. 2007. Hydraulic modelling for ecological studies for South African rivers. WRC Report, Pretoria.
- Hitt NP, Angermeier PL. 2006. Effects of adjacent streams on local fish assemblage structure in western Virginia: implications for biomonitoring. Àm Fish Soc Symp. 48:75–86.
- Hoeinghaus DJ. 2018. Dams and river fragmentation. In DA DellaSala and MI Goldstein, Editors. The Encyclopedia of the Anthropocene, Vol. 3, Biodiversity. Oxford, UK: Elsevier; p. 241–248.
- Kemp JL, Harper DM, Crosa GA. 2000. The habitat-scale ecohydraulics of rivers. Ecol Eng. 16(1):17–29.
- Kemp P, Sear D, Collins A, Naden P, Jones I. 2011. The impacts of fine sediment on riverine fish. Hydrol Process. 1821:1800–1821.
- Kleynhans C, Louw M, Thiron C, Rossouw N, Rowntree K. 2005. River ecoclassification manual for ecostatus determination (version 1). Water Research Commission, Pretoria, South Africa: Department of Water and Sanitation.
- Kondolf GM. 1997. Hungry water: effects of dams and gravel mining on river channels. Environ Manage. 21(4):533–551.
- Lee F, Simon KS, Perry GLW. 2017. Increasing agricultural land use is associated with the spread of an invasive fish (Gambusia affinis). Sci Total Environ. 586:1113–1123.
- Lessard JL, Hayes DB. 2003. Effects of elevated water temperature on fish and macroinvertebrate communities below small dams. River Res Appl. 19(7):721–732.
- Lucas MC, Baras E. 2002. Migration of freshwater fishes. Oxford: Blackwell Science.
- Malherbe W, Wepener V, van Vuren JHJ. 2016. The effect of a large-scale irrigation scheme on the fish community structure and integrity of a subtropical river system in South Africa. Ecol Indic. 69:533–539.
- McDonald K, Bosshard P, Brewer N. 2009. Exporting dams: China’s hydropower industry goes global. J Environ Manage. 90:S294–S302.
- Newson MD, Newson CL. 2000. Geomorphology, ecology and river channel habitat: mesoscale approaches to basin-scale challenges. Prog Phys Geogr. 24(2):195–217.
- Ngor PB, Legendre P, Oberdorff T, Lek S. 2018. Flow alterations by dams shaped fish assemblage dynamics in the complex Mekong-3S river system. Ecol Indic. 88:103–114.
- Oikonomou A, Leprieur F, Leonardos ID. 2018. Ecomorphological diversity of freshwater fishes as a tool for conservation priority setting: a case study from a Balkan hotspot. Environ Biol Fish. 101(7):1121–1136.
- Oksanen AJ, Blanchet FG, Friendly M, Kindt R, Legendre P, McGlinn D, Minchin PR, O’Hara RB, Simpson GL, Solymos P, et al. 2018. Package ‘Vegan’ version 2.5-2. R-documentation-CRAN Repository. 1-295
- Papadaki C, Soulis K, Muñoz-Mas R, Martinez-Capel F, Zogaris S, Ntoanidis L, Dimitriou E. 2016. Potential impacts of climate change on flow regime and fish habitat in mountain rivers of the south-western Balkans. Sci Total Environ. 540:418–428.
- Peacock MM, Gustin MS, Kirchoff VS, Robinson ML, Hekkala E, Pizzarro-Barraza C, Loux T. 2016. Native fishes in the Truckee River: are in-stream structures and patterns of population genetic structure related? Sci Total Environ. 563–564:221–236.
- Poff NL, Allan JD. 1995. Functional organization of stream fish assemblages in relation to hydrological variability. Ecology. 76(2):606–627.
- Pokharel KK, Basnet KB, Majupuria TC, Baniya CB. 2018. Correlations between fish assemblage structure and environmental variables of the Seti Gandaki River Basin, Nepal. J Freshw Ecol. 33(1):31–43.
- Quinn JM, Hickey CW. 1990. Magnitude of effects of substrate particle size, recent flooding, and catchment development on benthic invertebrates in 88 New Zealand rivers. New Zeal J Mar Freshw Res. 24(3):411–427.
- Ramesh T, Downs CT, O’Brien GC. 2018. Movement response of Orange-Vaal largemouth yellowfish (Labeobarbus kimberleyensis) to water quality and habitat features in the Vaal River, South Africa. Environ Biol Fish. 101(6):997–1009.
- Rolls RJ. 2011. The role of life-history and location of barriers to migration in the spatial distribution and conservation of fish assemblages in a coastal river system. Biol Conserv. 144(1):339–349.
- Rubey WW. 1933. Settling velocity of gravel, sand, and silt particles. Am J Sci. 25:325–338.
- Sedano F, Silva JA, Machoco R, Meque CH, Sitoe A, Ribeiro N, Anderson K, Ombe ZA, Baule SH, Tucker CJ. 2016. The impact of charcoal production on forest degradation: a case study in Tete, Mozambique. Environ Res Lett. 11(9):094020–094012.
- Skelton P. 2001. A complete guide to the freshwater fishes of Southern Africa (2nd ed.). Cape Town, South Africa: Struik Publishers.
- Skelton PH. 1988. The distribution of African freshwater fishes (Répartition Des Poissons d’eau Douce Africains). In: Lévêque C, Bruton MN, Ssentongo GW, Editors. Biologie et Écologie Des Poissons d’eau Douce Africans = Biology and Ecology of African Freshwater Fishes (Travaux et Documents de l’ORSTOM, 216). Paris: ORSTOM; p. 65–92.
- Skelton PH, Cambray JA, Lombard A, Benn GA. 1995. Patterns of distribution and conservation status of freshwater fishes in South Africa. S Afr J Zool. 30(3):71–81.
- Tett P, Gallegos C, Kelly MG, Hornberger GM, Cosby BJ. 1978. Relationships among substrate, flow, and benthic microalgal pigment density in the Mechums River, Virginia. Limnol Oceanogr. 23(4):785–797.
- Thorp JH, Black AR, Haag KH, Wehr JD. 1994. Zooplankton assemblages in the Ohio river: seasonal, tributary, and navigation dam effects. Can J Fish Aquat Sci. 51(7):1634–1643.
- Vesipa R, Camporeale C, Ridolfi L. 2017. Effect of river flow fluctuations on riparian vegetation dynamics: processes and models. Adv Water Resour. 110:29–50.
- Vörösmarty CJ, McIntyre PB, Gessner MO, Dudgeon D, Prusevich A, Green P, Glidden S, Bunn SE, Sullivan CA, Liermann CR, et al. 2010. Global threats to human water security and river biodiversity. Nature. 467(7315):555–561.
- Wadeson R, Rowntree K. 2005. Refinement of geomorphological tools for the sustainable management of South African rivers. Pretoria, South Africa: Department of Water and Sanitation.
- Wang C, Zheng SS, Wang PF, Hou J. 2015. Interactions between vegetation, water flow and sediment transport: a review. J Hydrodyn. 27(1):24–37.
- Wang Y, Naumann U, Wright ST, Warton DI. 2012. Mvabund – an R package for model-based analysis of multivariate abundance data. Methods Ecol Evol. 3(3):471–474.
- Wentworth CK. 1922. A scale of grade and class terms for clastic sediments. J Geol. 30(5):377–392.
- Zhang P, Yang Z, Cai L, Qiao Y, Chen X, Chang J. 2018. Effects of upstream and downstream dam operation on the spawning habitat suitability of Coreius guichenoti in the middle reach of the Jinsha River. Ecol Eng. 120:198–208.
- Zorrilla-Miras P, Mahamane M, Metzger MJ, Baumert S, Vollmer F, Luz AC, Woollen E, Sitoe AA, Patenaude G, Nhantumbo I, et al. 2018. Environmental conservation and social benefits of charcoal production in Mozambique. Ecol Econ. 144:100–111.