
 ?Mathematical formulae have been encoded as MathML and are displayed in this HTML version using MathJax in order to improve their display. Uncheck the box to turn MathJax off. This feature requires Javascript. Click on a formula to zoom.
Abstract
The aim of this study was to support the development of ecological stream quality assessment tools in order to provide a method for sustainable water management in Turkey. Therefore, we present two new or adapted indices based on benthic invertebrates. To develop and adapt the indices, 17 streams were studied and separated into three quality classes, which were supported by four community indices (EPT [%], EPTCBO [%], number of Individuals, evenness), and 23 taxa were identified as indicators for these three quality classes. As a first biological index, we adapted the Hindu Kush-Himalaya biotic score (HKHbios) to the Euphrates catchment by establishing a new and ecoregion-specific score list (Euph-Scores) by scoring 93 taxa depending on their distribution between the quality classes. Based on these scores, several average score per taxon values (ASPT value) were calculated. All ASPT values of the Euph-Scores separated the quality classes significantly. After a comparison of the different ASPT values we recommend to use the weighted ASPT, because the weighting enabled a sharper differentiation between the quality classes and named it Euphrates Biotic Score (EUPHbios). As a second biological index, we propose the proportion of habitat specialists. To calculate this index, a habitat score was developed by analysing the habitat preferences of several benthic invertebrates. Habitat score values were assigned to the 20 most common taxa from the streams in the best quality class (natural streams). The proportion of habitat specialists, identified using the new habitat score, differed significantly between the three quality classes, with higher values in natural streams than in polluted streams. In the light of the results, the presented methods appear to be suitable for developing a multi-metric index for assessment programs for the mountainous regions of the Middle East.
Introduction
Benthic invertebrates are the most commonly used biological indicators for assessing the ecological quality of running waters (Rosenberg and Resh Citation1993) and for estimating the intensity of anthropogenic impacts. European systems for assessing ecological quality based on benthic invertebrate composition are often multi-metric indices, where several different metrics are combined to indicate the ecological status class of a surface water (e.g. Böhmer et al. Citation2004; Hering et al. Citation2004a, Citation2004b). Although the general approach of bioindication with benthic invertebrates is the same, all national methods have been adapted to specific geographical regions and parametrised for specific aquatic fauna (e.g. Biological Monitoring Working Party-BMWP for the UK, Armitage et al. Citation1983; Belgian Biotic Index, De Pauw and Vanhooren Citation1983; PERLODES in Germany, Meier et al. Citation2004). In Turkey, a first assessment method using bioindication with benthic invertebrates, the Turkish-BMWP biotic index (TR-BMWP), was recently developed (Kazanci et al. Citation2016). However, due to limited data availability, it uses the family-level identification of benthic macroinvertebrate families for assessment and is based on the British-BMWP. Therefore, the degree of regional adaptation seems to be somewhat limited, because the original British scores were changed only slightly based on expert knowledge, again due to limited data availability. Consequently, further development of biotic indices for the assessment of ecological stream quality in Turkey is needed.
Currently, the national authorities in the Mediterranean part of Turkey use the ‘Intercalibration Common Metrix (ICMi)’ which includes, e.g. the ASPT (Average Score per Taxon, Armitage et al. Citation1983), the number of EPT and the total number of families and Shannon–Wiener Index (Bayrak Arslan Citation2015). Except for the ASPT, these assessment methods are relatively universal and easy to implement for Turkey. To calculate the ASPT, BMWP values that are not parameterised for Turkey are used. The BMWP and consequently ASPT were originally developed for Great Britain on the basis of the in-depth knowledge of experts on the environmental requirements of British taxa (Armitage et al. Citation1983). Later, BMWP was modified for several countries such as Canada (Barton and Metcalfe-Smith Citation1992), Spain (Zamora-Munoz and Alba-Tercedor Citation1996) or Poland (Czerniawska-Kusza Citation2005) and has repeatedly been used in Turkey (e.g. Kazanci et al. Citation1997, Citation2010a, Citation2010b, Citation2011, Citation2013; Duran et al. Citation2003; Kalyoncu and Zeybek Citation2011; Zeybek et al. Citation2014). However, a comparative study of the various BMWP values using the different national ASPT showed that the transfer of these country-specific indices to Turkey produces inaccurate results (Zeybek et al. Citation2014).
As a possible index in contrast to the BMWP, the Hindu Kush-Himalaya biotic score (HKHbios; Ofenböck et al. Citation2010) is the result of a clearly documented calculation method based on data from extensive benthic invertebrate sampling. Consequently, this biotic score can be adapted to different countries and catchment areas quite easily using the same calculation method with the specific data of a regional sampling campaign. Another big difference to the BMWP is that the HKHbios is not limited to family-level identification. All identified taxa – that is, family, genus or species level – can be used in the score list. By creating a specific score list for the region of interest, the HKHbios can easily be adapted and used worldwide by analysing the respective regional benthic community compositions. The first step in creating such a score list is the pre-classification of the studied streams into quality classes. A taxon-specific score is calculated based on the frequency of the respective taxon’s occurrence in the different quality classes. In our view, these features make the HKHbios very well suited for the adaptation needed to start developing an assessment procedure for streams in different regions of the world, especially in countries where insufficient taxonomic work has been done so far.
Since multi-metric approaches require further metrics, the proportion of habitat specialists can also be used as a potential indicator for habitat loss. Habitat specialists are organisms that prefer or are even restricted to certain habitats and will therefore disappear with the destruction or degradation of these habitats (Futuyma and Moreno Citation1988; Devictor et al. Citation2010; Poisot et al. Citation2011; Kneitel Citation2018). Due to the high sensitivity of habitat specialists to habitat loss, such an index might specifically indicate hydromorphological degradation. However, to establish an index of habitat use, a better knowledge of the habitat preference characteristics of stream invertebrates is necessary. Until now, many faunistic studies have compiled detailed taxa lists and collected information about the distribution of species throughout Turkey (e.g. Kazanci Citation2001, Kazanci and Türkmen Citation2012; Darilmaz and Salur Citation2015; Salur et al. Citation2016). In addition, autecological information about several taxa has already been well documented (e.g. Graf et al. Citation2008, Citation2009; Buffagni et al. Citation2009; https://www.freshwaterecology.info). However, this information has mainly been collected on European water bodies. Especially on higher-order taxa (genera or families), the information might actually apply to other species than those that are common in Turkey. Due to the specific fauna of Eastern Turkey, it is necessary to gather additional autecological information and to integrate it into a habitat score in order to provide a solid database for a future multi-metric index for stream quality assessment in Turkey.
To contribute to the development of an ecological assessment procedure in Turkey, we aimed to develop a biotic score and a habitat score specifically adapted to the Euphrates catchment area. Therefore, we investigated the benthic invertebrate community composition of 17 streams with different intensities of anthropogenic pressure in their catchment areas in the upper regions of the Euphrates Basin in Eastern Turkey (Anatolia). Based on our data set, we determined the indicator taxa for different ecological quality classes by comparing the community structures of streams with different anthropogenic impact intensities. To verify the specified quality classes, abiotic factors and community indices were analysed. In the next step, we adapted the HKHbios (Ofenböck et al. Citation2010) to the upper Euphrates catchment area by creating a specific scoring list and comparing our own results with existing biotic indices. In addition, we determined the habitat use of macroinvertebrates in the six most natural streams in order to understand the importance of the different habitats and analysed the effect of stream degradation on the proportion of habitat specialists.
Methods
Study sites
The study was performed on 17 mountain streams (2nd to 3rd order) in the Upper Euphrates Basin near the cities of Erzincan, Erzurum and Tunceli in Eastern Anatolia (Turkey, ). Eastern Anatolia has a continental climate characterised by warm, dry summers and cold, snowy winters (Sensoy et al. Citation2008). All sampling sites were located between epirhithral or metarhithral zones of the streams at about 970–1940 m above sea level (). The size of the catchment area was calculated using the software ArcGIS 10.1 (ESRI). Fourteen of the streams drain directly into the Euphrates River; three streams drain into the Pülümür River, one of the main tributaries of the Euphrates River. Large proportions of the catchment areas are used for agriculture and pasture (e.g. 80% of the total area of the province Erzurum and 53% of Erzincan; Environmental Report of Province Erzincan Citation2016; Environmental Report of Province Erzurum Citation2016). The sampling sites represent different levels of habitat diversity and different levels of water pollution and structural degradation (Appendix 1).
Figure 1. Location of stream sites.
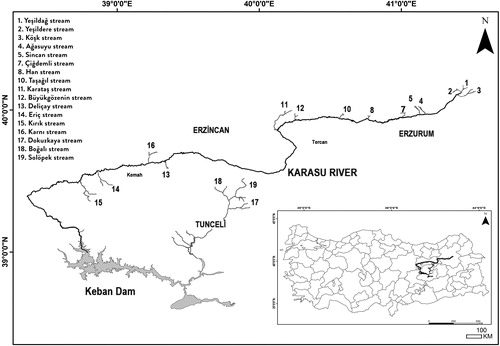
Table 1. Stream characteristics of studied streams.
Field sampling
We sampled all 17 streams at one site per stream in autumn (September 26th to October 5th 2013) and in spring (May 25th to May 31th 2014). At each site, the benthic community was sampled according to the modified AQEM protocol (Hering et al. Citation2004a). Within a 50 m reach of each stream, the relative proportions of substrates and organic materials (% area coverage) were estimated, and 20 individual samples, each representing 5% of substrate coverage, were taken by kick sampling in front of a 25 × 25 cm dip net (1 mm meshes, 0.0625 m2) according to the habitat type distribution. Instead of pooling all 20 subsamples, as described in the AQEM protocol, only samples of the same substrate type were pooled to enable habitat-specific analyses of the invertebrate community. All subsamples were stored in 96% ethanol, which was replaced by 70% ethanol in the laboratory.
To characterise the stream sites, discharge (m³ s−1) was determined by estimating the sectional stream area and current velocity using a velocity head rod (Carufel Citation1980). Samples for physical and chemical measures of the stream water were taken as three replicates from the middle of the stream during the sampling day. The environmental factors temperature [°C], O2-content [mg·Lˉ1], O2-saturation [%], pH and conductivity [µS/cm] were measured (2013: Professional Plus Multiparameter Probe (YSI, Ohio/USA), 2014: Oxi 330, (WTW GmbH, Weilheim/Germany) and WalkLAB TI 9000 (Trans Instruments Pte Ltd, Petro Centre/Singapore). To analyse the NO2-N, NO3-N, NH4-N and PO4 concentrations, on both sampling occasions, water samples were taken from the middle of the stream and filtered (cellulose nitrate filter, 0.45 µm, Sartius Stedim Biotech GmbH, Göttigen/Germany) using a vacuum hand pump (Thermo scientific Nalgene, Waltham/USA). Samples were thereafter stored at 4 °C during the sampling day and at −20 °C until further processing.
Laboratory analyses
The NO2-N, NO3-N, NH4-N and PO4 concentrations in the water samples taken in September 2013 were analysed in the laboratory of Hacettepe University (Ankara/Turkey) with an ion chromatography system (DIONEX LC25 and ICS-1000, Thermo Fisher Scientific Inc. Sunnyvale/USA) using standard methods (Clesceri et al. Citation1989). Water samples from May 2014 were analysed using continuous flow analyses (CFA) in a laboratory at the University of Koblenz-Landau (Koblenz/Germany) with an AA3 HR Autoanalyzer (Seal Analytical, Norderstedt/Germany). All benthic macroinvertebrates were identified to the lowest feasible taxonomic level and counted using a stereo microscope (TSO Thalheim, Pulsnitz/Germany).
Data analysis
The flow velocity V (ms−1) was calculated with the formula where ‘g’ is gravity and ‘h’ is the velocity head. Based on the cross-sectional areas (A in m2) and the stream velocities of the individual sections (0.5 or 1 m wide), we calculated the corresponding discharges using the formula: Q = A * V. The total discharge was calculated from the sum of the individual sections.
To analyse the taxonomic data, taxa with <10 individuals per sample and taxa occurring in only one season were combined with taxa of the same genus or family that occurred in other samples, resulting in more solid information for higher taxonomic units (family or genus). To differentiate the benthic communities of the streams into different quality classes, the similarity of benthic community composition was analysed by employing a cluster analysis based on Bray-Curtis similarities (%) after fourth-root transformation of the abundance data using the Software Primer (version 6). Samples with a minimum similarity of 35% were grouped into the same quality class. Next, based on the level of anthropogenic stressors (Appendix 1), the quality classes were defined. The streams with few or no negative impacts were defined as natural streams (Quality class I); the streams with negative impacts were defined as slightly polluted streams (Quality class II) or moderately polluted streams (Quality class III). To identify indicative taxa for the three quality classes, we used a method by Dufrene and Legendre (Citation1997) practically applied in the function ‘indval’ (R package labdsv: Roberts Citation2015; R Development Core Team Citation2017) for both seasons separately. All taxa that were characterised as indicator taxa in a quality class by our analysis with an indicator value >0.5 were presented.
Nutrient concentrations [mg L−1] of nitrate-nitrogen (NO3-N), ammonium-nitrogen (NH4-N) and total phosphate (PO4) were classified into quality classes using LAWA threshold values (Environmental Federal Office of Germany Citation2019). The total number of taxa, total number of individuals, Shannon Index and evenness were calculated with the software Past 3.21 (2018). The EPT [%] was calculated as the ratio of individuals belonging to the insect orders Ephemeroptera, Plecoptera and Trichoptera to total benthic abundance. EPTCBO [%] including Coleoptera, Bivalvia and Odonata in addition to EPT were calculated accordingly. To determine the differences between the community indices of the three quality classes, the indices were compared using a one-way ANOVA. The values were square-root transformed. If normality could not be reached, a Kruskal–Wallis ANOVA was performed on ranks (Sigma Plot 12.5).
As one metric for the assessment procedure, we adapted the biotic score for the Euphrates tributaries (EUPHbios) based on the calculation method of the Hindu Kush-Himalaya biotic score (HKHbios; Ofenböck et al. Citation2010). Firstly, the so-called Euphrates biotic scoring list was created. To this end, all taxa that did not occur in at least three streams were excluded, reducing the taxa list for this analysis from 134 to 93 taxa. The taxa on the list were identified to species, genus and family level, except Nemathoda, which were not identified. An additional list was compiled by reducing the resolution to family level (57 families and one phylum Nematoda) in order to compare the results of this study to other existing biotic scores based on family level. To distinguish between the two groups, ASPT for genus/species was named ASPT, and ASPT for families was named ASPTFAM (families shortened to ‘FAM’).
For each taxon the ‘guide score’ was calculated according to Sharma and Moog (Citation1996), which was adapted by Ofenböck et al. (Citation2010) to create a five-class system. However, due to the lack of IV and V quality classes among the studied streams, the calculation was shortened to three quality classes in this study:
SI, SII and SIII are the number of streams in which the taxon was found in each quality group. Stot is the number of streams in which the taxon occurred in total. Because the obtained guide scores differed from the HKHbios, they are called ‘Euph-Scores’ in the following text. The ASPT values for the Euphrates are based on this list, including the weighted ASPT value, which represents the ‘Euphrates Biotic Score (EUPHbios)’ proposed here. Using these adapted scores, the variation of ASPT values – such as the family-based value (ASPTFAM), the weighted value (ASPTW = EUPHbios) and the value-based weighted-abundance class (ASPTWA) – were calculated (see Ofenböck et al. Citation2010, for details).
To increase the difference between the quality classes and, in turn, allow a clearer assessment, the ASPT values were weighted by assigning higher weights to clear representatives of Qc I and Qc III. The weighting factor of 5 was assigned to all taxa with a Euph-Score of 10 or 5.50 because these taxa showed a very high level of occurrence in Qc I or Qc III. All taxa with a score between 5.51–6.99 and 8.50–9.99 were weighted with 3 because these taxa were mainly found in neighbouring quality classes.
Weighting was not possible for the ASPTFAM due to the fact that there were always several genera with different scores in any one family. For weighting based on abundance, abundance classes were assigned (Class 1: 1–10; Class 2: 11–100, Class 3: 101–1000; Class 4: 1001–10,000; Class 5: >10,000, see Ofenböck et al. Citation2010) and the class number was used as the factor. The Euph-Scores of six higher-order taxa were extremely different from the guide scores from the HKHbios (Diptera; Chironomidae, Dolichopodidae, Muscoidae, Oligochaeta, Psychodoidae and Nematoda). For these values, the HKHbios guide score was 1 or 2, whereas the value of the Euph-Scores varied between 6 and 10. The ASPT und ASPTFAM were additionally calculated without these six extremes. The EUPHbios and ASPTWA were only calculated with the complete list. In addition, other ASPT values were calculated from the HKH scores (ASPTHKH), Turkish BMWP scores (ASPTTR) and the original BMWP scores (ASPTOR). All ASPT values were compared using a two-way ANOVA with the factors ‘quality class’ and ‘index’. If normality and/or the equality of variance condition were/was not met, the data were log (10) transformed.
In order to quantify the use of different habitats by common taxa, we used data from natural streams and included only taxa that were present in at least three streams with a minimum abundance of 10 individuals m−2 per stream in each sampling season. To calculate the mean habitat-specific abundance of a given species for a specific habitat type, the abundance of each taxon (ind m−2) was calculated for each stream and each habitat type by taking into account the number of samples specifically in this habitat type. In addition, the total abundance of all taxa was calculated (sum of all abundances for each stream, , Step A). Next, the relative abundance of each taxon for each habitat was calculated (percentage of total abundance for the stream, , Step B) and averaged over the sampled streams.
Table 2. Calculation method of the relative abundances.
To describe habitat use, we assigned a habitat score to different classes of relative abundances, whereby relative abundances of 10% corresponded to a score of 1 and the total habitat scores over all habitats added up to 10. However, due to rounding, sometimes only a total score of 9 was reached. For instance, one taxon was distributed as follows: 12%, 14% and 74%. In this case, scores of 1, 1 and 7 were assigned, adding up to a total score of 9. If the abundance differed clearly between the habitats, as in this example, the habitat with the highest abundance was assigned a higher score value (example: 74% = 8).
As an additional metric for the assessment procedure, the proportions of specialists and generalists in each stream were calculated, and compared between sampling campaigns and quality classes using a one-way ANOVA. Generalist and specialist taxa were separated based on the habitat scores. Taxa with a score ≥4 in any one habitat were considered as specialists. When the scores were always ≤4 in all habitat types, the taxa were assigned to the group of habitat generalists. The only exception was Hydraena spp., which had a score of 6 when summing roots and xylal (Appendix 7). Because these habitat types were very similar, this taxon was also considered to be a habitat specialist. The relative abundances of all habitat specialists and generalists, respectively, were added for each stream and sampling occasion. To perform the statistical tests and construct plots, the software Sigma Plot 12.5 (Systat Software GmbH, Erkrath/Germany) was used.
Results
Ecological quality classes
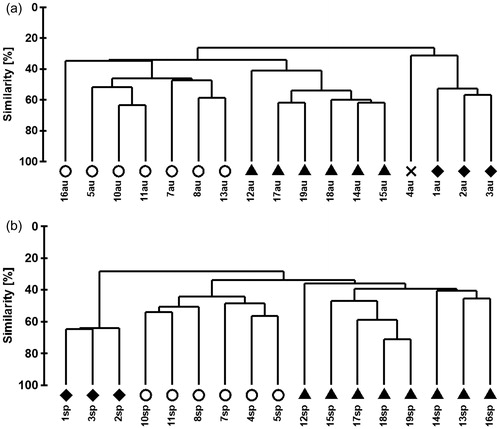
The cluster analysis resulted in three groups of stream communities () which were assigned to the quality classes Qc I (natural streams), Qc II (slightly polluted streams) and Qc III (moderately polluted streams) based on additional information related to anthropogenic pressure on the studied streams (Appendix 1). Streams no. 12, 14, 15, 17, 18 and 19 were assigned to Qc I, streams no. 5, 7, 8, 10 and 11 to Qc II and streams no. 1, 2 and 3 to Qc III. Streams no. 4, 13 and 16 showed no consistent results; they were classified in different groups for each season or even represented an own cluster in the case of stream no. 4. Consequently, these communities were excluded from further analyses.
Figure 2. Cluster analyses of benthic community of all the sites from both seasons based on Bray-Curtis similarity: autumn (au) 2013 and spring (sp) 2014. Quality class I = ▴, Quality class II = ○, Quality class III = ♦, X = own group because of 35% similarity to the other three groups.
Independent of their quality class assignment, the streams were characterised by high oxygen concentrations and alkaline pH values (Appendix 2). The temperatures differed greatly and ranged between 5.9 and 18.6 °C in autumn 2013 and between 9.1 and 20.4 °C in spring 2014.
Most of the nutrient concentrations of the studied streams match their classification according to the LAWA chemical quality classes (Environmental Federal Office of Germany Citation2019). However, the nitrite levels of several streams of Qc II and III were rather high (autumn: Qc III stream no. 1, Qc II stream no. 7, 8 and 10; spring: Qc II streams no. 7 and 13). The nitrate levels of some streams classified in Qc II were higher than in streams of the other quality classes (autumn: stream no. 7; spring: streams no. 4 and 5). The ammonium concentration of most streams was very high in autumn (up to max. 2.32 mg·Lˉ1). The phosphate concentrations were below the detection limit of the analysis (<0.01 mg·Lˉ1 in autumn and <0.003 mg·Lˉ1 in spring) in both seasons, except in Qc III (spring: streams no. 1, 2, 3).
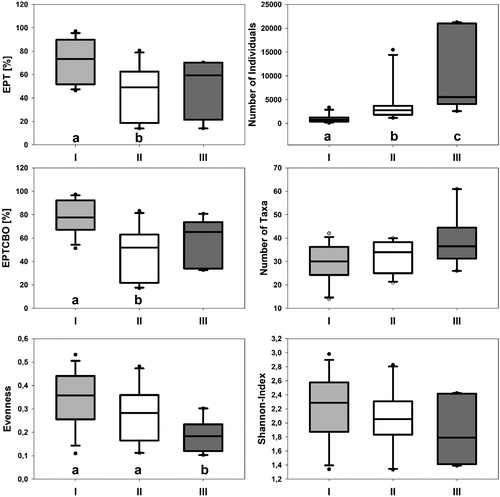
Twenty-three potential indicator taxa were assigned to different quality classes. These taxa clearly occurred predominantly in one class, as shown by the indicator values (R function ‘indval’, Appendix 3). In four of the six calculated fauna-based community indices, the three quality classes differed significantly (Appendices 4 and 5). EPT (total abundance of Ephemeroptera, Plecoptera and Trichoptera) and EPTCBO (EPT and Coleoptera, Bivalvia and Odonata) were highest in Qc I and differed significantly from Qc II. The highest evenness score was recorded in Qc I and differed significantly from that of Qc III. The number of individuals was highest in Qc III and decreased in the direction of Qc I (Kruskal-Wallis one-way analysis, H = 16.73, p < 0.001; Dunn’s method, Qc I (n = 12) × Qc III (n = 6), Q = 3.83, p < 0.05, Dunn’s method, Qc I (n = 12) × Qc II (n = 10), Q = 2.82, p < 0.05). The quality classes did not differ regarding the number of taxa and Shannon diversity.
Euphrates biotic score
The Euph-Scores of 93 taxa, their respective weights () and abundance classes were used to calculate several different versions of ASPT values. However, as assumed, the EUPHbios, based on the Euph-Scores (), showed the sharpest separation among the investigated indices, indicated by higher differences between the means of the quality classes than other scores (). A comparison of the EUPHbios indices to the other ASPT values of the Euph-Scores showed differences between the quality classes in the selected indices (ANOVA, quality × index, p < 0.001, Appendix 6). Weighting of the Euph-Scores regarding indication strength of the taxa resulted in a sharper separation of the quality classes, because the values of Qc I were higher, and those of Qc III were lower (EUPHbios, and Appendix 6). On the other hand, using abundance weighting (ASPTWA) did not improve the separation, because the ASPTWA values did not differ significantly from those of the EUPHbios ( and Appendix 6). Similarly, the ASPT values without extreme taxa did not differ from the ASPT with extreme taxa (ASPT, and Appendix 6).
Figure 3. Box–Whisker plots (median, quartiles, 5th and 95th percentiles, outliers) of the ASPT values in the three different quality classes (I, II, III). ASPT = Average Score per Taxon, EUPHbios = weighted ASPT (ASPTW), ASPT without extremes = ASPT values without extreme taxa, ASPTFAM = ASPT values of family level, ASPTFAM without extremes = ASPT values of family level without extreme taxa, ASPTHKH = ASPT values of the Hindu Kush-Himalaya biotic index (HKHbios), ASPTHKH without extremes = ASPT values of the HKHbios without extreme taxa, ASPTOR = ASPT values of the original biological monitoring working party (BMWP) and ASPTTR = ASPT values of the Turkish BMWP.
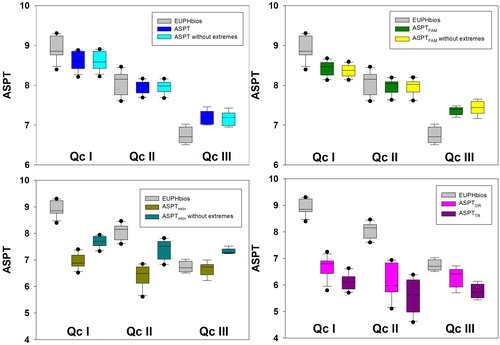
Table 3. Euph-Score list of 93 taxa. Taxa written in bold were considered to be ‘extreme’ based on the calculations of the ASPT-EUPHbios.
In contrast to the EUPHbios, for three out of four ASPT values of other scores (ASPTHKH, ASPTTR, and ASPTOR), the class separation between Qc II and Qc III was not significant (ASPTHKH: Holm Sidak post-hoc test, Qc II (n = 10) vs. Qc III (n = 6), p = 0.29; ASPTOR: Holm Sidak post-hoc test, Qc II (n = 10) vs. Qc III (n = 6), p = 0.68). ASPTTR did not differ between the quality classes (ANOVA, H = 5.182, p = 0.07, n = 12/10/6; Qc I/II/III). Overall, most ASPT values of other scores were significantly lower than those of the EUPHbios (). For these reasons, they did not seem to be suitable for assessment in this study.
Habitat specialisation as a biotic index
We were able to describe the habitat use of 20 taxa sampled in the streams of Qc I (Appendix 7). Among the investigated habitats, lithal habitats were mostly preferred by the analysed taxa. Despite the low presence of xylal and root habitats compared to other habitat types in the studied streams, at least two taxa (Hydraena spp.: Coleoptera, Stratiomys sp.: Diptera) preferred clearly these habitats with scores ≥ 6 for xylal and roots together (Appendix 7). The habitats Akal, CPOM, Psammal, Macrophytes and FPOM can be considered to be of minor importance for these stream communities. Although they were sampled with the same relative effort, only few taxa seemed to prefer these habitat types specifically or even use them at a moderate level. (Appendix 7).
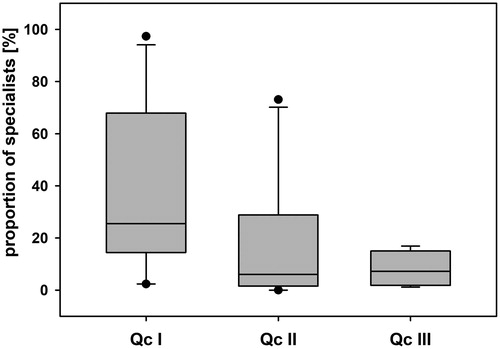
To analyse the potential effect of habitat degradation on benthic community composition, we compared the proportion of habitat specialists in the different quality classes. Based on the habitat score (score ≥4 in one of the habitats, Appendix 7), the following taxa were considered to be specialists: Epeorus sp., Epeorus caucasicus, Epeorus zaitzevi, Ephemerella sp., Perla sp. Hydraena spp., Limoniidae and Stratiomys sp. The remaining twelve taxa, Beatis spp., Rhithrogena sp., Leuctra sp., Protonemura sp., Elmis sp., Hydropsyche instabilis-gr., Hydropsyche spp., Rhyacophila sp., Atherix ibis, Chironomidae, Psychoda sp. and Simulium spp., were considered to be generalists because they did not show a clear preference for one of the habitats (score ≤4, Appendix 7). The proportion of specialists differed significantly between the three quality classes (ANOVA, F = 3.69, p = 0.039, ). The habitat specialists showed a tendency towards higher abundances in natural streams than in slightly or moderately polluted streams (ANOVA, p = 0.087, n = 12/10; Qc I/II and p = 0.072, n = 12/6; Qc I/III). In Qc II and Qc III, the proportions of specialists were similar (ANOVA, p > 0.05, n = 10/6; Qc II/III, ).
Figure 4. Box–Whisker plots (median, quartiles, 5th and 95th percentiles, outliers) of the proportion of specialists in the different streams (Quality classes: Qc I; n = 12, Qc II; n = 10, Qc III; n = 6) in the three different quality classes.
Discussion
The aim of this work was to support the development of methods for the assessment of ecological stream quality in Turkey and to illustrate the good adaptability of the HKHbios, which might be useful for the development of regionalised multi-metric indices. We were able to show that the EUPHbios and the proportion of habitat specialists are promising indices and recommend their use as part of a multi-metric index in regions where assessment approaches using benthic invertebrates are being developed. The calculation method of both indexes is universal and can be used easily by other scientists. This study is the first adaptation of the HKHbios in the Middle East and clearly confirms the general applicability and adaptability of this biotic score in different ecoregions of the world.
There are two advantages of the EUPHbios compared to the BMWP/ASPT indices. Firstly, the taxa list is specifically for the ecoregion. Secondly, the level of identification can vary from phylum to species level, extending the list compared to the BMWP score list. Thus, more precise results can be obtained. The newly adapted EUPHbios proved to be a suitable biotic score for the Euphrates region and is easily adaptable to different ecoregions as described by Ofenböck et al. (Citation2010). In the regions of Nepal and Central Himalaya, the HKHbios was successfully applied shortly after its development (e.g. Shah and Shah Citation2012; Sharma et al. Citation2015), and it has already been adapted to Ethiopia (ETHbios, Aschalew and Moog Citation2015). In addition, the ASPT is basically a mean of taxa scores, which can be weighted by the abundance or the indication value of the single taxa. We suggest weighting values by the indication value, because this increased the Qc I scores and decreased the Qc III scores significantly, thereby increasing differentiation between the quality classes.
Although the currently used indicator in Turkey (TR-BMWP) is also calibrated for Turkey, this calibration is based on expert knowledge. In addition, the indicator includes only the family level and is therefore possibly less sensitive. In fact, the ASPTTR values resulting from the TR-BMWP are lower than the original ASPT values (ASPTOR without any calibration for Turkey) and, more importantly, do not differentiate clearly between the quality classes of our study. The fact that both the original and the adapted BMWP yield significantly lower values than the EUPHbios might be due to the lack of Qc IV and V in this study. Therefore, more heavily impacted sites will have to be included before using the EUPHbios for stream quality assessment. Some taxa, especially those introduced as ‘extremes’ in the methods, need probably to be assigned much lower scores than the scores reported here. Therefore, we recommend continuing the process of adapting the EUPHbios. We expect that after nationwide and ecoregion-specific samplings and assessments, a more realistic EUPHbios or even a national biotic score (TRbios) can be developed.
The second potential indicator, the proportion of habitat specialists, appears to be suitable for assessing the ecological stream quality of the stream types analysed here, because it reacted clearly to degradation or pollution. In general, the presence of specific benthic macroinvertebrates strongly depends on habitat characteristics and spatial and temporal variability (e.g. Southwood Citation1977, Citation1988; Townsend Citation1989; Townsend and Hildrew Citation1994). A high percentage of xylal (defined as tree trunks, branches, roots) is one of the habitat indicators for the very good hydromorphological status of German streams (Feld Citation2004). We assume that the xylal and living roots in the streams of the Euphrates Basin might be important habitats that influences the benthic community, because they were used most intensely among the organic habitats in our study. However, due to the sparsely wooded riverbanks, their spatial proportion was often low (median between 5 and 10%). Indeed, there is already a remarkable amount of knowledge regarding the habitat preferences of benthic invertebrates (www.freshwaterecology.info). However, it does not include data on habitat preferences in Eastern Turkey, and especially data on the preferences of higher-order taxa are usually ecoregion specific.
The biotic indices of this work, based on data from samples taken two times a year, represent the difference between the quality classes more clearly than the recorded environmental conditions. Above all, a higher percentage of sensitive EPT/EPTCBO taxa in Qc I appears to be a useful indicator in our study; the proportion of these taxa is considered to be an indicator of reference streams in the literature (e.g. Moog et al. Citation2004; Meier et al. Citation2006). The number of individuals was highest in the moderately polluted streams, whose largest proportion consisted more of less sensitive taxa. Most of the identified indicator taxa were found in Qc III, because tolerant species usually occur in high densities (e.g. Pearson and Rosenberg Citation1978; Rygg Citation1985). Consequently, a drawback of our analysis of indicator values is that taxa such as Epallage fatime or Epeorus znojkoi, which occurred in very small abundances and only in Qc I, were not identified as indicator taxa although they might possibly have a high indicator value due to their especially high environmental requirements. Therefore, although the data basis was too small to draw further conclusions concerning the indicator value of rare taxa, these taxa should be regarded as potential indicator taxa and their distribution should be studied further.
In conclusion, we suggest that this pilot project might be used as blue print for similar studies in other catchment areas of Turkey. The methods, including the explained calculation methods seem useful for assessing the ecological stream/river quality and can be applied in each ecoregion. For the Euphrates region, by solidifying and enlarging the data base, more indicator taxa and habitat specialists can be defined, improving the quality of the suggested indices further.
Acknowledgements
We owe our thanks to Prof. Dr. Johannes Cullmann, former head of the IHP/HWRP Secretariat, for providing financial support for this work. We would like to thank the staff of the University of Munzur for logistical support, especially Osman Serdar and Ercan Sahin. We would like to thank Wolfram Remmers (University of Koblenz-Landau) especially for his help in the fieldwork and sample analysis. We would also like to thank several specialists for their assistance with taxonomy, especially Dr. André Skale (Natural History Museum Erfurt), Dr. Caner Aydinli (Anadolu University), Dr. Hans Fery (Berlin), Dr. Mustafa Darilmaz (Aksaray University) and Prof. Wolfram Graf (University of Natural Resources and Life Sciences Vienna).
Disclosure statement
No potential conflict of interest was reported by the authors.
References
- Armitage PD, Moss D, Wright JF, Furse MT. 1983. The performance of a new biological water quality score system based on macroinvertebrates over a wide range of unpolluted running water sites. Water Res. 17(3):333–347.
- Aschalew L, Moog O. 2015. Benthic macroinvertebrates based new bioticscore “ETHbios” for assessing ecological conditions of highland streams and rivers in Ethiopia. Limnologica. 52:11–19.
- Barton DR, Metcalfe-Smith JL. 1992. A comparison of sampling techniques and summary indices for assessment of water quality in the Yamaska River, Québec, based on benthic macroinvertebrates. Environ Monit Assess. 21(3):225–244.
- Bayrak Arslan A. 2015. Su Çerçeve Direktifine Göre Biyolojik Kalite Unsuru: Bentik Makroomurgasiz [Biological quality components according to Water Framework Directive: Benthic Macroinvertebrates] [master thesis]. Ankara/Turkey: Ministry of Agriculture and Forestry of Turkey; General Directorate of Water Management. [accessed 2019 January 10]. https://www.tarimorman.gov.tr/SYGM/Menu/20/Tezler. English.
- Böhmer J, Rawer-Jost C, Zenker A. 2004. Multimetric assessment of data provided by water managers from Germany: assessment of several different types of stressors with macrozoobenthos communities. Hydrobiologia. 516(1–3):215–228.
- Buffagni A, Cazzola M, Lopez-Rodriguez MJ, Alba-Tercedor J, Armanini DG. 2009. Distribution and ecological preferences of European freshwater organisms: Volume 3: Ephemeroptera. Sofia/Moscow: Pensoft.
- Carufel LH. 1980. Construction and use of a velocity head rod for measuring stream velocity and flow. BLM/AK Technical Report No. 5. USA: Alaska State Office; p. 3–10.
- Clesceri LS, Greenberg AE, Trussel RR. 1989. Standard methods for the examination of water and wastewater. 17th ed. Washington, DC: American Public Health Association.
- Czerniawska-Kusza I. 2005. Comparing modified biological monitoring working party score system and several biological indices based on macroinvertebrates for waterquality assessment. Limnologica. 35(3):169–176.
- Darilmaz MC, Salur A. 2015. Annotated catalogue of the Turkish caddisflies (Insecta: Trichoptera). Munis Entomol Zool J. 10:521–734.
- De Pauw N, Vanhooren G. 1983. Method of biological quality assessment of watercourses in Belgium. Hydrobiologia. 100(1):153–168.
- Devictor V, Clavel J, Julliard R, Lavergne S, Mouillot D, Thuiller W, Venail P, Villeger S, Mouquet N. 2010. Defining and measuring ecological specialization. J Appl Ecol. 47(1):15–25.
- Dufrene M, Legendre P. 1997. Species assemblages and indicator species: the need for a flexible asymmetrical approach. Ecol Monogr. 67(3):345–366.
- Duran M, Tüzen M, Kayim M. 2003. Exploration of biological richness and water quality of stream Kelkit, Tokat, Turkey. Fresenius Environ Bull. 12(4):368–375.
- Environmental Federal Office of Germany. 2019. LAWA chemical quality classes. [accessed 2019 March 10]. https://www.umweltbundesamt.de/sites/default/files/medien/1968/dokumente/chemische_guteklassifikation.pdf.
- Environmental Report of Province Erzincan 2016. T.C. Erzincan Valiligi Cevre ve Sehircilik il Müdürlügü. [accessed 2018 October 10]. http://webdosya.csb.gov.tr/db/ced/editordosya/Erzincan_icdr2016.pdf.
- Environmental Report of Province Erzurum 2016. T.C. Erzurum Valiligi Cevre ve Sehircilik il Müdürlügü. [accessed 2018 October 10]. http://webdosya.csb.gov.tr/db/ced/editordosya/Erzurum_icdr2016.pdf.
- Feld CK. 2004. Identification and measure of hydromorphological degradation in Central European lowland streams. Hydrobiologia. 516(1–3):69–90.
- Futuyma DJ, Moreno G. 1988. The evolution of ecological specialization. Annu Rev Ecol Syst. 19(1):207–233.
- Graf W, Lorenz AW, Tierno de Figueroa JM, Lucke S, Lopez-Rodriguez MJ, Davis C. 2009. Distribution and ecological preferences of European freshwater organisms: Volume 2: Plecoptera. Sofia-Moscow: Pensoft.
- Graf W, Murphy J, Dahl J, Zamora-Muñoz C, López-Rodríguez MJ. 2008. Distribution and ecological preferences of European freshwater organisms: Volume 1: Trichoptera. Sofia-Moscow: Pensoft Publishers.
- Hering D, Meier C, Rawer-Jost C, Feld CK, Biss R, Zenker A, Sundermann A, Lohse S, Böhmer J. 2004b. Assessing streams in Germany with benthic invertebrates: selection of candidate metrics. Limnologica. 34(4):398–415.
- Hering D, Moog O, Sandin L, Verdonschot PFM. 2004a. Overview and application of the AQEM assessment system. Hydrobiologia. 516(1–3):1–20.
- Kalyoncu H, Zeybek M. 2011. An application of different biotic and diversity indices for assessing water quality: a case study in the Rivers Çukurca and Isparta (Turkey). Afr J Agric Res. 6(1):19–27.
- Kazanci N. 2001. Türkiye Ephemeroptera (Insecta) Faunasi - Ephemeroptera (Insecta) Fauna of Turkey. Ankara, Turkey: Imaj Printing.
- Kazanci N, Basören Ö, Türkmen G, Öz B, Ekingen P, Polat AH. 2013. Assessment of macroinvertebrate community structure and water quality of running waters in Camili (Artvin, Turkey); a part of Caucasus Biodiversity Hotspot, by using Water Framework Directive (WFD) methods. Rev Hydrobiol. 6(2):91–102.
- Kazanci N, Ekingen P, Türkmen G, Ertunc Ö, Dügel M, Gültutan Y. 2010a. Assessment of ecological quality of Aksu Stream (Giresun, Turkey) in Eastern Black Sea Region by using Water Framework Directive (WFD) methods based on benthic macroinvertebrates. Rev Hydrobiol. 3:165–184.
- Kazanci N, Girgin S, Dugel M, Oguzkurt D. 1997. Akarsularin cevre kalitesi yönünden degerlendirilmesinde ve izlenmesinde biyotik indeks yöntemi, Imaj Yayıncılık. Ankara.
- Kazanci N, Öz B, Türkmen G, Başören Ertunç Ö. 2011. Contributions to aquatic fauna of a Biodiversity Hotspot in Eastern Blacksea Region of Turkey with records from running water interstitial fauna of some environmental variables. Rev Hydrobiol. 4(2):131–138.
- Kazanci N, Türkmen G. 2012. The checklist of Ephemeroptera (Insecta) species of Turkey. Rev Hydrobiol. 2:143–156.
- Kazanci N, Türkmen G, Basören Ö, Ekingen P. 2016. TR-BMWP (Turkish-BMWP) biotic index. Rev Hydrobiol. 9(2):147–151.
- Kazanci N, Türkmen G, Ertunç Ö, Ekingen P, Öz B, Gültutan Y. 2010b. Su Çerçeve Direktifi kapsamındaki taban büyük omurgasızlarına dayalı yöntemlerin uygulanması ile Yeşilırmak Nehri’nin ekolojik kalitesinin belirlenmesi. Rev Hydrobiol. 3(2):89–110.
- Kneitel JM. 2018. Occupancy and environmental responses of habitat specialists and generalists depend on dispersal traits. Ecosphere. 9(3):e02143.
- Meier C, Böhmer J, Rolauffs P, Hering D. 2006. Kurzdarstellungen “Bewertung Makrozoobenthos” & “Core Metrics Makrozoobenthos”. [accessed 2018 July 22]. http://asterics.de/downloads/Kurzdarstellungen_MZB_Begleittext.pdf.
- Meier C, Rolauffs P, Hering D. 2004. Weiterentwicklung und Anpassung des nationalen Bewertungssystems für Makrozoobenthos an neue internationale Vorgaben. [accessed 2019 April 15]. http://www.fliessgewaesserbewertung.de/downloads/zwischenbericht_dec_2004.pdf.
- Moog O, Schmidt-Kloiber A, Ofenböck T, Gerritsen J. 2004. Does the ecoregion approach support the typological demands of the EU ‘water framework directive’? Hydrobiologia. 516(1–3):21–33.
- Ofenböck T, Moog O, Sharma S, Korte T. 2010. Development of the HKHbios: a new biotic score to assess the river quality in the Hindu Kush-Himalaya. Hydrobiologia. 651(1):39–58.
- Pearson TH, Rosenberg R. 1978. Macrobenthic succession in relation to organic enrichment and pollution of the marine environment. Oceanogr Mar Biol. 16:229–311.
- Poisot T, Bever JD, Nemri A, Thrall PH, Hochberg ME. 2011. A conceptual framework for the evolution of ecological specialisation. Ecol Lett.14(9):841–851.
- R Development Core Team. 2017. A language and environment for statistical computing. Vienna, Austria: R Foundation for Statistical Computing. [accessed 2018 April 06]. http://www.R-project.org.
- Roberts DW. 2015. Ordination and multivariate analysis for ecology: R package labdsv. [accessed 2018 April 6]. https://cran.r-project.org/web/packages/labdsv.
- Rosenberg DM, Resh VH. 1993. Freshwater biomonitoring and benthic macroinvertebrates. New York (NY): Chapman & Hall.
- Rygg B. 1985. Distribution of species along pollution induced diversity gradients in benthic communities in Norwegian fjords. Mar Pollut Bull. 16(12):469–474.
- Salur A, Darilmaz MC, Bauernfeind E. 2016. An annotated catalogue of the mayfly fauna of Turkey (Insecta, Ephemeroptera). ZooKeys. 620(2):67–118.
- Sensoy S, Demircan M, Ulupinar Y, Balta I. 2008. Climate of Turkey. [accessed 2018 August 10]. http://www.mgm.gov.tr/files/en-us/climateofturkey.pdf.
- Shah RDT, Shah DN. 2012. Performance of different biotic indices assessing the ecological status of rivers in the Central Himalaya. Ecol Indic. 23:447–452.
- Sharma P, Sharma S, Gurung S. 2015. Identification and validation of reference sites in the Andhi Khola River, Nepal. J Resour Ecol. 6(1):30.
- Sharma S, Moog O. 1996. The applicability of biotic indices and scores in water quality assessment of Nepalese rivers. Proceedings of the Ecohydrology Conference on High Mountain Areas; Mar 23–26; Kathmandu, Nepal. p. 641–657.
- Southwood TRE. 1977. Habitat, the Templet for ecological strategies? J Anim Ecol. 46:337–365.
- Southwood TRE. 1988. Tactics, strategies and templets. Oikos. 2:3–18.
- Townsend CR. 1989. The patch dynamics concept of stream community ecology. J North Am Benthol Soc. 8(1):36–50.
- Townsend CR, Hildrew AG. 1994. Species traits in relation to a habitat templet for river 488 systems. Freshw Biol. 31(3):265–275.
- Zamora-Munoz C, Alba-Tercedor J. 1996. Bioassessment of organically polluted Spanish rivers, using a biotic index and multivariate methods. J N Am Benthol Soc. 15:332–352.
- Zeybek M, Kalyoncu H, Karakaş B, Özgül S. 2014. The use of BMWP and ASPT indices for evaluation of water quality according to macroinvertebrates in Değirmendere Stream (Isparta, Turkey). Turk J Zool. 38(5):603–613.
Appendix 1:
Anthropogenic stressors of studied streams.
Appendix 2:
Physico-chemical conditions and nutrient concentrations [mg·L−1] of the studied streams on the sampling days in both seasons (autumn 2013 and spring 2014).
Appendix 3:
All taxa that were significantly defined as indicator taxa for a specific quality class (Qc) resulting from the function “indval” (indicator values and P values given).
Appendix 4:
Proportion of community indices in the three different quality classes (I, II, III) visualized by Box–Whisker plots (median, quartiles, 5th and 95th percentiles, outliers). EPTCBO = Ephemeroptera, Plecoptera, Trichoptera, Coleoptera, Bivalvia and Odonata. “a”, “b” and “c” showed significant differences between the plots.
Appendix 5:
Comparison of the biological indices in three quality classes (Qc).
Appendix 6:
Comparison of the ASPT values via two-way ANOVA.
Appendix 7:
Habitat use by macroinvertebrate taxa in the studied streams in the Euphrates River Basin based on the percentage of abundances in a specific habitat.