
 ?Mathematical formulae have been encoded as MathML and are displayed in this HTML version using MathJax in order to improve their display. Uncheck the box to turn MathJax off. This feature requires Javascript. Click on a formula to zoom.
Abstract
Macrophytes represent one part of the biological quality elements defined by the European Water Framework Directive (WFD) as ‘macrophytes and phytobenthos’. The aim of this study was to evaluate the reliability of ecological status classification by the use of macrophytes for lowland rivers with different habitat conditions, corresponding to EWFD requirements. The classification of water quality is based on the Ecological Quality Ratios (EQRs) which is proposed for the purpose of macrophyte-based classification for the WFD. To determine the ecological quality ratio, we calculated the following indices: River Macrophyte Nutrient Index (RMNI), River Macrophyte Hydraulic Index (RMHI), Macrophyte Index for Rivers (MIR), Number of macrophyte taxa which are not helophytes (NTAXA). Water sources that supply Lepenci River are located in alpine and subalpine areas of the Sharri mountain, which are considered as ecologically clean. Our results show that the water in spring area is clean but as a result of the anthropogenic activities downstream, the river becomes polluted by different pollution substances. This fact is also confirmed by the presence or absence of macrophytes that we used in this work as a biological indicator of water pollution. River Macrophyte Hydraulic Index (RMHI), has shown the highest value at SP6-Gërlicë, with a value of 8.74 that classifies this station downstream the river as the most polluted. The water flow velocity in this station is smooth and as such it is characterized with Macrophyte species associated with this type of water flow. According to the assessment of ecological status with RMNI index, the stations SP7-Kaçanik and SP8-Hani i Elezit, have good water quality and high ecological status and belong to first class (I), whereas the station with poorest water quality (fourth class) and poorest ecological status is rated SP5-Nikë. MIR index classify the quality of water as very good at S8-Hani i Elezit, whereas the values of this index at stations S5-Nikë and S6- Gërlicë indicate the bad water quality and poor ecological status. The largest number of macrophyte species that were not heliophytes was recorded in SP8-Hani i Elezit. We can conclude that the presence of macrophyte species in river varies from nutrient levels in water. Our results show that values of macrophyte based indices reflect the water quality in sampling stations therefore we can consider them as a reliable instrument for the assessment of the ecological status of the rivers.
1. Introduction
Regulations of the Water Framework Directive (Directive 2000/60/EC), establish framework for Community actions in the field of sustainable water policy in Europe. Macrophytes are regarded by the WFD as one of the key groups of biota suitable for bio monitoring of freshwaters and for ecological classification purposes (Szoszkiewicz et al. Citation2007). Macrophytes are one of the four basic elements in the assessment of the ecological condition of rivers in addition to phytoplankton, macroinvertebrates and fish fauna (Gebler et al. Citation2014). Macrophytes have been extensively studied for decades and their ecological properties were a frequent topic of research over a long period (D.F. W Citation1975; Haslam Citation1982; Maberly and Haslam Citation1988; Natho Citation1988; Wilson Citation1988; Wiegleb et al. Citation2015). The loss of natural waters causes biocenotic changes among different groups of aquatic organisms, particularly fish, benthic fauna and aquatic vegetation (Hering et al. Citation2003; Hering, Meier, et al. Citation2004; Hering, Moog, et al. Citation2004; Hering et al. Citation2006). Development of infrastructure in river valleys is associated with the reduction of natural features of watercourses and ecological deterioration of waters (Żelazo Citation2006). The usefulness of living organisms to detect environmental changes has frequently been confirmed in terrestrial as well as aquatic ecosystems. Recently with increasing environmental endangerment and cumulative changes, the role of bioindication plays an increasing importance.
The advantages of biological methods compared to such techniques as water analysis are the complex evaluation of habitat, potentially high precision, and cost-effectiveness (Burchardt et al. Citation2006; Lampert & Sommer Citation1996; Brewin et al. Citation1998; Szoszkiewicz et al. Citation2002; Griffith et al. Citation2005). Numerous papers dealing with mineralization, trophy, and organic pollution in rivers have already demonstrated the possibility of establishing bio-typologies based on flora (Grasmück et al. Citation1995), or phytosociological communities (Carbiener et al. Citation1990; Muller Citation1990), and of developing indices to assess river water quality (Holmes and Whitton Citation1981; Haslam Citation1982; Newbold and Holmes Citation1987; Maberly and Haslam Citation1988).
Water quality can be best described with physico-chemical and biological parameters. Physico-chemical parameters play an important role into system restoration maintenance and self-regulation of water quality (Singh et al. Citation2004). There may also be some correlations between these parameters and useful conclusions can be drawn to show the water quality. The diversity of flora and fauna in aquatic ecosystems and its distribution is directly affected by physical and chemical parameters of environment where all the life processes take place (Anbarasu and Anbuselvan, Citation2017).
The development of aquatic plant communities depends strongly on a variety of abiotic and biotic factors. It is assumed that the most important are: flow velocity (D.F. W Citation1975; Dawson Citation1988; Siobhan Fennessy et al. Citation1994), nutrient concentrations (D.F. W 1975; Robach et al. Citation1996; Schneider et al. Citation2000; Thiébaut et al. Citation2002; Staniszewski et al. Citation2006; Dodkins et al. Citation2012), pH (Tremp and Kohler Citation1995), hydrologicalconditions (D.F. W Citation1975; Natho Citation1988; Baattrup-Pedersen and Riis Citation1999), carbonate hardness, shading (D.F. W Citation1975; Dawson & Kern-Hansen Citation1979), landscape pattern (Wiegleb et al. Citation2015) and hydromorphological modifications (O’Hare et al. Citation2006). Different groups of organisms are used for the biological monitoring of water, including macrophytes which enable the assessment of water quality, reflect the presence and concentration of pollutants, in particular the assessment of trophic water pollution. Macrophytes function as integrators of environmental conditions to which they are subjected and thus can be used as long-term indicators with high spatial resolution (Drake and Heaney Citation1987; Dave Citation1992). The inception of the WFD has stimulated the intensive development and improvement of an array of bio assessment methods across the EU during the last decade (Birk et al. Citation2012; Lyche-Solheim et al. Citation2013). For biological monitoring, it is crucial to develop a method that supports comprehensive, quick and cost-effective surveys and generates highly accurate data for reliable and unambiguous assessments of the ecological status of water bodies (Ciecierska and Kolada Citation2014).
As a result of the global warming and environmental pollution, many plant and animal species are endangered in many parts of the world. Particularly endangered is the biodiversity of freshwaters due to industry development, pesticide use and organic pollution. Therefore, monitoring of the flora and fauna of these ecosystems and in particular the rivers is of great importance.
Freshwater ecosystems are of great importance for human life and human well-being. Therefore, huge number of researches has recently been done on biological monitoring and study of the aquatic ecosystem based on indicator organisms. In Kosovo, this is the first study that have used Macrophyte indices RMNI, RMHI and MIR based on requests of European Water Framework Directive, to assess water quality of Lepenci River Basin.
The purpose of this research was to evaluate the ecological status of the Lepenci River basin water using macrophytes, based on the hypothesis that the water of this river during its course changes physicochemical and biological parameters according to the organic pollution and other pollution caused by anthropogenic factor.
This study aims to achieve these objectives:
How many species of macrophytes are in Lepenci River Basin?
Can macrophyte based indices be used to classify the water quality of Lepenc River Basin?
Are there any correlations between macrophytes and nutrients in the water?
2. Materials and methods
2.1. Study sites
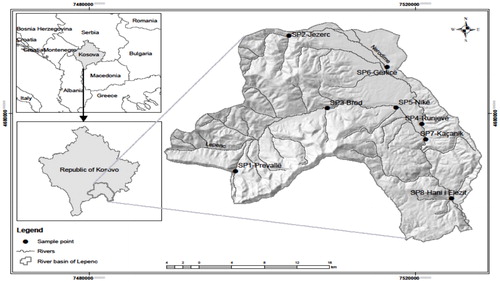
The Lepenc River Basin is located in the south-eastern part of Kosovo and shares the international border with Macedonia in the south-west and south-east. This basin covers an area of 674 km2 (MESP Citation2010a) or 6.17% of the territory of the Republic of Kosovo. It represents one of Kosovo’s most picturesque and ecologically rich areas, with a remarkable water potential. The flow velocity is 9 m/s on average and 10.71 m3/s/km2 on average (MESP Citation2010a). The most important tributary of Lepenci is Nerodime river, which is known in the geographical literature for its bifurcation. Lepenci has level-pluvial regime of the dinar-Macedonian variant, reaching maximum flow in May with 12.7 m³/s and minimum in August with 1.3 m³/s. In the Lepenci basin during the year there is an average of 893 mm of rain which is above the average rainfall in Kosovo. Lepenci in the territory of Kosovo is 53 km long, basin area has 607 km2, and average annual flow 7.9 m³/s. Lepenci flows into the Vardar River, north of Skopje, and then joins the Aegean Sea (MESP Citation2010b).
The area used for the study represents an area of hilly-mountainous and partly flat terrain. Regarding to the climate, in hilly and mountainous areas dominates the continental climate, whereas going to the border with North Macedonia, the climate is sub Mediterranean, influenced by the valley of river Vardar. In terms of the temperature, the lowest average temperature is −1.39 °C in January, whereas the highest average temperature is in July and August 21.83 °C. In the mountainous area the average amount of rainfall is 1000 mm/year, while in the lowlands the average annual rainfall is 690 mm/year.
The lowland (640 m) and hilly-mountainous areas on both banks of the Lepenci River are dominated by Alder car forests (Alnion glutinosae Malcuit 1929) and willow forests (Salicion albae de Soo 1951) ().
Figure 1. Location of investigated area.
2.2. Field data collection and methods
Based on WFD methodology, in the stations where macrophyte were present (S4-S8) samples were taken in a distance of 100 meters across the river in a zigzag mode. Three samples were taken for each station from the beginning of June until the end of September, because vegatation phase is different for different species. Some plant species were identified in the field, while others were taken to be identified in the laboratory. Samples were not taken at the time of flood and spring season, because these are two factors that inhibit macrophyte growth. The study was conducted using standard methods CEN 14184: 2003 Water Quality Guidance standard for the surveyeing of the aquatic macrophytes in running waters (Comitè Europèenne de Normalisation CEN 2003). RMNI and MIR indexes have been successfully applied in other countries: Poloni (Sierka and Tomczak Citation2013; Jusik and Staniszewski Citation2019), Lativi (Linda and Jolanta Citation2016), UK (WFD-UKTAG Citation2014), Kazakhstan (Muratov et al. Citation2015). The ecological status is evaluated based on various indicators of biological quality. Assessments are based on the Ecological Quality Ratio (EQR), which indicates the relationship between the values of biological parameters observed in a water body and in reference conditions applicable to that water body (Hering et al. Citation2010).
Kosovian Macrophyte Index for rivers is a biological method to assess the trophic status and impact of eutrophication of rivers in Kosovo. The method has been developed as a modified method of estimating Polish and UK rivers, based on the RMNI, RMHI and MIR indices calculation (Staniszewski et al. Citation2006; Willby et al. Citation2009; Sierka and Tomczak Citation2013; WFD-UKTAG Citation2014; Jusik and Staniszewski Citation2019), and it is adjusted according to the conditions of the Republic of Kosovo. The consistency and comparability of the classification results delivered by three of methods were tested within the EU Water Framework Directive intercalibration exercise (Birk and Willby Citation2010; Birk et al. Citation2012; Lyche-Solheim et al. Citation2013).
The scientific plant names have been used according to The Plant List (working list of all plant species), Euro + Med PlantBase (Euro + Med 2006) and Flora Europea (Tutin et al. 1968–Citation1980). Additional literature was used to determine plant species: Flora of Albania (Paparisto et al. Citation1988; Vangjeli et al. Citation2000), Flora of Bulgaria (Jordanov et al. 1963–Citation1964; Jordanov & Kožuharov, Citation1970, Citation1966, Citation1979; Velćev and Kožuharov Citation1982) , to Flora of Serbia (Josifović 1970–Citation1977; Josifovic et al. Citation1972, Citation1973; Saric & Diklic, Citation1986) whereas, the nomenclature used was according to the databases of the Plant List (Citation2013, theplantlist.org).
We used Spearman’s Correlation between nutrients: Total Phosphorus (PT), Total Nitrogen (NT), Ammonium ion (NH4 +), Nitrite ion (NO2-), Nitrite (NO3-), phosphate ion (PO43-), Macrophyte indices and EQR values.
The analyzes of nutrient parameters and collected samples are done based on the standard ISO 5667-6, which determines the principles to be applied in designing the programs in sample collection, the techniques of sample collection and the treatment of water samples from rivers and flows for nutrients assessment (ISO Citation2014). The analysis of water samples taken from the Lepenci river basin is realized in the laboratory of the Hydro-meteorological Institute of Kosovo. Water samples for nutrient determination in first two stations were taken only once, as spring area filtrations were not done, whereas in other stations the samples were filtrated before determination of nutrient values. The water quality parameters are determined using quite sophisticated measuring equipment, which are contemporary and conform to international standards. Nitrates are measured with the device SECOMAM prim light based on the standard of the method DIN 38405-D9; phosphates and the total phosphorus (TP) are analyzed with the type of the device SECOMAN Prim Light based on ISO 6878; the ammonium ion is analyzed with the device SECOMAN Prim Light based on ISO 7150/1; nitrates are analyzed with the device SECOMAN Prim Light based on the standard of the method DIN EN 26 777 D10.
2.3. Calculated indexes
Macrophytes are plants that play an important role in aquatic ecosystems as they absorb nitrogen and phosphorus from the polluted waters with these chemicals, a process that affects the reduction of pollution levels (Brix Citation1997). In addition, macrophytes also stabilize the bed surface of water bodies and prevent soil erosion. Based on macrophytes, the River Macrophytes Nutrient Index (RMNI) and River Macrophytes Hydraulic Index of (RMHI) were calculated and show water quality classification. During our research we calculated the following indexes:
2.3.1. River macrophytes nutrient index (RMNI)
This index measures the aquatic plants (macrophytes) that grows in the river, and their relation to nutrients, and is expressed on scale of 1–10, depending on the amount of nutrients (WFD-UKTAG Citation2008). River Macrophytes Nutrient Index (RMNI) is calculated according to the formula:
(1)
(1)
where
‘Rj’ is the river macrophyte nutrient index score in Column 3 of for taxon ‘j’;
Table 1. List of species, calculated indexes and EQR value of macrophytes in the Lepenci river basin.
‘j’ represents a taxon listed in Column 1 of , present in the sample and with a value listed in Column 3 of . ‘j’ has a value of 1 to ‘n’ indicating which of all the taxa (total number = ‘n’) listed in Column 1 of and present in the sample it represents; and
‘Cj’ is the taxon cover value for taxon ‘j’ determined in accordance .
2.3.2. River macrophyte hydraulic index (RMHI)
This index is a measure of aquatic plants (macrophytes) that grows in the river, and is related to the river flow rate, and is expressed on scale of 1–10, the higher the flow rate the higher the energy and vice versa (WFD-UKTAG Citation2008). Hydraulic Index (RMHI) is calculated according to the formula:
(2)
(2)
where
‘Hj’ is the river macrophyte hydraulic index score in Column 4 of for taxon ‘j’; ‘j’ represents a taxon listed in Column 1 of , present in the sample and with a value listed in Column 4 of . ‘j’ has a value of 1 to ‘n’ indicating which of the all taxa (total number = ‘n’) listed in Column 1 of and present in the sample it represents; and ‘Cj’ is the taxon cover value for taxon ‘j’ determined and .
Number of macrophyte taxa which are not helophytes (NTAXA)
The value for the parameter, NTAXA, in the reference conditions applicable to the river should be calculated using the following equation:
(3)
(3)
Number of functional groups of macrophyte taxa which are not helophytes (NFG)
The value for the parameter, NFG, in the reference conditions applicable to the river should be calculated using the following equation:
(4)
(4)
2.3.3. How do we decide the biological status?
Statistical models are used to predict the community structure of macrophytes in a river. For each of the five characteristics, a ratio is calculated to compare what is observed in the river with what would be found in a similar river with no or very low human disturbance. The five ratios are combined into a single number, the Ecological Quality Ratio (EQR), that ranges from 1 (un-impacted or natural state) to 0 (highly degraded by pollution or other disturbance).
This is subdivided equally into the five bands as required by the Water Framework Directive ().
Table 2. Biological status boundary values (WFD-UKTAG, Citation2008).
Calculation of the ecological quality ratio (EQR) for each parameter River Macrophyte Nutrient Index (RMNI).
The ecological quality ratio for the parameter, RMNI, should be calculated using the following equation:
(5)
(5)
River Macrophyte Hydraulic Index (RMHI).
The ecological quality ratio for the parameter, RMHI, should be calculated using the following equation:
(6)
(6)
Macrophyte Index for Rivers (MIR) was calculated based on the results of the research (coverage of riverbed surface by the particular plant species) and the values of L and W (Szoszkiewicz et al. Citation2010) with the following formula:
(7)
(7)
where MIR – value of the Macrophyte Index for Rivers at the sampling site, N – number of species at the sampling site; Pi – ratio of coverage for the i-th taxon; Wi – weighting factor for the i-th taxon; Li – indicator value for the i-th taxon (Szoszkiewicz et al. Citation2010; Sierka & Tomczak, Citation2013) ( and ).
Table 3. Macrophyte index for rivers values for sandy type of river (Szoszkiewicz et al. Citation2010).
The lower the MIR value, the more degraded is the watercourse in terms of trophic status. MIR values range from 10 for eutrophic rivers to up to 100 for rivers with the best ecological status. The MIR limit values were used to determine the class of water quality in the examined river, which were assigned to the 5 classes of water quality for the type of lowland sand and organic rivers (Szoszkiewicz et al. Citation2002, Citation2010; Sierka and Tomczak Citation2013; Gebler et al. Citation2014).
2.4. Data analysis
Statistical data processing was done by using SPSS 24 statistical software which made it easier to interpret the results statistically, GIS program which mapped the study area and monitoring stations and the Excel program with which produced graphs showing descriptive and comparative statistics.
Also, we used Spearman’s Correlation with SPSS 24, Analysis Variance with Excel between the nutrients: Total Phosphorus (PT), Total Nitrogen (NT), Ammonium ion (NH4+), Nitrite ion (NO2-), Nitrite (NO3-), phosphate ion (PO43-), and indices RMNI, RMHI, MIR and EQR values.
3. Results
This study includes calculation of the Lepenci river basin, River Macrophyte Nutrient Index (RMNI), River Macrophyte Hydraulic Index (RMHI), determination of non-helophytes species, determination and classification of ecological status by RMNI, RMHI, MIR AEQRRMNI AEQRRMHI, also calculating Speareman’s correlation between the nutrients and the above-mentioned indices and EQR values (WFD-UKTAG Citation2008). Based on the results analyzed during our research in the Lepenci River Basin we found 13 species of Macrophytes. The richest stations with species were SP8- Hani i Elezit with 11 species, SP7-Kaçanik with 6 species, SP6-Gërlicë with 3 species, SP5-Nikë with 1 species, SP4-Runjevë with 7 species, while in the other three stations SP1-Prevallë, SP2-Jezerc, SP3-Brod, no species were found at all because the water flow is very high and the dominant substrate is stony. The SP1-Prevallë and SP2-Jezerc stations are also the spring area, while at the SP3-Brod station the river basin is completely excavated due to the construction of the hydropower plant.
According to the RMNI Index (River Macrophyte Nutrient Index) the most nutrient-rich station is the SP5-Nikë station with a value of 8.65 where only Rumex hydrolapathum Huds. (1762) was dominant at this station, which was the only species because the river basin was degraded as a result of highway construction. High values of this index are also shown at SP6-Gërlicë 7.56 station, where the amount of nutrients was also high. At this station, three species are dominant Phragmites australis Adans. (1763), Potamageton pasillus L. (1753), Typha angustifolia L. (1753), which are species that live in nutrient rich places. While at the SP7-Kaçanik stations RMNI has a value of 6.46 and the SP8-Hani i Elezit station 7.00. All of these stations are rich with nitrogen and phosphorus nutrients due to various organic pollutants coming from sewage from households and animal manure from agricultural areas. The development of macrophyte plants has also been influenced by the water temperature downstream river, which is higher and affects the growth of Macrophytes.
According to the RMHI Index (River Macrophyte Hydraulic Index) the highest values of this index are presented at SP6-Gërlicë station 8.74, because this station is the most polluted and has slow water flow, and as a result it is characterized with Macrophyte species associated with this type of water flow. The number of non-heliophytic macrophyte species in the SP4-Runjevë station is 3, in SP5-Nikë is 0, SP6-Gërlicë 1, SP7-Kaçanik 4, SP8-Hani i Elezit 8. Based on the ecological status classification (EQR) of RMNI station SP4- Runjevë is one (1), so water quality belongs to the first class (I) and high ecological status, but according to (WFD UK) guidelines if the value is one (1) we can say is unconfigured.
The SP5-Nikë station has an EQR value of 0.37 whereby water quality is poor and belongs to the fourth grade (IV) and has poor ecological status, while the SP5-Nikë station has an EQR value of 0.66, where water quality belongs to the second grade (II) and good ecological status, while SP7-Kaçanik station has EQR value of 0.97 and SP8-Hani i Elezit station has EQR value of 0.82 where based on these values the water quality at these stations is very good (High) and belongs to the first grade (I).
According to the ecological status classification (EQR) values of RMHI station SP5-Nikë has an EQR value of 0.6 where water quality based on this river value at this station is good, belongs to the second class (II) and good ecological status. SP6-Gërlicë station has an EQR value of 0.39 where water quality is poor based on the fourth grade (IV) and poor ecological status, whereas SP7-Kacanik station has EQR value of 0.98 and SP8-Hani i Elezit station has an EQR value of 0.90, by this value the river water quality at these stations is very good (high) and the water quality belongs to the first class (I) and the status is high ecological ().
Based on the adjustment of the ecological quality ratio by calculating the RMNI Ecological Quality Scale (AEQRRMNI) the values for the AEQRRMNI at the station are as follows: SP4-Runjevë one (1), SP5-Nikë 0.16, SP6-Gërlicë 0.54, SP7-Kaçanik 0.96, SP8-Hani i Elezit 0.76. While the value of AEQRRMNI at SP4-Runjevë station is 2.57, SP5-Nikë is 0.46, SP6-Gërlicë is 0.18, SP7-Kaçanik is 0.97, SP8-Hani i Elezit is 0.86.
According to the values of the MIR index, the quality of water is very good and belongs to the first class (I) at the eighth station, while at the stations SP4, SP5, SP6 and SP7 the quality of water is poor and very bad and belongs to the fourth class, respectively to the fifth class. Thus, macrophyte diversity seems to be comparable to European conditions and a monitoring system based on aquatic plants can be organized in Republic of Kosovo on a comparable scale to Europe, UK and Poland. Preliminary comparative evaluation of indicator species of aquatic vegetation in Kosovo shows the possibility of the environmental assessment of rivers based on aquatic plants. Our analysis revealed that a large number of aquatic plants recorded in Kosovo can be used as bioindicators in biological monitoring for ecological status assessment in rivers in Europe. We have confirmed that the majority of species used in the RMNI, RMHI and MIR system are present in river basin Lepenci ().
Phosphorus is an essential element for the growth of the living beings and can be a nutrient which limits the primary productivity of the water communities. The variation of TP has been from <0.01 mg/L up to 3.487 mg/L in SP6, in Gërlica station (). This station is very polluted from municipal wastewater discharge directly into the river, also from agricultural activities and industry. The variation of TN has been from 2 mg/L in SP1 up to 27 mg/L at SP6. The same situation is with value of total nitrogen. The water-soluble ammonia gets transformed into ammonia ion. The presence of ammonia in water is a dangerous pollution of water. Also, during the chlorination of water with chloramines, NH3 can be registered in water. So, the water quality assessment is made by comparing it with other quality indicators for example with micro-biological results. The variation of NH4+ was from <0.01 mg/L up to 0.522 mg/L (). Nitrites are toxic and their amount in river waters is maximally limited to 0.3 mg/L nitrites as nitrogen. They get formed in water with the dissolution of the biological and industrial pollution. Deep waters can be micro-biologically polluted with nitrites which are created with anaerobe dissolution.
The variation of NO2- was from 0.51 mg/L inSP1 up to 4.56 mg/L at SP4 ().
Table 4. The values of nutrients river basin Lepenci.
Nitrates in surface waters are present on small amounts, while in deep waters they can be found on large amounts. The water containing nitrates has a good taste and is fresh. But high concentrations are unwanted, because under the influence of the red algae, nitrates can be reduced into nitrites which are toxic. Nitrates present the final product of the biological oxidation of the organic pollution. This shows that the water has been polluted earlier. The value of NO3- was from <0.1 mg/L in SP6 to 7.1 mg/L in SP8 (). There is also a trend of water quality deterioration in the direction downstream of the river. The variation of PO43- was from < 0. 02 mg/L in SP1, SP2, SP3 up to 1. 519 mg/L at SP6 ().
From the table above we can see that total phosphorus (Ptot) has only one significant correlation (p < 0.01) with AEQRRMHI positive correlation, and total nitrogen Ntotale (<0.05) positive correlation while the parameter ammonium ion (NH4+) has a significant correlation with three different indices. It has positive correlation (p < 0.05), with indices RMNI, EQRRMNI and AEQRRMNI (). The parameter Nitrite (NO3-) has one significant correlation with AEQRRMHI, which is negative (p < 0.05) and phosphate ion (PO43-) has one significant correlation with AEQRRMHI, which is positive (p < 0.01) ().
Table 5. The Spearmen’s Correlation between the nutrients, Macrophyte indices and EQR.
The table shows that the measured values for the Ptot parameter has mean value as 1.904 and variance 0.86, parametric Ntot has mean value 16.2 and variance 51.20, parametric NH4 shows mean value 0.31 and variance 0.03, NO2 indicates mean value 1.02 and variance 0.74, PO4- indicates mean value 1.02 and variance 0.15 (). In this respect the values distributed more than the average indicate the Ntot parameter as compared to the other parameters measured at the same stations, then the values most dispersed by the mean indicate Ptot and PO4-.
Also the EQRHMI, MIR indices show a larger distribution than the average value compared to other indices (see )
Table 6. Analysis of variance and mean averages at monitoring stations.
3.1. Categorization of hydromorphological quality of Lepenci River Basin
Based on the assessment of the hydromorphological component of Lepenci river basin during the research in 2017, the hydromorphology of river at SP1-SP8 monitoring stations can be classified as follows:
SP1-Prevallë: riverbed almost is natural, no modification was observed, quality is high; SP2-Jezerc riverbed slightly modified from natural factors(erosion), quality is good. At SP3-Brod, riverbed and water flow are modified as a result of hydropower construction, quality is moderate; SP4-Runjevë: riverbed loaded with different waste, moderate modification, quality is moderate. SP5-Nikë: riverbed is highly modified as a result of the intervention for construction of new highway, poor hydromorphological quality at the time of construction. SP6-Gërlicë: riverbed is moderately modified as a result of substrate change by sedimentation of various pollutants, quality is moderate. SP7- Kaçanik: significant modification was recorded as a result of cementing of the riverbank by municipal authorities, poor hydromorphological quality. SP8-Hani i Elezit: severe modification, many interventions in riverbed, destruction of riparian vegetation around the bank and changes of the water flow as a result of interventions for construction of ‘Arber Xhaferi’ highway, the quality is bad. In terms of river typology according to WFD (Citation2000) and classification of the Ecoregions (Ilies Citation1962) river Lepenci belongs to Ecoregion 6 (WFD Citation2000, annex XI). In terms of altitude categorization of the river source area, Lepenci belongs to the first category (>800 masl), while in terms of the basin size it belongs to the average category 100–1000 km2 (674 km2). This classification is based on system A of the classification based on abiotic factors.
4. Discussion
Analysis of the state of flora in river basin Lepenci in Kosovo showed a relatively small number of macrophyte species (13 taxa). Based on the existing data, the state of knowledge of the aquatic flora in Kosovo is poor and the number of publications on this topic is small. In recent years, information on the ecological status of river basin Lepenci in Kosovo has been complemented from research by Bytyçi et al. (Citation2019). According to this research, in Lepenci River Basin 139 diatom algae species are recorded, and different diatomic indices (IBD, IPS, IDG, Descy, Sla, IDSE, IDAP, EPID, CEE, WAT, TDI, IDP and SHE) are calculated to classify water quality. The best water quality is observed at the monitoring stations in Prevalla (SP-1) and Jezerc (SP-2), where water quality belongs to the first class. At other monitoring stations (SP-3 to SP-8) the water quality varied from the second (II) to the fourth (IV), while according to the 2018 research the Water Quality Index based on heavy metals (Mn > Fe > Pb > Ni > Cd > Zn > Cr > Cu) ranges from 57 to 81, with the mean value of WQI = 68.1250, which ranks the waters of this basin as Fair quality (Bytyçi et al. Citation2018, Citation2019).
Compared to the research of Ruslan et al. on aquatic vascular flora of Kazakistan, we have 64% similarity of the aquatic flora and adaptability of the MIR (Macrophyte Index for river) (Muratov et al. Citation2015). Whereas compared to the Research Reports from Latvia (Linda and Jolanta Citation2016) we have 76% similarity and MIR index suitability. Lepenci river basin macrophytes have 92% similarity and suitability of RMNI and RMHI indices. While compared to the research in Slovenia (Kuhar et al. Citation2011) we have 61.5% similarity to aquatic flora of macrophytes. According to research in the Ceyhan Basin (Özbay et al Citation2019) which is located in the Adana provinces (Turkey), this basin is composed of 23 species of macrophyte plants and has 23% similarity with the Lepenci River Basin.
Based on our results, we can confirm that the RMNI, RMHI and MIR indices reflect well the degradation rate of the Lepenci River Basin. Similar to several other studies (Thiébaut and Muller Citation1999; Birk and Willby Citation2010), analyzes demonstrated the applicability of macrophyte methods for ecological quality assessment in relation to trophic degradation.
It is expected that as a result of future botanical research, more species will be confirmed among Kosovar flora and the number of aquatic species will increase with research in other river basins. Thus, the diversity of macrophytes appears to be comparable to European conditions and a water-based monitoring system can be organized in Kosovo on a comparable scale to other European countries.
Our analysis conclude that a large number of aquatic plants recorded in the Lepenci River Basin are used as bio indicators in biological monitoring for assessing ecological status in European rivers.
5. Conclusion and recommendation
Based on our research we conclude that Lepenci River basin along its course is a subject to many anthropogenic pressures that alter the quality of water and the composition and distribution of macrophytes in the river. These changes are smaller upstream of the basin, in mountainous areas, and are increasing in the middle stream and downstream that are mainly in rural and urban areas.
Macrophytes grow in presence of water pollution, from which they provide nutrients that enable the growth, hence the most polluted downstream stations of river basin had also the greater number of species.
Therefore, based on the results of this research, we recommend the use of macrophytes as biological indicators for water quality classification in all river basins in our country and beyond, because it truly fulfills all the requirements set by the Water Framework Directive on biological indicators for assessing and classifying the ecological status of water bodies. It can be concluded that the implementation of the WFD for river basin assessment provides a great deal of information that should be used by the state authorities to develop a regular system of monitoring and management of the river basins in the country.
Disclosure statement
No potential conflict of interest was reported by the authors.
References
- Anbarasu K, Anbuselvan G. 2017. Physico-chemical parameter analysis of water in Musiri Taluk, Tamil Nadu, India. World News Nat Sci (WNOFNS). 6(1):36–43.
- Baattrup-Pedersen A, Riis T. 1999. Macrophyte diversity and composition in relation to substratum characteristics in regulated and unregulated Danish streams. Freshw Biol. 42(2):375–385.
- Birk S, Bonne W, Borja A, Brucet S, Courrat A, Poikane S, Solimini A, Van De Bund W, Zampoukas N, Hering D. 2012. Three hundred ways to assess Europe’s surface waters: an almost complete overview of biological methods to implement the Water Framework Directive. Ecol Indic. 18:31–41.
- Birk S, Willby N. 2010. Towards harmonization of ecological quality classification: establishing common grounds in European macrophyte assessment for rivers. Hydrobiologia. 652(1):149–163.
- Brewin PA, Buckton ST, Ormerod SJ. 1998. River habitat surveys and biodiversity in acid-sensitive rivers. Aquatic Conserv Mar Freshw Ecosyst. 8(4):501–514.
- Brix H. 1997. Do macrophytes play a role in constructed treatment Wetlands. Water Sci Technol. 35(5):11–17.
- Burchardt L, Messyasz B, Stępniak A. 2006. Diversity of phytoplankton community in Borusa and Grundela Ponds. Teka Komisji Ochrony i Kształtowania Środowiska Przyrodniczego. 3(1):35–40.
- Bytyçi P, Fetoshi O, Durmishi BH, Etemi FZ, Çadraku H, Ismaili M, Abazi AS. 2018. Status assessment of heavy metals in water of the Lepenci River Basin, Kosova. J Ecol Eng. 19(5):19–32.
- Bytyçi P, Ymeri P, Czikkely M, Fetoshi O, Shala-Abazi A, Ismaili M, Ramshaj Q, Millaku F. 2019. The application of benthic diatoms in water quality assessment in Lepenci River Basin, Kosovo. J Ecol Eng. 20(11):43–57.
- Carbiener R, Trémolières M, Mercier JL, Ortscheit A. 1990. Aquatic macrophyte communities as bioindicators of eutrophication in calcareous oligosaprobe stream waters (Upper Rhine plain. Alsace). Vegetatio. 86(1):71–88.
- Ciecierska H, Kolada A. 2014. ESMI: a macrophyte index for assessing the ecological status of lakes. Environ Monit Assess. 186(9):5501–5517.
- D.F. W. 1975. Primary production of freshwater macrophytes. Photosynth Product Differ Environ. Hidrobiologia. 12(1):177–180.
- Dave G. 1992. Sediment toxicity and heavy metals in eleven lime reference lakes of Sweden. Water Air Soil Pollut. 63(1-2):187–200.
- Dawson FH. 1988. Water flow and the vegetation of running waters. In: Veg Inl waters. Dordrecht: Kluwer Academic Publishers.
- Dawson FH, Kern-Hansen U. 1979. The effect of natural and artificial shade on the macrophytes of Lowland streams and the use of shade as a management technique. Int Rev Der Gesamten Hydrobiol Und Hydrogr. 64(4):437–455.
- Dodkins I, Aguiar F, Rivaes R, Albuquerque A, Rodríguez-González P, Ferreira MT. 2012. Measuring ecological change of aquatic macrophytes in Mediterranean rivers. Limnologica. 42(2):95–107.
- Drake JC, Heaney SI. 1987. Occurrence of phosphorus and its potential remohilization in the littoral sediments of a productive English lake. Freshwater Biol. 17(3):513–523.
- EN 14184.2003.
- Euro + Med. 2006. Euro + Med PlantBase - the information resource for Euro-Mediterranean plant diversity. [accessed 2017 Oct 02]. http://ww2.bgbm.org/EuroPlusMed/
- Gebler D, Kayzer D, Szoszkiewicz K, Budka A. 2014. Artificial neural network modelling of macrophyte indices based on physico-chemical characteristics of water. Hydrobiologia. 737(1):215–224.
- Grasmück N, Haury J, Léglize L, Muller S. 1995. Assessment of the bio-indicator capacity of aquatic macrophytes using multivariate analysis. Hydrobiologia. 301(1):115–122.
- Griffith MB, Hill BH, McCormick FH, Kaufmann PR, Herlihy AT, Selle AR. 2005. Comparative application of indices of biotic integrity based on periphyton, macroinvertebrates, and fish to southern Rocky Mountain streams. Ecol Indic. 5(2):117–136.
- Haslam SM. 1982. A proposed method for monitoring river pollution using macrophytes. Environ Technol Lett. 3(1-11):19–34.
- Hering D, Borja A, Carstensen J, Carvalho L, Elliott M, Feld CK, Heiskanen A-S, Johnson RK, Moe J, Pont D, et al. 2010. The European Water Framework Directive at the age of 10: a critical review of the achievements with recommendations for the future. Sci Total Environ. 408(19):4007–4019.
- Hering D, Buffagni A, Moog O, Sandin L, Sommerhäuser M, Stubauer I, Feld C, Johnson R, Pinto P, Skoulikidis N, et al. 2003. The development of a system to assess the ecological quality of streams based on macroinvertebrates – design of the sampling programme within the AQEM project. Internat Rev Hydrobiol. 88(34):345–361.
- Hering D, Johnson RK, Kramm S, Schmutz S, Szoszkiewicz K, Verdonschot P. 2006. Assessment of European streams with diatoms, macrophytes, macroinvertebrates and fish: a comparative metric-based analysis of organism response to stress. Freshw Biol. 51(9):1757–1785.
- Hering D, Meier C, Rawer-Jost C, Feld CK, Biss R, Zenker A, Sundermann A, Lohse S, Böhmer J. 2004. Assessing streams in Germany with benthic invertebrates: selection of candidate metrics. Limnologica. 34(4):398– 365.
- Hering D, Moog O, Sandin L, Verdonschot P. 2004. Overview and application of the AQEM assessment system. Hydrobiologia. 516(1-3):1–20.
- Holmes NTH, Whitton BA. 1981. Phytobenthos of the River Tees and its tributaries. Freshw Biol. 11(2):139–163.
- Ilies S. 1962. Die bedeutungder Stremung fur die Biocenoze i Rhitron und Potamon. Schweizerische Zeitschrift fur Hydrologie. 1(1):433–435.
- ISO. 2014. ISO 5567-6 Water quality sampling-part 6. Guidance on sampling of rivers and streams.
- Jordanov D, Kitanov B, Valjev S. 1963–1964. Flora of RP Bulgaria. Vols. 1and 2. Sofia: Bulgarian Academy of Sciences and Arts.
- Jordanov D, Kožuharov B. 1966. Flora of RP Bulgaria. Vol. 3. Sofia: Bulgarian Academy of Sciences and Arts.
- Jordanov D, Kožuharov B. 1970. Flora of RP Bulgaria. Vol. 4. Sofia: Bulgarian Academy of Sciences and Arts.
- Jordanov D, Kožuharov B. 1979. Flora of RP Bulgaria. Vol. 7. Sofia: Bulgarian Academy of Sciences and Arts.
- Josifović M., ed. 1970–1977. Flora SR Srbije, Vols 1–9.
- Josifovic ML, Stjepanovic L, Jankovic M, Gajic B, Kojic M, Diklic N. 1972. Flora SR Srbije III, SANU, Beograd, Yugoslavia.
- Josifovic ML, Stjepanovic L, Jankovic M, Gajic B, Kojic M, Diklic N. 1973. Flora SR Srbije IV, SANU, Beograd, Yugoslavia.
- Jusik S, Staniszewski R. 2019. Shading of river channels as an important factor reducing macrophyte biodiversity. Pol J Environ Stud. 28(3):1215–1222.
- Kuhar U, Germ M, Gaberščik A, Urbanič G. 2011. Development of a river macrophyte Index (RMI) for assessing river ecological status. Limnologica. 41(3):235–243.
- Lampert W, Sommer U. 1996. Ekologia wód śródlądowych. Poloni: Wydawca Wydawnictwo Naukowe PWN.
- Linda U, Jolanta J. 2016. Report fitting the assessment system for rivers in Latvia using Macrophytes to the results of the Central Baltic Geographical Intercalibration group, Riga.
- Lyche-Solheim A, Feld CK, Birk S, Phillips G, Carvalho L, Morabito G, Mischke U, Willby N, Søndergaard M, Hellsten S, et al. 2013. Ecological status assessment of European lakes: a comparison of metrics for phytoplankton, macrophytes, benthic invertebrates and fish. Hydrobiologia. 704(1):57–74.
- Maberly SC, Haslam SM. 1988. River plants of Western Europe: the macrophytic vegetation of the watercourses of the European Economic Community. J Ecol. 76(4):1248–1249.
- Ministry of Environment and Spatial Planning (MESP). 2010a. General description of hydrography. Pristina.
- Ministry of Environment and Spatial Planning (MESP). 2010b. The state of water report in Kosovo, Pristina. 31–35.
- Muller S. 1990. Une sequence de groupements vegetaux bio-indicateurs d’eutrophisation croissante des cours d’eau faiblement mineralises des basses vosges greseuses du nord. Comptes Rendus L’Academie Des Sci - Ser III. 3(1):509–514.
- Muratov R, Szoszkiewicz K, Zhamangara A, Jusik S, Gebler D, Beisenova R, Akbayeva L. 2015. An attempt to prepare macrophyte index for rivers for assessment watercourses in Kazakhstan. Meteorol Hydrol Water Manage. 3(2):27–32.
- Natho G, 1988, HASLAM, S. M., River plants of Western Europe. The macrophytic vegetation of watercourses of the European Economic Community. XII, 512 S., 313 Abb., 171 Tab. Cambridge University Press. Cambridge, London, New York, New Rochelle, Melbourne, Sydney, 1987. I. Feddes Repert.
- Newbold C, Holmes N. 1987. Nature conservation: water quality criteria and plants as water quality monitors. Water Pollut Control. 186:345–364.
- O’Hare MT, Baattrup-Pedersen A, Nijboer R, Szoszkiewicz K, Ferreira T. 2006. Macrophyte communities of European streams with altered physical habitat. Hydrobiologia. 566(1):197–210.
- Özbay H, Yaprak AE, Turan N. 2019. Assessing water quality in the Ceyhan River basin (Turkey) with the use of aquatic macrophytes. Chem Ecol. 35(10):1–12.
- Paparisto K, Demiri M, Mitrushi I, Qosja X. 1988. Flora of Albania. Vol. 1. Tirana: Albanian Academy of Sciences and Arts.
- Robach F, Thiébaut G, Trémolières M, Muller S. 1996. A reference system for continental running waters: Plant communities as bioindicators of increasing eutrophication in alkaline and acidic waters in north-east France. Hydrobiologia. 340(1-3):67–76.
- Saric M, Diklic N. 1986. Flora SR Srbije X, SANU, Beograd, Yugoslavia
- Schneider S, Krumpholz T, Melzer A. 2000. Indicating the trophic state of running waters by using TIM (trophic index of macrophytes) - exemplary implementation of a new index in the River Inninger Bach. Acta Hydrochim Hydrobiol. 30(2000):1–8.
- Sierka E, Tomczak A. 2013. Macrophytes in the assessment of river ecological condition on the example of Pszczynka River (Silesian Upland). Environ Socio-Economic Stud. 1(3):14–20.
- Singh P, Malik A, Mohan D, Sinha S. 2004. Multivariate statistical techniques for the evaluation of spatial and temporal variations in water quality of Gomti River (India)-a case study. Water Res. 38 (18):3980–3992.
- Siobhan Fennessy M, Cronk JK, Mitsch WJ. 1994. Macrophyte productivity and community development in created freshwater wetlands under experimental hydrological conditions. Ecol Eng. 3(4):469–484.
- Staniszewski R, Szoszkiewicz K, Zbierska J, Lesny J, Jusik S, Clarke RT. 2006. Assessment of sources of uncertainty in macrophyte surveys and the consequences for river classification. Hydrobiologia. 566(1):235–246.
- Szoszkiewicz K, Jusik S, Lawniczak AE, Zgola T. 2010. Macrophyte development in unimpacted lowland rivers in Poland. Hydrobiologia. 656(1):117–131.
- Szoszkiewicz K, Jusik S, Zgola T, Czechowska M, Hryc B. 2007. Uncertainty of macrophyte-based monitoring for different types of lowland rivers. Belgian J Bot. 140(1):7–16.
- Szoszkiewicz K, Karolewicz K, Ławniczak A, Dawson FH. 2002. An assessment of the MTR aquatic plant bioindication system for determining the trophic status of Polish Rivers. Polish J Environ Stud. 11(4):421–427.
- The plant list 2013. Version 1. www.theplantlist.org.
- Thiébaut G, Guérold F, Muller S. 2002. Are trophic and diversity indices based on macrophyte communities pertinent tools to monitor water quality. Water Res. 36(14):3602–3610.
- Thiébaut G, Muller S. 1999. A macrophyte communities sequence as an indicator of eutrophication and acidification levels in weakly mineralised streams in north-eastern France. Hydrobiologia. 410(1):17–24.
- Tremp H, Kohler A. 1995. The usefulness of macrophyte monitoring-systems, exemplified on eutrophication and acidification of running waters. Acta Bot Gall. 142(6):541–550.
- Tutin HG, Heywood VH, Burges NA, Moore DM, Valentine DH, Walters SM, Webb DA. 1968–1980. Flora Europaea. Vols. 2–5. Cambridge: Cambridge University Press.
- Vangjeli J, Ruci B, Mullaj A, Paparisto K, Xh Q. 2000. Flora of Albania. Vol. 4. Tirana: Albanian Academy of Sciences and Arts.
- Velćev VD, Kožuharov S. 1982. Flora of RP Bulgaria. Vol. 8. Sofia: Bulgarian Academy of Sciences and Arts.
- WFD. 2000. Directive 2000/60/EC of the European Parliament and of the Council of 23 October 2000 establishing a framework for Community action in the field of water policy. Off J Eur Parliam.
- WFD-UKTAG. 2008. UKTAG river assessment methods macrophytes and phytobenthos macrophytes (River leafpacs). Scotland: Water Framework Directive - United Kingdom Advisody Group (WFD-UKTAG).
- WFD-UKTAG. 2014. UKTAG guide to phytobenthos in rivers - diatoms for assessing river and lake ecological quality (DARLEQ2). Scotland: Water Framework Directive – United Kingdom Advisory Group (WFD-UKTAG).
- Wiegleb G, Herr W, Zander B, Bröring U, Brux H, van de Weyer K. 2015. Natural variation of macrophyte vegetation of lowland streams at the regional level. Limnologica. 51(1):53–62.
- Willby N, Pitt JA, Phillips G. 2009. The ecological classification of UK Rivers using aquatic macrophytes. Report – SC010080/R2.
- Wilson C. 1988. River plants of Western Europe. The macrophytic vegetation of watercourses of the European Economic Community. S. M. Haslam. Q Rev Biol. ISBN-13: 978–1107634671
- Żelazo J. 2006. River and Valley restoration (in Polish). Infrastructure and ecology of rural areas. Polska Akademia Nauk, Oddział w Krakowie, Komisja Technicznej Infrastruktury Wsi. 4(1):11–31.