
 ?Mathematical formulae have been encoded as MathML and are displayed in this HTML version using MathJax in order to improve their display. Uncheck the box to turn MathJax off. This feature requires Javascript. Click on a formula to zoom.
Abstract
The effect of reed (Phragmites australis) and cattail (Typha angustifolia) extracts at different decomposition stages (fresh and dead) on the growth of a cyanobacterium, Microcystis aeruginosa, was investigated. Effective concentration 50 (EC50) of extracts were quantified based on dissolved organic carbon (C) concentration. The 100-day extract of fresh cattail showed the most inhibitory EC50 value of 19.3 mg C/L. We found that the fresh plant was more inhibitory than the dead plant for both species based on EC50 and the comparison of growth percentage in the maximum concentration of extracts, implying different compounds were produced during the time course of decomposition. The results of this study suggest that lake restoration efforts that include using emergent macrophytes to control nuisance algae should consider macrophyte life stage and decomposition time together with selecting macrophyte species, although further chemical identification is required to understand the allelochemical production in a variety of decomposition stages.
1. Introduction
It is well-known that aquatic macrophytes and algae have mutually antagonistic relationships for growth through a variety of mechanisms including nutrient competition (Nakai et al. Citation1996), provision of refuge for zooplankton by macrophytes (Jeppesen et al. Citation1998) and secretion of allelopathic compounds in macrophytes (Gross Citation2003; Gao et al. Citation2017; Tazart et al. Citation2019; Zhou et al. Citation2019). The use of natural chemicals extracted from plants to control nuisance algae is among the most effective restoration techniques for aquatic ecosystems (e.g. Zuo et al. Citation2016; Kang et al. Citation2017; Tebaa et al. Citation2018). Particularly, utilizing terrestrial plant extracts from straws of barley, rice, and rye has demonstrated the possibility of their use as natural algicides for cyanobacteria (Gross et al. Citation2007; Kang et al. Citation2017).
In lakes and wetlands, macrophytes living in the littoral zone show annual life cycles (i.e. growth in the growing season; decomposition in the dormant season). Allelopathic compounds derived from macrophytes, whether during growth or decomposition, can be continuously excreted and accumulated in the water columns. Although the compounds released can serve as nutrients because they are high in soluble proteins, carbohydrates, and lipids (Buchsbaum et al. Citation1991), many studies have demonstrated the importance of macrophytes as sources of natural algicides (Nakai et al. Citation1996) [e.g. watermilfoil (Myriophyllum spicatum: Aliotta et al. Citation1996), Chara (Chara globularis: Anthoni et al. Citation1980), water lettuce (Pistia stratiotes: Aliotta et al. Citation1991; Pollio et al. Citation1993), water hyacinth (Eichhornia crassipes Solms: Yu et al. Citation1991; Sharma et al. Citation1996), and water soldiers (Stratiotes aloides: Mulderij et al. Citation2005)].
Considering the life cycle of macrophytes in aquatic ecosystems, there is still little information on the relationship between the duration of macrophyte decomposition and the release of allelopathic compounds. In this study, we focused on emergent macrophytes, reed (Phragmites australis) and cattail (Typha angustifolia) because of their dominance in many lake and wetland systems and the vegetative characteristics with long-lived roots compared with floating-leaf macrophytes in the littoral zone. We hypothesized that as reed and cattail decomposed, the chemical composition of extracts might differ with decomposition time and the life cycle status of macrophytes (fresh vs. dead biomass). In turn, macrophyte extracts at different decomposition times will have different effects on the growth of a nuisance cyanobacterium, Microcystis aeruginosa. The hypothesis of the study was that decomposing macrophytes will produce allelochemicals that reduce the growth of Microcystis aeruginosa, and the overall objective was to understand the relationship between macrophyte decomposition and allelochemical production. Therefore, the specific objective of this study was to investigate the effects of reed and cattail extracts at a range of decomposition times (maximum 100 days) and two different growth stages (fresh vs. dead) on the growth of M. aeruginosa.
2. Materials and methods
2.1. Collection of plant material
Stems and leaves of reed (P. australis) and cattail (T. angustifolia) were collected from the littoral zone of Lake Paldang (Yangpyeong, Korea; 37°32´09.9˝N, 127°18´41.9˝E) on April 18th, 1998 and separated into fresh and dead types for each species. All samples were immediately moved to a laboratory, rinsed three times with tap water, dried at 50 °C for three days, and stored in the dark at room temperature (approximately 20 °C). Before the decomposition experiment, stored samples were cut, pulverized, and sieved through 1-mm mesh. The procedures for sample preparation and experimental methods were the same as in Kang et al. (Citation2017).
2.2. Macrophyte decomposition
A portion of each sample type (9 g dry weight) (i.e. fresh reed, dead reed, fresh cattail, and dead cattail) was placed in a 2-L Erlenmeyer flask with 1.8 L of algal culture medium (Moss Citation1972). The composition (units: mg/L) of the culture medium was: 16.8 Ca2+, 5.0 × 10⁻⁴ Co2-, 3.0 EDTA, 2.0 × 10⁻² Fe3+, 2.2 K+, 2.4 Mg2+, 2.0 × 10⁻² Mn2+, 4.0 × 10⁻³ Mo6+, 13.6 Na+, 6.4 NH4+, 21.0 NO3-, 0.9 P5+, 3.3 S6+, 4.9 Si4+, 5.0 × 10⁻³ Zn2+, 3.3 × 10⁻⁸ cyanocobalamin (B12), 3.3 × 10⁻⁷ d-biotin and 3.3 × 10⁻⁸ thiamin-HCl (B1). An aerator was used to provide a continuous stream of air, ensuring the aerobic conditions that have been shown as one of the critical conditions to produce allelopathic compounds (Welch et al. Citation1990; Newman and Barrett Citation1993). Also, a humidifier was installed at the aerator’s inlet vent to protect evaporative water losses (Kang et al. Citation2017).
At the designated decomposition time (), 200 mL of the extract was filtered through a glass fiber filter (GF/F, Whatman®). The filtered extract was lyophilized and stored in a desiccator in a refrigerator (4 °C) for the remained of the experiment. A stock solution was produced by dissolving 20 mg of lyophilized material in 100 mL of sterilized medium and filtering (GF/F, Whatman®). To prepare solutions with different dissolved organic carbon (DOC) concentrations, the stock solution was diluted with sterilized medium to the range of test solutions shown in . A control solution (0.0 mg C L−1) without the stock solution was prepared using only culture medium to represent a control concentration. The concentration of DOC in filtered extracts was measured using a TOC analyzer (TOC-5000A, Shimadzu). To investigate chemical changes (i.e. aromaticity) in extracts with time, 10 mL of stock solution was stored in a refrigerator (4 °C) and sampled at each decomposition time.
Table 1. Decomposition time, extract concentrations, EC50, percentage of growth at the maximum concentration compared to the control and number (n) of replicate samples. Values in parenthesis in EC50 are calculated by extrapolation.
2.3. Algal culture
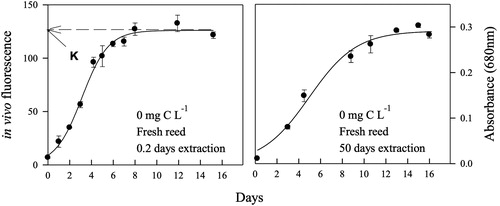
Four mL of test solution was transferred into five culture tubes (ca. 11 mL, USA Scientific Culture Tube) and capped before autoclaving. After one day of cooling to 25 °C, 0.3 mL of M. aeruginosa culture (obtained from the Institute of Hydrobiology, Chinese Academy of Science, Wuhan, China) was inoculated into four culture tubes and incubated. The remaining uninoculated culture tube (four replicates) was used as a baseline for optical measurements (e.g. fluorescence or absorbance) of test solutions. M. aeruginosa in exponential or stationary growth stage was used in the experiments, incubated at 25 ± 1 °C with a light intensity of 80 μE m−2 sec−1 for 24 h, and agitated with a vortex mixer twice a day. The incubated culture tubes were repositioned at least four times a week. The in vivo fluorescence of M. aeruginosa was measured at 1 or 2 day intervals using a spectrofluorophotometer (Model RF-1501, Shimadzu) at 343 nm of an excitation wavelength and 680 nm of an emission wavelength. After 50 days extraction for reed and cattail and for 1-day extraction of leaves, absorbance at 680 nm was measured at 1 or 2 day intervals using a spectrophotometer (Model 101, Hitachi). We normalized the monitoring of the growth of M. aeruginosa in the control solution measured by in vivo fluorescence of 0.2-day extracts of fresh reed and absorbance of 50 day extracts of fresh reed (; Schanz and Zahler Citation1981; Kang et al. Citation2017).
Figure 1. Examples of monitoring the growth of Microcystis aeruginosa in two optical instruments (left: in vivo fluorescence at 343 nm of an excitation and 680 nm of an emission, right: absorbance at 680 nm) in control solutions (0 mg C L−1) of 0.2 days (left) and 50 days incubation (right) of fresh reed materials. The letter ‘K’ in the left axis shows the maximum growth estimated by a regression analysis with the logistic function. Error bars indicate standard deviation (n = 3).
2.4. EC50 determination and statistics
A logistic model was used to estimate the maximum growth (K) of M. aeruginosa with the following equation (Schanz and Zahler Citation1981; Kang et al. Citation2017):
where Y = biomass of M. aeruginosa measured by fluorescence or absorbance, x = time (day), K = maximum growth yield, and x0 and a = coefficients. The curve fitting and selecting K values were done using SigmaPlot (Version 11.0, Systat Software Inc.) (See the example of K in ).
The normalized maximum growth yield in test solutions was estimated using K values for control and test solutions;
The effective concentration (EC50), which refers to the concentration when 50% normalized maximum growth yield occurred, was estimated the DOC concentration at 50% normalized maximum growth yield (Yamane et al. Citation1984; Kang et al. Citation2017). The two closest DOC concentrations above and below the 50% concentration were averaged to estimate EC50 (Yamane et al. Citation1984). For cases showing inhibition below 50% among test solutions, the EC50 value was extrapolated using the two closest DOC concentrations at 50% inhibition (Kang et al. Citation2017). One-way analysis of variance (ANOVA) (α = 0.05, post hoc Duncan test) was used to compare algal growth among the DOC extracts using Minitab (Version 16, Minitab Inc.).
2.5. Suva as an indicator of chemical changes in extracts with time
Specific UV absorbance (SUVA; the ratio of UV absorbance at 260 nm and DOC concentration) was measured to quantify the change in the aromaticity of extracts with time (Kang and Mitchell Citation2013). Optical absorbance was determined using a spectrophotometer (Model UV-2401PC, Shimadzu). SigmaPlot (Version 11.0, Systat Software Inc.) was used for curve fitting.
3. Results
3.1. EC50 during reed and cattail decomposition
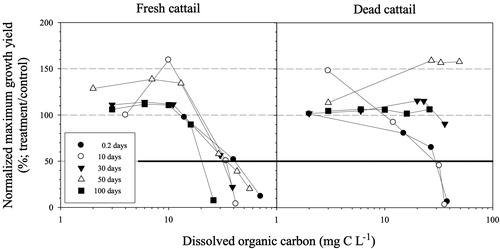
The 100-day extracts of fresh cattail showed the highest inhibition effect (i.e. the lowest EC50 value of 19.3 mg C L−1) on the growth of M. aeruginosa, and 10-day extracts of fresh and dead reeds followed with 27.2 and 27.3 mg C L−1, respectively (). In the comparison of fresh and dead types, both reed and cattail at short-term decomposition times (i.e. less than ten days) showed an inhibitory effect for both types (, and ). However, dead reed and cattail showed stimulation of M. aeruginosa at the highest extract DOC concentration at long-term decomposition times (i.e. more than 30 days), although fresh types inhibited algal growth in the same period (, and ). In the comparison of reed and cattail, average EC50 values for fresh reed and cattail were 44.9 (± S.D. 16.8) and 30.5 (± S.D. 7.6) mg C L−1, respectively, with no significant difference between types (p > 0.05). When DOC concentrations in fresh extracts increased, the extent of inhibition on M. aeruginosa growth also increased, but no significant relationship between decomposition time and EC50 was observed (data not shown).
Figure 2. Relationship between DOC concentrations (mg C L−1) and normalized maximum growth yield (%; calculated by dividing maximum growth yield (‘K’ value) in experimental concentration by control value) in extracts as a function of the extraction period in fresh (left) and dead (right) reed. Note that the bold solid line indicates 50% inhibition (EC50) on the y axis.
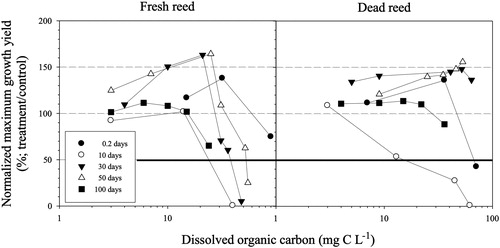
Figure 3. Relationship between DOC concentrations (mg C L−1) and normalized maximum growth yield (%; calculated by dividing maximum growth yield (‘K’ value) in experimental concentration by control value) in extracts as a function of the extraction period in fresh (left) and dead (right) cattail. Note that the bold solid line indicates 50% inhibition (EC50) on the y axis.
3.2. Effect of DOC concentration on algal growth
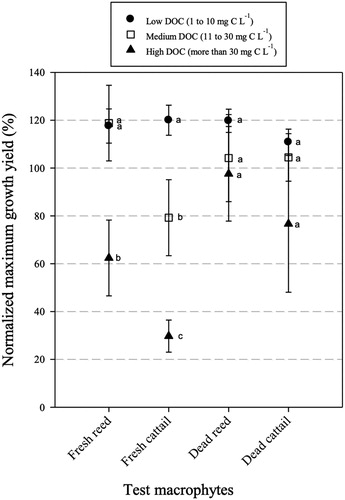
The normalized maximum growth yield (%) at different DOC concentrations was compared to understand the effect of only DOC concentrations on the growth of M. aeruginosa (). DOC concentrations were grouped into three levels (unit: μmol L−1); low (1 to 10), medium (11 to 30), and high (more than 30) DOC (Kang et al. Citation2017). For fresh reed and cattail, there were significant differences at the high concentration compared with low and medium concentrations (; F2,18 = 6.234, p < 0.01 and F2,20 = 20.920, p < 0.001, respectively), indicating that the inhibition of M. aeruginosa growth was related to the DOC concentrations in extracts from fresh reed and cattail. However, the comparison among fresh and dead types did not show any statistically significant differences among extract DOC concentrations (p > 0.05).
Figure 4. Means (standard error) of normalized maximum growth yields (%) with DOC levels in tested macrophytes (●: low level from 1 to 10 mg C L−1, □: medium level from 11 to 30 mg C L−1, ▲: high level of more than 30 mg C L−1). Small letters indicate a significant difference among levels (one-way ANOVA; post hoc Duncan test, p < 0.05).
3.3. Changes in extract aromaticity
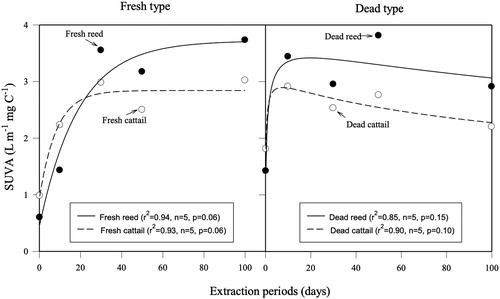
The relationship between decomposition time and SUVA in fresh and dead types is shown in . The results indicate that each model can explain at least 85% of the variation in aromaticity. The pattern for fresh and dead types differed, suggesting that during decomposition, some chemical characteristics of the extracts, as measured by SUVA, are changing.
Figure 5. Relationship between extraction periods (days) and SUVA at 260 nm (L m−1 mg C−1) in fresh (left) and dead (right) types for reed and cattail. Two different regression models between fresh and dead types are used: ‘exponential rise to maximum’ for fresh type and ‘peak, log normal’ for dead type calculated by SigmaPlot (Systat Software Inc.).
4. Discussion
Our results demonstrate the inhibition of extracts from reed and cattail on the growth of M. aeruginosa (). Fresh biomass showed more inhibition on growth than dead biomass for both reed and cattail, and 100-day extracts of fresh cattail showed the highest inhibition (, and ). The temporal pattern in aromaticity (measured as SUVA) appears to differ between fresh and dead types (), suggesting that some chemical characteristics of the plant extracts differ between fresh and dead reed and cattail tissue. The highest inhibition in the high DOC concentration extracts occurred regardless of decomposition time (). This might suggest that when the export of macrophyte tissue from the littoral zone occurs, the DOC input associated with the plant tissue can be sources of some yet unidentified essential allelopathic compounds with the ability to inhibit algal growth. The exact causes for differences in inhibition of M. aeruginosa will require additional studies on the chemical characteristics of the organic compounds produced during decomposition of reed and cattail. Also, possible modes of inhibition on M. aeruginosa need to be studied (Gao et al. Citation2017).
4.1. Allelochemicals from reed and cattail
In the time-course decomposition of macrophytes, the 100-day extract from fresh cattail showed the highest inhibition (EC50 value: 19.3 mg C L−1, ). The inhibition of dead type for both species nearly disappeared at the end of decomposition (i.e. 100 days) compared to fresh type for both species (, and ), showing that fresh extracts had some characteristics to better inhibit algal growth. Some studies have used different approaches such as using organic solvents to extract allelochemicals from reed and cattail and have found different results from our study (Li and Hu Citation2005). Experiments on long-term decomposition processes using reed and cattail are limited despite the importance of understanding the dynamics of allelopathic compound derived from macrophytes in the littoral zone in freshwater ecosystems.
Using a related species of reed (P. communis Tris), Li and Hu (Citation2005) found that the allelopathic activity of the methanol-extracted fraction from P. communis had an EC50 of 0.79 mg L−1 and was related to a decrease of antioxidant enzyme activity. Hong et al. (Citation2008) isolated ethyl 2-methyl acetoacetate (EMA) from P. communis, suggested as a potent allelopathic inhibitor on the growth of M. aeruginosa due to EMA-induced antioxidant responses. Li et al. (Citation2007) also studied the negative effect of EMA on the growth of M. aeruginosa, and found that EMA played a role in breaking the cell wall and membrane, resulting in damaging the nuclear and mitochondrial structure.
For cattail species, total phenolics and tannin content were shown to affect the growth of M. aeruginosa using the leaves of Typha orientallis (Chen et al. Citation2012). Aliotta et al. (Citation1996) reported that phenolic acids founded in Typha latifolia L. inhibited the growth of several algal species. Ethyl acetate extracted from T. latifolia L. decreased the growth of M. aerunosa (33.6% inhibition rate at a concentration of 40.0 mg L−1, Wang and Zhang Citation2017). In another study, Wang et al. (Citation2014) extracted volatile oils from T. latifolia L. and measured an inhibition rate of 43.3% at a concentration of 50.0 mg L−1. The inhibition on the growth of M. aeruginosa measured in our study could be attributed to those chemicals, but more detailed studies on the changes in chemical characteristics and the nature of likely allelopathic compounds are needed.
4.2. Humification of allelochemicals during decomposition
Our study found that the inhibition ability of the fresh type of macrophytes increased or sustained with decomposition time (, and ). In addition, the positive relationship between decomposition time and SUVA values for fresh macrophytes suggests that a relative increase in the proportion of recalcitrant organic compounds such as phenolic compounds and humic substances occurred () because SUVA values are positively correlated with recalcitrant DOC (Kalbitz et al. Citation2003; Kang and Mitchell Citation2013). Humic substances play an essential role in inhibiting algal growth (e.g. Kim and Wetzel Citation1993; Kang et al. Citation2017). Kim and Wetzel (Citation1993) showed that humic acid produced from decaying T. latifolia and pyrogallol inhibited the growth of Anabaena flos-aquae and M. aeruginosa, respectively. An earlier experiment using straw extracts sampled during decomposition showed the importance of humic substances on the inhibition of the growth of M. aeruginosa (Kang et al. Citation2017). The exact mechanisms for the ability of humic substances to inhibit algal growth are still uncertain, and polyphenols (part of humic substances) likely play an important role in building complexes with algal exoenzymes, which are inactivated, and inhibit photosynthetic electron transport (Leu et al. Citation2002). The results from our present study suggest that the input of humic substance from the littoral zone with the macrophytes studied here (P. australis) and (T. angustifolia) can contribute to efforts to control the growth of M. aeruginosa.
4.3. Allelochemicals from other macrophytes
Extracts from aquatic macrophytes include many compounds such as phenolics, lignin, tannin, and aromatic compounds, and these substances are all part of the total humic substances present (Thurman Citation1985). Previous studies have reported on the allelochemicals extracted from hornwort (Ceratophyllum demersum L.) (Amorim et al. Citation2019), watermilfoil (Myriophyllum spicatum and M. verticillatum), water hyacinth (Eichnornia crassipes) (Sharma et al. Citation1996; Aliotta et al. Citation1996) and water lettuce (Pista stratiotes L.) (Aliotta et al. Citation1996). Planas et al. (Citation1981) demonstrated the presence of at least 18 different phenolic compounds, and the major compounds were identified as ellagic (Macioszek et al. Citation2010), gallic, and sinapic acids. Saito et al. (Citation1989) and Aliotta et al. (Citation1996) reported that several hydrolyzable polyphenols with algicidal activity were isolated from other Myriophyllum species. All of these polyphenols contained at least one gallic acid residue. Gross and Sutfeld (Citation1994) found galloyl glycosides from M. spicatum, and Parks and Rice (Citation1969) found that a range of phenolics, including gallic acid, inhibited cultures of Lyngbya and Anabaena. Saito et al. (Citation1989) reported that the EC50 concentration of gallic acid and ellagic acid for M. aeruginosa to be about 1.6 and 4.2 mg L−1 C, respectively. Also, Eleocharis dulcis (Wen et al. Citation2017), Chara globularis (Anthoni et al. Citation1980), Pistia stratiotes (Aliotta et al. Citation1991; Pollio et al. Citation1993), and Eichhornia crassipes Solms (Yu et al. Citation1991; Sharma et al. Citation1996) were shown to contain algal growth-inhibiting bioactive compounds. Hong et al. (Citation2010) reported that methanol extracts from giant reed, Arundo donax L. inhibited the growth of M. aeruginosa due to gramine (0.47 mg L−1 of EC50).
4.4. Possibility as a restoration technique
Aquatic macrophyte-derived allelochemicals may not be only excreted continuously and metabolized by aquatic bacteria, but also accumulate in the water column to contribute to the pool of organic matter (i.e. humic substances). Although extracts from both species (P. australis and T. angustifolia) used in this study showed the ability to inhibit the growth of M. aeruginosa at high DOC concentration, other aspects of using macrophyte-derived allelopathic compounds must be considered before recommending the use of macrophyte-derived compounds as a lake restoration method. The combined effect of a variety of macrophyte-derived allelochemicals depends on many factors, such as the selection of macrophytes species and life stage types, decomposition time, target algae, and field conditions in terms of dominated macrophytes and residence time (e.g. Zuo et al. Citation2016). Also, since cyanobacterial toxins (i.e. microcystin-LR) released from M. aeruginosa might affect the growth of macrophyes (Pflugmacher et al. Citation2001; Máthé et al. Citation2007), their interaction should be considered.
5. Conclusion
The results of this study showed markedly inhibitory effects of extracts from decomposing reed (P. australis) and cattail (T. angustifolia), especially for fresh plant tissue, on the growth of a nuisance cyanobacteria (M. aeruginosa), indicating that the chemical composition and production of allelochemicals depends on the decomposition status of macrophytes and the humification of materials extracted. The 100-day extracts of fresh cattail showed the highest inhibition effect, and, however, dead tissue stimulated the growth of M. aeruginosa at the highest extract DOC concentration at long-term decomposition times. Also, the temporal pattern in aromaticity likely differed between fresh and dead types, suggesting that some chemical characteristics of the plant extracts differ between fresh and dead tissue during the time-course of decomposition. Therefore, we suggest that the decomposition stage of decaying macrophytes, as well as macrophyte species, may be a factor in determining whether allelochemicals naturally derived from macrophytes might be applied as an environment-friendly restoration technique in freshwater ecosystems.
Acknowledgments
We thank Dr. Jeffrey S. Owen for his valuable review.
Disclosure statement
No potential conflict of interest was reported by the author(s).
Additional information
Funding
Notes on contributors
Phil-Goo Kang
Phil-Goo Kang is a senior researcher in National Institute of Environmental Research, where he has worked in the limnological survey in lakes and the best available techniques in industrial sectors.
Jiyoung Hong
Jiyoung Hong is a researcher in National Institute of Environmental Research, where she has worked in the water quality monitoring system.
Eunseok Kim
Eunseok Kim is a researcher in National Institute of Environmental Research, where he has worked in the best available techniques in industrial sectors.
Bomchul Kim
Bomchul Kim is a professor at Kangwon National University, where he has taught in the limnology and aquatic ecosystem with particular emphasis on Lake Soyang, Korea.
References
- Aliotta G, Greca MD, Monaco P, Pinto G, Pollio A, Previtera L. 1996. Potential allelochemicals from aquatic weeds: Their action on microalgae. In: Narwal SS, Tauro P, editors. Allelopathy: Field observations and methodology. Jodhpur: Scientific Publishers.. p. 243–254.
- Aliotta G, Monaco P, Pinto G, Pollio A, Previtera L. 1991. Potential allelochemicals from Pistia stratiotes L. J Chem Ecol. 17(11):2223–2234.
- Amorim CA, Moura-Falcão RH, Valença CR, Souza VR, Moura A. 2019. Allelopathic effects of the aquatic macrophyte Ceratophyllum demersum L. on phytoplankton species: contrasting effects between cyanobacteria and chlorphytes. Acta Limnol Bras. 31:e21.
- Anthoni U, Christophersen C, Madsen J, Wium-Andersen S, Jacobsen N. 1980. Biologically active sulphur compounds from the green alga Chara globularis. Phytochem. 19(6):1228–1229.
- Buchsbaum R, Valiela I, Swain T, Dzierzeski M, Allen S. 1991. Available and refractory nitrogen in detritus of coastal vascular plants and macroalgae. Mar Ecol Prog Ser. 72:131–143.
- Chen JZ, Zhang HY, Han JP, Ye JY, Liu ZL. 2012. The influence of aquatic macrophytes on Microcystis aeruginosa growth. Ecol Eng. 42:130–133.
- Gao YN, Dong J, Fu QQ, Wang YP, Chen C, Li JH, Li R, Zhou CJ. 2017. Allelopathic effects of submerged macrophytes on phytoplankton. Allelopath J. 40(1):01–22.
- Gross EM. 2003. Allelopathy of aquatic autotrophs. Crit Rev Plant Sci. 22(3-4):313–319.
- Gross EM, Hilt S, Lombardo P, Mulderij G. 2007. Searching for allelopathic effects of submerged macrophytes on phytoplankton-state of art and open questions. Hydrobiologia. 584(1):77–88.
- Gross EM, Sutfeld R. 1994. Polyphenols with algicidal activity in the submerged macrophyte Myriophyllum spicatum L. Acta Hortic. 381(381):710–716.
- Hong Y, Hu HY, Sakoda A, Sagehashi M. 2010. Isolation and characterization of antialgal allelochemicals from Arundo donax L. Allelopath J. 25(2):357–368.
- Hong Y, Hu HY, Xie X, Li FM. 2008. Responses of enzymatic antioxidants and non-enzymatic antioxidants in the cyanobacterium Microcystis aeruginosa to the allelochemical ethyl 2-methyl acetoacetate (EMA) isolated from reed (Phragmites communis). J Plant Physiol. 165(12):1264–1273.
- Jeppesen E, Søndergaard M, Jensen JP, Mortensen E, Hansen A-M. 1998. Cascading trophic interactions from fish to bacteria and nutrients after reduced sewage loading: an 18-year study of a shallow hypertrophic lake. Ecosystems. 1(3):250–267.
- Kalbitz K, Schmerwitz J, Schwesig D, Matzner E. 2003. Biodegradation of soil-derived dissolved organic matter as related to its properties. Geoderma. 113(3-4):273–291.
- Kang P, Kim BC, Mitchell MJ. 2017. Effects of rice and rye straw extracts on the growth of a cyanobacterium, Microcystis aeruginosa. Paddy Water Environ. 15(3):617–623.
- Kang P, Mitchell MJ. 2013. Bioavailability and size-fraction of dissolved organic carbon, nitrogen, and sulfur at the Arbutus Lake watershed, Adirondack Mountains, NY. Biogeochemistry. 115(1-3):213–234.
- Kim B, Wetzel RG. 1993. The effect of dissolved humic substances on the alkaline phosphatase and the growth of microalgae. Int Ver Theor Angew Limnol Verh. 25(1):129–132.
- Leu E, Krieger-Liszkay A, Goussias CH, Gross EM. 2002. Polyphenolic allelochemicals from the aquatic angiosperm Myriophyllum spicatum inhibit photosystem II. Plant Physiol. 130(4):2011–2018.
- Li FM, Hu HY. 2005. Isolation and Characterization of a Novel Antialgal Allelochemical from Phragmites communis. Appl Environ Microbiol. 71(11):6545–6553.
- Li FM, Hu HY, Chong YX, Men YJ, Guo MT. 2007. Effects of allelochemical EMA isolated from Phragmites communis on algal cell membrane lipid and ultrastructure. J Environ Sci Chin. 28(7):1534–1538.
- Macioszek B, Szczukocki D, Dziesiec J. 2010. Inhibition of the growth of Microcystis by phenolic allelochemicals from aquatic macrophytes or decomposed barley straw. In: Pawlowski L, Dudzinska MR, Pawlowski A, editors, Environmental Engineering III. Boca Raton (FL): CRC Press. p. 485–489.
- Máthé C, M-Hamvas M, Vasas G, Surányi G, Bácsi I, Beyer D, Tóth S, Tímár M, Borbély G. 2007. Microcystin-LR, a cyanobacterial toxin, induces growth inhibition and histological alterations in common reed (Phragmites australis) plants regenerated from embryogenic calli. New Phytol. 176(4):824–835.
- Moss B. 1972. The influence of environmental factors on the distribution of freshwater algae: An experimental study. I. Introduction and the influence of calcium concentration. J Ecol. 60(3):917–932.
- Mulderij G, Mooij WM, Smolders AJP, Van Donk E. 2005. Allelopathic inhibition of phytoplankton by exudates from Stratiotes aloides. Aquat Bot. 82(4):284–296.
- Nakai S, Hosomi M, Okada M, Murakami A. 1996. Control of algal growth by macrophytes and macrophyte-extracted bioactive compounds. Water Sci Technol. 34(7-8):227–235.
- Newman JR, Barrett P. 1993. Control of Microcystis aeruginosa by decomposing barley straw. J Aquat Plant Manag. 31:203–206.
- Parks JM, Rice EL. 1969. Effects of certain plants of old-field succession on the growth of blue-green algae. Bull Torrey Bot Club. 96(3):345–360.
- Pflugmacher S, Wiegand C, Beattie KA, Krause E, Steinberg CEW, Codd GA. 2001. Uptake, effects and metabolism of cyanobacterial toxins in the emergent reed plant Phragmites australis. Environ Toxicol Chem. 20(4):846–852.
- Planas D, Sarhan F, Dube L, Godmaire H, Cadieux C. 1981. Ecological significance of phenolic compounds of Myriophyllum spicatum. Verh Int Ver Limnol. 21(3):1492–1496.
- Pollio A, Pinto G, Ligrone R, Aliotta G. 1993. Effects of the potential allelochemical α-asarone on growth, physiology and ultrastructure of two unicellular green algae. J Appl Phycol. 5(4):395–403.
- Saito K, Matsumoto M, Sekine T, Murakoshi I, Morisaki N, Iwasaki S. 1989. Inhibitory substances from Myriophyllum brasilence on growth of blue-green algae. J Nat Prod. 52(6):1221–1226.
- Schanz F, Zahler U. 1981. Prediction of algal growth in batch cultures. Schweiz Z Hydrol. 43(1):103–113.
- Sharma A, Gupta MK, Singhal PK. 1996. Toxic effects of leachate of water hyacinth decay on the growth of Scenedesmus obliquus (Chlorophyta). Water Res. 30(10):2281–2286.
- Tazart Z, Douma M, Tebaa L, Loukidi M. 2019. Use of macrophytes allelopathy in the biocontrol of harmful Microcystis aeruginosa blooms. Water Supply. 19(1):245–253.
- Tebaa L, Douma M, Tazart Z, Manaut N, Mouhri KH, Loukidi M. 2018. Assessment of the potentially algicidal effects of Thymus satureioides Coss. and Artemisia herba alba L. against Microcystis aeruginosa. Appl Ecol Env Res. 16(1):903–912.
- Thurman EM. 1985. Organic geochemistry of natural waters. Dordrecht, The Netherlands: Martinus Nijhoff/Dr W. Junk Publishers. p. 51.
- Wang HQ, Liang F, Qiao N, Dong JX, Zhang LY, Guo YF. 2014. Chemical composition of volatile oil from two emergent plants and their algae inhibition activity. Pol J Environ Studies. 23(6):2371–2374.
- Wang HQ, Zhang LY. 2017. Allelopathic activity of ethyl acetate extracts from typical emergent plants against Microcystis aeruginosa Kütz. Bangladesh J Bot. 46(3):1025–1029.
- Welch IM, Barrett PRF, Gibson MT, Ridge I. 1990. Barley straw as an inhibitor of algal growth I: studies in the Chesterfield Canal. J Appl Phycol. 2(3):231–239.
- Wen J, Sheng H, Hao C, Yunguo L, Luhua J, Quan H, Zhili Y. 2017. Allelochemicals extracted from Eleocharis dulcis and their inhibitory effects on Microcystis aeruginosa. J Chem Eng Process Technol. 09(02):377.
- Yamane AN, Okada M, Sudo R. 1984. The growth inhibition of planktonic algae due to surfactants used in washing agents. Water Res. 18(9):1101–1105.
- Yu S, Sun W, Yu Z. 1991. Detection of antialgal compounds of water hyacinth. In: Bioindicators and Environmental Management. London/Tokyo: Academic Press. p. 255–262.
- Zhou L, Chen G, Cui N, Pan Q, Song X, Zou G. 2019. Allelopathic effects on Microcystis aeruginosa and allelochemical identification in the cuture solutions of typical artificial floating-bed plants. Bull Environ Contam Toxicol. 102(1):115–121.
- Zuo SP, Zhou S, Ye L, Ma S. 2016. Synergistic and antagonistic interactions among five allelochemicals with antialgal effects on bloom-forming Microcystis aeruginosa. Ecol Eng. 97:486–492.