
 ?Mathematical formulae have been encoded as MathML and are displayed in this HTML version using MathJax in order to improve their display. Uncheck the box to turn MathJax off. This feature requires Javascript. Click on a formula to zoom.
Abstract
The use of freshwater for human consumption and agriculture has resulted in many wetland ecosystems being some of the most seriously impacted ecosystems in the world. In attempts to rehabilitate wetland ecosystems environmental flows are used to restore parts of the hydrological regime altered by human water use. The use of environmental water intends to improve ecosystem health, but frequently aims to have specific outcomes for populations of higher-order consumers such as iconic fish and bird species. To date, research and monitoring has mainly focused on understanding ‘flow-ecology’ relationships, without investigating the mechanisms underlying them. We sought to understand the importance of different basal food sources to the growth of the endangered Murray cod in temporary wetland systems using fatty acid biomarkers. We flooded replicate mesocosms with two different wetland soils to produce sufficient zooplankton prey to sustain and grow Murray cod larvae for approximately 2 weeks. The fatty acid profiles of Murray cod and percentages of different biomarkers were compared at the start and finish of the experiment and our results suggest that the most important basal food source is green algae. However, the biomarkers of diatoms, cyanobacteria and bacteria also increased and differed between wetlands with different hydrological regimes. It is unclear if our results can be extended to other wetland systems and we encourage further research both into the relationship between length of wetland flooding and invertebrate densities in other systems. We also encourage research into the mechanistic pathways in which green algae carbon is transferred through food webs to higher order consumers in wetland systems to help generalise our results to other wetlands and support the management of wetlands through the timing and duration of flooding from environmental water.
1. Introduction
The increased demand for freshwater for human consumption and agriculture over the last century has resulted in many wetland ecosystems being some of the most seriously impacted environs in the world (Lemly et al. Citation2000; Millennium Ecosystem Assessment Citation2005; Vörösmarty et al. Citation2010). In the Murray–Darling Basin in South-eastern Australia, the ecological impacts of water resource development and the increase in agricultural production have become acute (Kingsford Citation2000; Jenkins et al. Citation2005; Murray-Darling Basin Authority Citation2011a). The level of water use has proved to be unsustainable, both in meeting the human demands for irrigated agriculture and domestic supply, and for the ecological health of rivers and floodplain wetlands (Kingsford Citation2000; Arthington and Pusey Citation2003; Murray-Darling Basin Authority Citation2011b; Docker and Robinson Citation2014). In response, a program of water reform in the Murray-Darling Basin to deliver water to instream channels and wetlands through environmental flows has been developed through the integration of multiple governance layers (Docker and Robinson Citation2014). Increasing the share of environmental water and improving environmental water management are central elements of this reform (Murray-Darling Basin Authority Citation2011a; Docker and Robinson Citation2014). However, research and monitoring are required to assess both how water should be delivered to highly valued ecosystems and animals and the processes underlying any potential benefits.
Nutrition is the supply of materials (food) required by cells and therefore organisms and cells to stay alive. The nutritional quality of a food source to a consumer depends on what materials and compounds the food source has that the consumer cannot synthesise themselves. For example, the freshwater plankter Daphnia thrives on a mixed diet of bacteria and algae (Freese and Martin-Creuzburg Citation2013). Bacteria is thought to provide phosphorus as they have a high phosphorus to carbon ratio but algae provide polyunsaturated fatty acids and sterols which are important components of tissue membranes and metabolic precursors for many bioactive molecules (Brett and Muller-Navarra Citation1997; Desvilettes et al. Citation1997; Vadstein Citation2000; Martin-Creuzburg et al. Citation2007). Elemental stoichiometry (ES), particularly the ratio of carbon to nitrogen (C:N) can also used to assess food quality, the greater the C:N the lower the quality food (Cruz-Rivera and Hay Citation2000; Sullivan et al. Citation2014). Assessment of the relative importance of basal food sources to higher order consumers and trophic dynamics can be achieved with a variety of methods but the most common in freshwater food-web studies are gut contents analysis (GCA) and fatty acid profiling (FAP). Fatty acids (FA) are a group of compounds that comprise the majority of lipids found in all organisms. FA profiles can be used to characterise resources consumed by freshwater biota because FAs are not generally degraded and retain their basic form in consumer tissues (Heintz et al. Citation2004; Budge et al. Citation2006). Each method has inherent strengths or limitations that affect their suitability for particular investigations (Bromaghin et al. Citation2017).
Gut content analysis is relatively inexpensive so moderate to large sample sizes can be analysed and taxa in the diet can be identified (Mantel et al. Citation2004; Li and Dudgeon Citation2008). However, GCA only provides information on what the animal has eaten over last few meals and differential digestion among taxa may result in biased results. In contrast, FAP also has the advantage of integrating diet over weeks to months but can only be used to characterise resources consumed by freshwater biota when sources have distinct FA compositions (Traugott et al. Citation2013). FAP is particularly valuable when used to assess the relative quality of food sources. Certain fatty acids are essential for consumer health and in many cases cannot be synthesised de novo by the consumer and therefore must be obtained in the diet (Jardine et al. Citation2015). FAP can identify the presence and relative abundance of essential fatty acids available in the diet. Fatty acid composition of prey is influenced by the nature of basal carbon resources (Brett et al. Citation2017), which may in turn be influenced by local hydrology. Used together, these methods can provide insight into the origin, transfer and nutritional value of basal resources from primary sources through to higher-order consumers.
Murray cod (Maccullochella peelii Mitchell, 1838) is the largest exclusively freshwater fish in Australia, its distribution is confined to the Murray-Darling Basin. Its conservation status is considered vulnerable by Australian authorities (Australian Society for Fish Biology Citation2016; Department of Agriculture, Water and the Environment Citation2018). Due to its conservation status populations of this species are often the target for the delivery of environmental water (Tonkin et al. Citation2017). However, the relationships between environmental water, basal resources and trophic pathways to support Murray cod populations is unknown. Murray cod diet consists of aquatic insects, fish, macrocrustaceans and molluscs (Harris and Rowland Citation1996; Baumgartner Citation2007). The natural diet of Murray cod larvae consists mainly of macrotrichid cladocerans and chironomid larvae (Kaminskas and Humphries Citation2009), while larvae grown in aquaculture mainly consume cladocerans, copepods and chironomid larvae (Ingram and De Silva Citation2007). Murray cod larvae hatch in spring, stay near their nesting site for approximately a week, disperse from the nest site by drifting in river currents at night, and continue this behaviour around four to seven days. During this dispersal process, larvae simultaneously absorb the remainder of their yolk sac and begin to feed (King Citation2002; Humphries Citation2005). Natural mortality rates are unknown but are approximately 20% in aquaculture situations (McLellan, pers. comm.). Low mortality, its availability from aquaculture facilities (Allen Citation1989) and feeding while on egg sac makes this species an ideal candidate for experimentally exploring effects of hydrology on basal food resources and transfer to support fish recruitment food web mesocosm studies.
Environmental flows are used as a management tool to restore parts of the hydrological regime altered by human water use, to rehabilitate the environment (Arthington Citation2012). The commonly stated aim for delivery water for the environment is to restore overall ecosystem health, but actual targets are frequently expressed in terms of population level outcomes in higher-order consumers such as iconic fish and bird species (Gawne et al. Citation2014). Research and monitoring to date has focused on understanding these species focused ‘flow-ecology’ relationships, without necessarily investigating the underlying mechanisms driving change (Rolls et al. Citation2017). The production of basal energy and its transfer through foodwebs is a process fundamental to the success of higher-order consumers (Lowe et al. Citation2006). However, basal energy sources, their nutritional quality and availability to consumers is likely to vary in time and space across wetland complexes due to differences in local hydrology, vegetation and water quality (Brock et al. Citation2005; Kelleway et al. Citation2010). Cyanobacteria, phytoplankton, green algae and biofilm availability can be altered both directly, and indirectly via nutrient inputs, during environmental flows (Sheldon and Walker Citation1997; Ryder et al. Citation2006; Williamson et al. Citation2018). A better understanding of the interaction between hydrological regimes, trophic dynamics and higher-order consumers, would allow a more thorough process-based evaluation of environmental flow programs (Robson et al. Citation2017).
In this study our objectives were to (1) identify the importance of different basal food sources to the growth of Murray cod and if this differed between wetlands with different hydrological regimes. (2) If any differences in basal food sources would affect the composition and nutritional value of prey items and therefore the growth of Murray cod.
2. Methods
2.1. Study wetlands
The Gwydir wetlands are located in the Gwydir catchment, part of the Murray-Darling Basin in northwest NSW, Australia (). The terminal wetlands form part of the Gwydir River (catchment area of 25,900 km2), which flows from the New England Plateau in the east to the Barwon River at Collarenebri in the west (Environment Climate Change and Water NSW Citation2011). All major tributaries join the Gwydir River upstream of Moree, while downstream the channels form an inland delta of extensive floodplains. The river divides into two floodplains comprising various floodplain vegetation communities, the Gingham Channel to the north and the Gwydir Channel to the south. The principal land use on floodplain and wetlands is private grazing and cropping and the area experiences highly irregular flooding regimes. In all but the largest floods, flows are held in the wetlands and floodplain.
Figure 1. Location of study area.
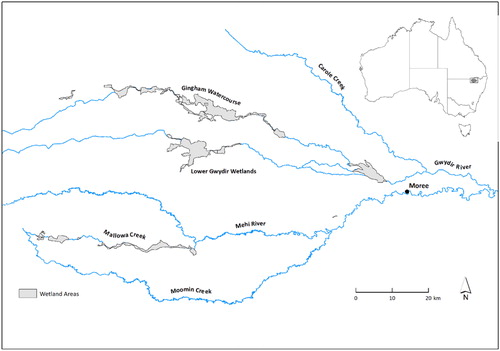
The Gwydir River system is highly regulated by an extensive series of dams, weirs and diversion channels. Flows into the wetlands are largely regulated by the largest of these, Copeton Dam upstream of Moree. Artificial watering of the wetlands occurs via environmental flows that are released from Copeton. The volumes and timing of the artificial flows is determined by the New South Wales and Commonwealth governments under the direction of the Murray-Darling Basin Authority Basin Plan’s environmental watering plan (Murray-Darling Basin Authority Citation2014).
We chose one site in each of two wetland systems the Bunnor property on the Gingham watercourse and Old Dromana (OD) property on the Gwydir watercourse (29°16′S 149°21′E and 29°20′S 149°20′E, respectively). The vegetation on the Bunnor and OD sites is recorded as being dominated by water couch marsh grassland with areas of marsh club rush (Bowen and Simpson Citation2010; Environment Climate Change and Water NSW Citation2011; Southwell et al. Citation2015). Since the stabilisation of the Raft, a natural accumulation of felled timber and sediments which effectively dams the river approximately 20 km west of Moree, more water is naturally diverted into the Gingham channel (Pietsch Citation2006; Environment Climate Change and Water NSW Citation2011), in which channel depth and width and estimated bankfull discharge are smaller than on the Gwydir watercourse (Department of Water and Energy Citation2007). This suggests that in recent times, the Bunnor wetland complex would flood more frequently than the OD wetland, as evidenced by the recent establishment of red gum woodlands in a newly created floodout area in the Gingham watercourse (Environment Climate Change and Water NSW Citation2011).
2.2. Mesocosms set up
Dry wetland sediment to a depth of approximately 10 mm was collected from each site. Sediment was put through a 10 mm mechanical sieve to separate soil from roots and vegetation. Twelve 500 L mesocosms were placed in an open-ended poly tunnel covered with white polyethylene which allowed enough ambient light for algae and vegetation growth. The open ends allowed for colonisation of the mesocosms by aerial colonising invertebrates such as Chironomidae. The mesocosms were filled to a depth of 300 mm with potable water, allowed to stand for three days to dechlorinate and maintained at that depth for the remainder of the experiment. Ten kilograms of sediment from each wetland was placed in each of six 500 L mesocosms on the third day. The mesocosms had a basal surface area of 0.78 m2 resulting in a depth of sediment of approximately 10 mm. The mesocosms were gently aerated through the course of the experiment. The mesocosms were allowed to stand for 35 days prior to the introduction of Murray cod larvae (8 days old and sourced from the Department of Primary Industry Fisheries’ hatchery at Narrandera), as a pilot study showed that this was likely to produce the diversity and biomass of invertebrates to sustain fish larvae. Individual shield shrimp (Notostraca: Triops australiensis) were removed from the containers when observed, following Boulton and Lloyd (Citation1992) and Growns et al. (Citation2020), because either their activity within the mesocosms or their feeding behaviour reduced the populations of other invertebrates.
2.3. Sampling and processing of biota
Thirty larval point of feeding Murray cod were anesthetised, measured for standard length and weighed prior to deployment of fish to the mesocosms. Fifteen randomly chosen point of feeding Murray cod larvae were introduced to each mesocosm and left for 13 days. Immediately prior to the introduction of Murray cod into the individual tanks planktonic and benthic invertebrates were sampled to provide estimates of their abundance and assemblage structure. Zooplankton were sampled by haphazardly taking five separate 200 mL aliquots of mesocosm water from each tank, combined, preserved in ethanol and stained with rose Bengal. Benthic invertebrates were sampled by taking one core (50 mm diameter × 120 mm long with 250 mL volume) for each tank using the method of King (Citation2004), put through a 250 µm sieve, preserved in ethanol and stained with rose Bengal. On day 13 invertebrate plankton and benthos were again sampled from each mesocosm using the same methods. Additional plankton and benthos were collected using a 400 µm net to provide enough material for tissue analyses from each mesocosm prior to them being drained to catch the surviving Murray cod larvae. However, not enough benthic invertebrate tissue material was able to be collected for these analyses. Following the draining of the mesocosms, organic components of the sediments were collected by elutriation with water and passed through a series of sieves to obtain coarse particulate organic matter (CPOM; 400–250 µm), fine particulate organic matter (FPOM; 250–125 µm) and very fine particulate organic matter (VFPOM; 125–63 µm).
Captured larvae were anesthetised, measured for standard length, weighed and their entire alimentary canal removed and preserved in ethanol for GCA. Plankton and benthos samples were identified to Genus for clam shrimp, shield shrimp and snails (Spinicaudata, Notostraca and Gastropoda, respectively), Family for true flies (Diptera) and water-fleas (Cladocera), Order for copepods (Copepoda), Class for seed shrimp (Ostracoda) and Phylum for roundworms (Nematoda) and rotifers (Rotifera).
2.4. Gut contents analysis
The contents of the alimentary canal of each fish were spread out on a small petri dish and examined under a binocular microscope. All taxa were counted and identified to the taxonomic level stated above, with the exception of Macrothricidae and Daphniidae, which were pooled as most of them could not be distinguished due to partial digestion of their exoskeletons.
2.5. Tissue analyses
C and N content were analysed for fish, zooplankton and the three organic sediment fractions using continuous flow isotope ratio mass spectrometery. Not enough tissue was collected for analysis of benthic fauna. Samples for C:N assessment were prepared by drying at 40 °C till constant weight and grinding to a powder that passed through a 500 µm sieve.
Fatty acid profiling followed the methods used by Conlan et al. (Citation2017). Briefly, lipid was extracted from dry samples soaked dichloromethane: methanol (CH2Cl2:CH3OH) and quantified gravimetrically on a 4-figure balance. Fatty acids were extracted following lipid class analysis determined using an Iatroscan MK 6 s thin layer chromatography-flame ionisation detector. Following extraction, FA were esterified into methyl esters using the acid catalysed methylation method (Christie Citation2003). Gas chromatography was then used to identify the FA methyl esters relative to known external standards. The percentage of each species of FA was calculated for each sample and also the total percentages of n-3 and n-6 poly unsaturated fatty acids.
To determine the primary carbon source utilised by Murray cod larvae at the end of the experiment we used the following individual fatty acids as biomarkers, myristic acid (14:0) for cyanobacteria (Carpenter et al. Citation1997; Kelly and Scheibling Citation2012), pentadecylic acid (15:0) and margaric acid (17:0) for bacteria (Dalsgaard et al. Citation2003; Alfaro et al. Citation2006), oleic acid (18:1n-9) for fungi (Vestal and White Citation1989; Dalsgaard et al. Citation2003; Alfaro et al. Citation2006; Willers et al. Citation2015), alpha-linolenic acid (18:3n-3) for green algae (D'Souza and Loneragan Citation1999; Kelly and Scheibling Citation2012) and eicosapentaenoic acid (20:5n-3) for diatoms (Volkman et al. Citation1989).
2.6. Fish dietary preference
We used the Manly-Chesson index α (Manly Citation1974; Chesson Citation1978, Citation1983) to assess prey selection. The equation for the Manly-Chesson index is as follows:
where ri is the relative abundance of prey taxon ‘i’ found in the larval diet, pi is the relative abundance of the same prey item found in the environment and m is the number of food items. A value less than 1/m indicates a prey group that was consumed disproportionately less than its relative abundance in the environment. Values approaching 1/m indicate that a prey taxon was consumed in direct proportion to its abundance, and values greater than 1/m indicate a prey group was consumed disproportionately more than its relative abundance in the resource base, with values near 1.0 indicating a strong selection of a prey item or ‘preference’. Separate calculations were performed for the plankton and benthic invertebrates in each wetland type.
2.7. Statistical analyses
The influence of wetland on larval fish length, with mesocosm nested within sediment type, was tested using Permutational Analysis of Variance (PERMANOVA) (Anderson Citation2001) in the PERMANOVA + for PRIMER software (Anderson et al. Citation2008). Similarly, the influence of wetland and zooplankton and benthic invertebrate densities on Murray cod larval survivorship, expressed as a percentage of the 15 larvae alive at the end of 13 days was tested with PERMANOVA. Invertebrate densities for each mesocosm were assumed to be the average of the number of animals collected at the start of the introduction of fish and at the end of 13 days for each habitat type. Euclidean distance was used to form the similarity matrices for analyses. Significant relationships between the main factors and interactions were tested using 9999 randomisations. The taxa responsible for the separation of significantly different groups were tested using similarity percentages (SIMPER) in the PRIMER software. The consistency ratio (the ratio of the average to standard deviation of the dissimilarities between groups) was calculated for each species that had a greater than 3% contribution to the average dissimilarity. The effect of wetland, time (introduction of fish and end of the experiment) and habitat type (plankton or benthos) on invertebrate assemblage structure was tested using PERMANOVA, with Euclidean distance and 9999 randomisations. Because different methods have been used to collect the plankton and benthos to compare them directly the abundances of each taxon were ranked in descending order within each habitat type and Kendall rank correlation used to form the dissimilarity matrices. Patterns of differences in invertebrate assemblages identified by PERMANOVA were presented diagrammatically using non-metric multidimensional scaling (NMDS) using 50 randomised starts (Clarke Citation1993).
3. Results
3.1. Invertebrates
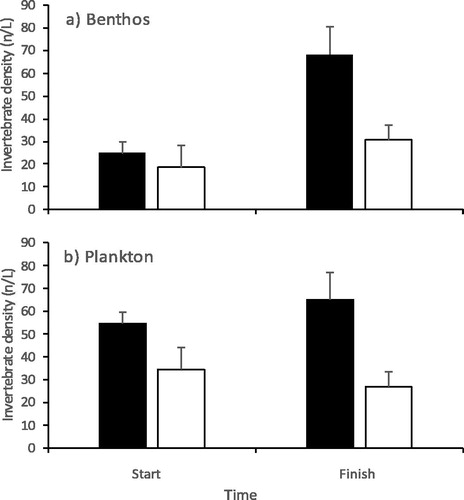
A total of 1948 invertebrates from ten taxa were collected in the planktonic and benthic samples. Macrothricidae cladocerans accounted for the majority of animals (53%) followed by Ostracoda (27%), Chironomidae (9%), Daphniidae (5%) and Chydoridae (3%). The remaining taxa Conchostraca, Harpacticoid, Nematoda, rotifer and snails formed one or less percent of the populations. The ranked abundance of benthic invertebrates differed between wetlands and over time (F1,20 = 10.8 and 6.6; p = 0.017 and 0.004, respectively) with no significant interaction. The Bunnor mesocosms had more invertebrates than the OD mesocosms and abundances increased over time (). The total abundance of planktonic invertebrates differed between the wetland mesocosms (F1,20 = 9.5; p = 0.006) with no significant time effects and no interaction. The Bunnor mesocosms had on average more invertebrates than the OD mesocosms which was consistent over time ().
Figure 2. Mean invertebrate densities (± 1 S.E.) in (a) benthos and (b) plankton. Black columns denote Bunnor mesocosms and white Old Dromana.
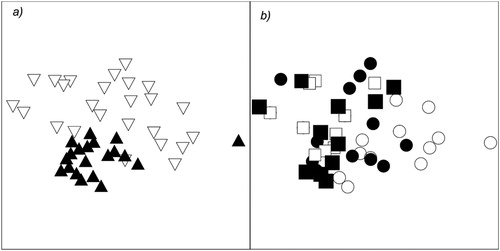
Invertebrate assemblage structure differed between wetlands (F1,40 = 9.8; p = 0.001), habitats (F1,40 = 8.9; p = 0.001) and there was a significant interaction between habitats and time (F1,40 = 3.5; p = 0.004). The other sources of variation in the PERMANOVA model were not significant, suggesting that the differing change over time within habitats (as observed by the habitat by time interaction) was consistent regardless of wetland type. Pairwise tests indicate that there was no significant difference between planktonic and benthic samples at the start of the experiment but these two habitats differed at the end (t1,20 = 3.2; p = 0.001). In addition, the was no significant difference between the plankton assemblages at the start and end of the experiment but the benthos differed between the two sampling occasions (t1,20 = 2.1; p = 0.001). This suggests that the significant habitat by time interaction was driven by the benthic assemblage structure becoming more dissimilar to the other habitat and times at the end of the experiment. The Bunnor samples clearly separate from the OD samples in ordination space (). The distance between the benthic samples and the other samples increases at the end of the experiment ().
Figure 3. MDS ordination of invertebrate assemblages. (a) Coded for wetland type (black triangles = Bunnor samples; white triangles = OD samples. (b) The same ordination coded for different habitats at the start and end of the experiment (circles = benthos; squares = plankton; black shapes = start; white shapes = end).
Five taxa contributed to the differences between wetlands with Daphniidae, Ostracoda, Chydoridae and Macrothricidae all ranking higher in the Bunnor mesocosms (). Only Chironomidae ranked higher in the OD mesocosms. Macrothricidae, Nematodes and Chydoridae all ranked lower in the benthos at the end of the experiment compared with Chironomidae, Ostracoda and snails increasing in rank. Daphniidae, Chydoridae, Ostracoda and Macrothricidae all had greater ranks in the plankton compared with the benthos at the end of the experiment. Only Chironomidae ranked more highly in the benthos.
Table 1. Average ranks of taxa contributing to differences between various groups of samples SIMPER.
3.2. Murray cod larvae
Murray cod larvae introduced to the mesocosms had a mean weight of 7.9 ± 0.2 µg (1 S.E.) and were 10.9 ± 0.1 mm standard length. Over the 13 days they increased in mean weight to 40 ± 0.9 µg and mean length to 14.4 ± 0.1 mm. There was no significant difference in either mean weight or length between the wetlands, however, there was significant differences in both mean weight and length among the OD mesocosms (F1,10 = 11.0, p = 0.0001).
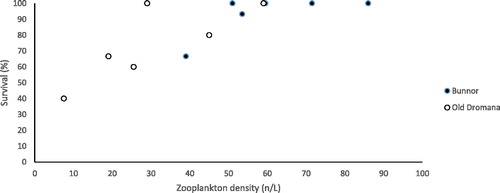
Survival of larvae differed between wetland mesocosms (F1,8 = 5.6, p = 0.043) with mean survival greater in Bunnor (). Survival in both mesocosm types was positively related to the density of zooplankton (F1,8 = 10.3, p = 0.011) but not benthic invertebrate density (F1,8 = 0.15, p = 0.701). There was no significant interaction between mesocosm type and plankton density (F1,8 = 0.85, p = 0.407) indicating that the relationship between survival and density was similar between the wetlands.
Figure 4. Relationship between zooplankton density and Murray cod larval survival. Black circles Bunnor wetland mesocosms and white circles Old Dromana mesocosms.
A total of 885 individual invertebrates from five taxa were identified from the 135 fish gut samples. The majority were Macrothricidae/Daphniidae cladocerans (60%) followed by Chironomidae (20%), Chydoridae (13%), Ostracoda (5%) and Harpacticoida (2%). Gut contents were significantly different between wetlands (F1,10 = 15.8, p = 0.008), SIMPER indicating that Macrothricidae/Daphniidae cladocerans occurred more frequently in the Bunnor fish and Chironomidae occurred more frequently in the OD fish.
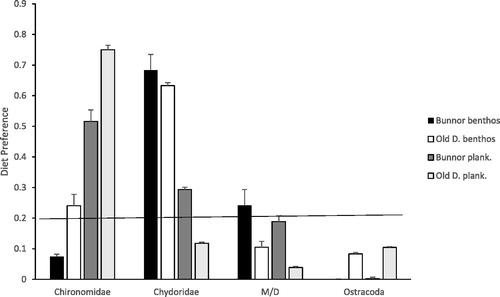
There was a significant interaction between taxa and habitat and taxa and wetland for the Manly-Chesson index α (F3,80 = 13.8, p = 0.0001 and 4.6, p = 0.005, respectively). Chironomidae appeared to be a preferred dietary item in the plankton and Chydoridae in the benthos in both wetlands (). In contrast, Macrothricidae/Daphniidae cladocerans in both habitats of the OD fish and Ostracoda in both wetlands and habitats appeared to be avoided.
Figure 5. Manly-Chesson prey selection index α, the horizontal line is the neutral value for selectiveness.
3.3. Fatty acid profiles
A total of 47 individual fatty acids were identified from the substratum fractions, zooplankton and fish (Table 2). There was a significant difference between the FAP of the different substratum fractions and biota and wetland type and a significant interaction between these factors (F > 3.4, p = 0.0001). Pairwise contrasts indicated that each of the substrate fractions and fish differed between wetlands but the FAP of zooplankton was not significantly different. PERMDISP indicated that the significant difference between substrate fractions and fish between wetlands was most likely due to the variation in FAP between replicates from OD being significantly greater than the Bunnor replicates.
The fatty acids present in greater than 10% in the Murray cod larvae at the start of the experiment included 16:0 (19.5%), 18:1n-9 (17.4%), 18:0 (10.6%), 18:2n-6 (10.6%) and 22:6n-3 (10.3%). The mean percentage of individual FAs in larvae between wetlands and compared with larvae at the start of the experiment was similar with the exception of 18:2n-6 which was absent from larvae at the end of the experiment (). The fatty acids that were greater than 10% in the zooplankton included 16:0, 18:3n-3, 18:1n-9 and 18:0. The FA greater than 10% in the Bunnor VFPOM and FPOM samples included 16:0 and 18:1n-9 and these two FA were also greater than 10% in the OD samples but so was 22:1 (isomers) as well. There were four FA greater than 10% in the Bunnor CPOM samples including 16:0, 18:1n-9, 18:3n-3 and 16:1n-7. In contrast, 16:0 was the only FA greater than 10% in the OD CPOM samples.
Table 2. Mean percentage (± 1 S.E.) of each fatty acid in substratum fractions and biota in each wetland.
3.4. Potential food source quality
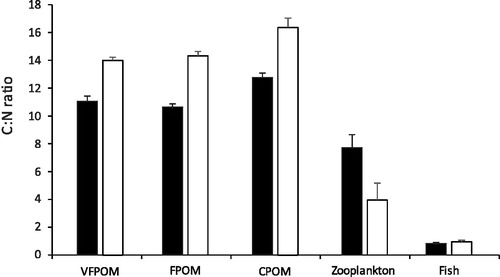
There was a significant difference in the C:N ratio between the various potential food sources and wetlands and a significant interaction between those factors (F = 265, 17 and 18, respectively, p < 0.001). Pairwise tests indicated that the mean C:N ratio of the OD substratum fractions were significantly greater than the Bunnor wetland (t > 0.48, p < 0.01) (). The higher ratio indicates that the OD substratum is of lower nutritional value than the Bunnor substratum. In contrast, there was no significant difference in the C:N ratio the zooplankton or Murray cod larvae between wetlands.
Figure 6. Mean (± 1 S.E.) carbon to nitrogen ratios in various potential food sources. Black columns are from Bunnor mesocosms and white from Old Dromana mesocosms.
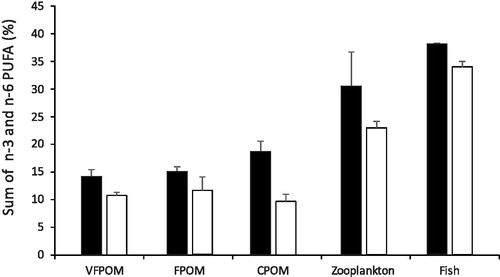
There was a significant difference between the mean total n-3 and n-6 PUFA between the various potential food sources and wetlands and no interaction (F = 65 and 20, respectively, p < 0.001). Pairwise tests indicated that the mean total PUFA of the OD substratum fractions were significantly less than the Bunnor wetland (t > 0.49, p < 0.01) (). The lower mean total indicates that the OD substratum is of lower nutritional value than the Bunnor substratum. In contrast, there was no significant difference in the mean total PUFA of the zooplankton or Murray cod larvae between wetlands.
Figure 7. Mean (± 1 S.E.) sum of n-3 and n-6 polyunsaturated fatty acids (PUFA) in various potential food sources. Black columns are from Bunnor mesocosms and white from Old Dromana mesocosms.
3.5. Biomarkers
There was a significant difference between the mean percentage of bacterial fatty acid biomarkers between different animal groups and substratum fractions and wetlands and there was a significant interaction between those factors (F > 3.9, p < 0.05). Pairwise tests indicated that the mean percentage of bacterial fatty acids was significantly greater in all the OD substratum factions and fish (t > 2.6, p < 0.01) but not for zooplankton ().
Figure 8. Mean percentage (± 1 S.E.) of fatty acid biomarkers in different substratum sizes and animal groups from Bunnor mesocosms (black columns) and Old Dromana mesocosms (white columns). Grey columns indicate the fatty acid biomarkers present in Murray cod larvae at the start of the experiment.
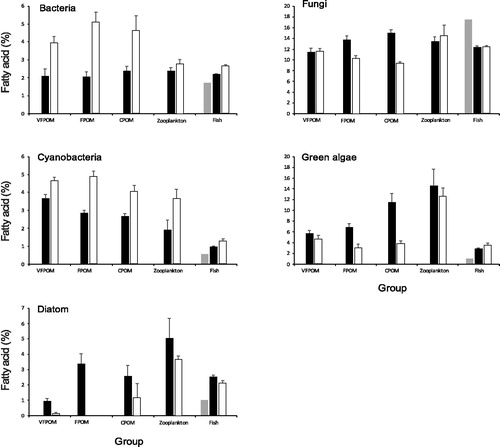
The mean percentage of the cyanobacterial fatty acid biomarker was significantly different between the invertebrates and fish and substratum fractions and wetlands, and there was a significant interaction between those factors (F > 3.9, p < 0.001). The mean percentage of the cyanobacterial fatty acid was significantly greater in all the OD substratum factions and fish (t > 2.5, p < 0.01) compared with the Bunnor wetland but there was no significant difference in the percentages for zooplankton between wetlands, even though the mean percentage is almost double in the OD wetland ().
There was a significant difference between the mean percentage of the diatom fatty acid biomarker between different animal groups and substratum fractions and wetlands (F = 11.1 and 18.4, respectively, p < 0.002) and with no significant interaction between those factors. The mean percentage of the biomarker was not significantly different between CPOM, fish and FPOM but was significantly different between all the other groups. In general, zooplankton had the greatest percentage of the biomarker and VFPOM the least (). The Bunnor substratum fractions, and animal groups all had a significantly greater percentage than the OD groups.
The mean percentage of the green algae fatty acid biomarker was significantly different between the different animal groups and substratum fractions and wetlands and there was a significant interaction between those factors (F > 4.5, p < 0.05). Pairwise tests indicated that the mean percentage of the algal indicator was significantly greater in all the Bunnor CPOM and FPOM (t > 3.4, p < 0.001) but there was no significant difference the percentages for VFPOM, zooplankton or fish between wetlands ().
There was a significant difference between the mean percentage of the fungal bacterial fatty acid biomarker between different animal groups and substratum fractions and wetlands and there was a significant interaction between those factors (F > 3.5, p < 0.05). The mean percentage of the fungal indicator was significantly greater in all the Bunnor CPOM and FPOM (t > 3.4, p < 0.001) but there was no significant difference the percentages for VFPOM, zooplankton or fish between wetlands ().
The mean percentage of each fatty acid biomarker increased in the fish from the start to the end of the experiment with the exception of the fungal indicator (). The greatest percentage increase was for green algae (308%) followed by diatoms (230%), cyanobacteria (204%) and bacteria (140%). However, the increases were greater for bacteria, cyanobacteria and green algae in the OD wetland.
4. Discussion
We demonstrated that the invertebrate assemblages differed between the two wetland sediments with contrasting hydrological regimes. The different fauna associated with different wetlands is reinforced by many other studies which suggest differences in hydrology and spatial habitat heterogeneity influence invertebrate abundances and diversity (Frisch et al. Citation2005; James et al. Citation2008; Lindholm et al. Citation2009). The main differences in the taxa between the wetlands were more Chironomidae in the OD wetland mesocosms and more Daphnidae, Ostracoda and Macrothricidae in the Bunnor wetland mesocosms. Diets of Chironomidae differ between genera but fine particulate organic matter and benthic algae are the main feeding resource of detritivores (Butakka et al. Citation2016; Ruiz et al. Citation2017). Daphnia feed on green algae, bacteria and cyanobacteria (Gophen and Geller Citation1984; Thys et al. Citation2003; Oberholster et al. Citation2006). Diets of Macrothricidae and Ostracoda remain undocumented but as they occupy as similar habitat as Daphnia their food sources should be comparable, at least in our experimental mesocosms. Given the differences in invertebrate assemblages and their differing diets it was plausible that their food value to higher order consumers would differ as well. The food value of invertebrates to higher consumers would differ between wetlands as the percentage of PUFAs was significantly greater in the Bunnor mesocosms, however, the C:N ratios were not significantly different between the mesocosms.
The survival of Murray cod larvae was greater in the wetland with prey of greater nutritional value (based on PUFAs), however, prey density was also greater in the Bunnor mesocosms. It is therefore unclear if the greater survival is explained by density of prey rather than quality. It is unknown if the nutritional value of the benthic invertebrates differed between wetlands as we did not collect enough tissue material for analyses. However, there was no significant relationship between the density of the benthos and Murray cod survival. The minimum densities of both benthic and planktonic invertebrates required to support Murray cod larval survival are unknown but King (Citation2004) suggested 250–500 individuals L−1 were required to support growth. In our experiment survival declined below 50 animals L−1 particularly in the OD mesocosms.
Murray cod larvae appeared to be selective in the prey they ate based on the Manly-Chesson index α for the different taxa. Of the prey groups planktonic Chironomidae and benthic Chydoridae appeared to be preferred in both wetland mesocosms. In contrast, Macrothricidae/Daphniidae in the OD mesocosms and all Ostracoda seemed to be avoided, although they appear in the diets of both natural and aquacultured Murray cod larvae (Ingram and De Silva Citation2007; Kaminskas and Humphries Citation2009). The feeding preferences of the cod larvae may explain the change in the benthic invertebrate assemblage structure in the mesocosms during the experiment. Kaminskas and Humphries (Citation2009) noted that the natural diet of Murray cod larvae is dominated by benthic invertebrates. However, they also state that the majority of the dietary studies of the larvae of Murray–Darling native fish under aquaculture conditions have reported a diet largely based on pelagic prey items. It is unclear why the larvae were selectively feeding in our mesocosms. It may be that the different taxa have different nutritional values but although the invertebrate assemblage structure differed between wetlands their nutritional value (in terms of their C:N ratio and percentage of PUFAs) was the same. Prey selectivity has been previously observed in Murray cod larvae and other juvenile percichthyid species (Ingram and De Silva Citation2007). The reason for prey selectivity remains unclear, although as larvae get larger, they can tackle larger prey items. However Ingram and De Silva (Citation2007) found that although bigger fish had access to a larger variety of prey they still consumed smaller prey and suggested that fish may learn to utilise familiar prey size classes even when larger prey are present (Hansen and Wahl Citation1981).
Based on the FA indicators of different potential basal food sources, the green algae biomarker showed the greatest increase in the Murray cod from the start to the end of the experiment, suggesting that it is the main basal food source. However, the cyanobacterial and diatom indicators also increased suggesting that a combination of basal food sources are important for the cod. In addition, there were differences in the increases between wetlands, suggesting that the hydrological regime of a wetland influences those sources. The importance of green algae to the mesocosm food webs is supported by the well-documented literature suggesting algal food sources are of high quality because of their high content of polyunsaturated fatty acids (Volkman et al. Citation1989; Taipale et al. Citation2012; Freese and Martin-Creuzburg Citation2013; Guo et al. Citation2016).
Our use of FA biomarkers to identify basal food sources is usual in the food web literature (Johns et al. Citation1979; Goedkoop et al. Citation2000; Falk-Petersen et al. Citation2002). However, there are some individual FA that have been ascribed to different biotic groups by different authors. For example, the FA 16:0 has been used as a biomarker separately for green algae, cyanobacteria and fungi (Vestal and White Citation1989; Kelly and Scheibling Citation2012). Biomarkers for specific species of algae are easily overlapped, such as the 18:3n6 has been simultaneously used as a marker for cyanobacteria and green algae (Meziane and Tsuchiya Citation2000; Hayakawa et al. Citation2002; de Kluijver et al. Citation2012; Xu et al. Citation2014). In addition, an individual biomarker for a specific group may not be present for environmental reasons. The FA 20:5n3 although an often consistent biomarker for diatoms is often not found in large quantities relative to other FA (Napolitano Citation1999) and may be found in lower light or nutrient concentrations (Ahlgren et al. Citation1992). Given biomarkers for individual species of plankton, aquatic and terrestrial materials are not always specific enough to identify a single source and the fact that the internal biosynthetic capabilities of most organisms have not been elucidated, some authors caution their use in food web studies (Wakeham Citation1995; Dalsgaard et al. Citation2003).
The relationship between Murray cod larval survival and zooplankton densities suggests that the timing of flooding of a wetland is important so the wetland can produce enough food for fish. The Bunnor and OD wetlands appear to produce invertebrates of sufficient nutritional value to provide adequate food for larval cod growth and that the most important basal food source is green algae but that differed between the wetlands. However, it is unclear if our results can be extended to other wetland systems and we encourage further research both into the relationship between length of wetland flooding and invertebrate densities in other systems. We also encourage research into the mechanistic pathways in which green algae carbon is transferred through food webs to higher order consumers in wetland systems to help generalise our results to other wetlands and support the management of wetlands through the timing and duration of flooding from environmental water.
Acknowledgements
Matthew McLellan and Lachie Jess from the DPI Fisheries Narrandera fish hatchery are thanked for providing and organising the transportation of the Murray cod larvae. Leanne Lisle from the University of New England (UNE) is thanked for running the analyses for carbon and nitrogen concentrations. Michael Faint from UNE is thanked for proving space in the agronomy polytunnel for the mesocosms. David Francis from Deakin University is thanked for organising the fatty acid profile analyses. Sam Lewis is thanked for assisting with the collection of wetland sediment.
Disclosure statement
No potential conflict of interest was reported by the author(s).
Additional information
Funding
Notes on contributors
Ivor Growns
Ivor Growns is a Research Fellow at the University of New England, where he has conducted research on food webs and environmental flows.
Darren Ryder
Darren Ryder is a Professor at the University of New England, where he is the leader of the Aquatic Ecology and River Restoration Research Group.
Lindsey Frost
Lindsey Frost is a Doctoral student at the University of New England where she is studying the energy flow responses to environmental water in a wetland.
References
- Ahlgren G, Gustafsson IB, Boberg M. 1992. Fatty acid content and chemical composition of freshwater microalgae. J Phycol. 28(1):37–50.
- Alfaro AC, Thomas F, Sergent L, Duxbury M. 2006. Identification of trophic interactions within an estuarine food web (northern New Zealand) using fatty acid biomarkers and stable isotopes. Estuar Coastal Shelf Sci. 70(1–2):271–286.
- Allen G. 1989. Freshwater fishes of Australia. Neptune City, NJ: TFH Publications, Inc.
- Anderson M, Gorley RN, Clarke RK. 2008. Permanova + for Primer: Guide to Software and Statistical Methods. Plymouth: Primer-E Limited.
- Anderson MJ. 2001. Permutation tests for univariate or multivariate analysis of variance and regression. Can J Fish Aquat Sci. 58(3):626–639.
- Arthington AH. 2012. Environmental flows: saving rivers in the third millennium. Berkeley: University of California Press.
- Arthington AH, Pusey BJ. 2003. Flow restoration and protection in Australian rivers. River Res Appl. 19(5–6):377–395.
- Australian Society for Fish Biology. 2016. ASFB Threatened Species Committee Report. ASFB Newslett. 46:133–144.
- Baumgartner LJ. 2007. Diet and feeding habits of predatory fishes upstream and downstream of a low-level weir. J Fish Biol. 70(3):879–894.
- Boulton AJ, Lloyd LN. 1992. Flooding frequency and invertebrate emergence from dry floodplain sediments of the river Murray. Regul Rivers: Res Manag. 7(2):137–151.
- Bowen S, Simpson S. 2010. Changes in extent and condition of floodplain wetland vegetation communities in the Gwydir Wetlands and floodplain 1996–2009. Sydney: NSW Department of Environment and Climate Change.
- Brett M, Muller-Navarra D. 1997. The role of highly unsaturated fatty acids in aquatic foodweb processes. Freshwater Biol. 38(3):483–499.
- Brett MT, Bunn SE, Chandra S, Galloway AWE, Guo F, Kainz MJ, Kankaala P, Lau DCP, Moulton TP, Power ME, et al. 2017. How important are terrestrial organic carbon inputs for secondary production in freshwater ecosystems? Freshw Biol. 62(5):833–853.
- Brock MA, Nielsen DL, Crossle K. 2005. Changes in biotic communities developing from freshwater wetland sediments under experimental salinity and water regimes. Freshwater Biol. 50(8):1376–1390.
- Bromaghin JF, Budge SM, Thiemann GW, Rode KD. 2017. Simultaneous estimation of diet composition and calibration coefficients with fatty acid signature data. Ecol Evol. 7(16):6103–6113.
- Budge SM, Iverson SJ, Koopman HN. 2006. Studying trophic ecology in marine ecosystems using fatty acids: a primer on analysis and interpretation. Mar Mammal Sci. 22(4):759–801.
- Butakka CMM, Ragonha FH, Train S, Pinha GD, Takeda AM. 2016. Chironomidae feeding habits in different habitats from a Neotropical floodplain: exploring patterns in aquatic food webs. Braz J Biol. 76(1):117–125.
- Carpenter EJ, Harvey HR, Fry B, Capone DG. 1997. Biogeochemical tracers of the marine cyanobacterium Trichodesmium. Deep Sea Res Part I. 44(1):27–38.
- Chesson J. 1978. Measuring preference in selective predation. Ecology. 59(2):211–215.
- Chesson J. 1983. The estimation and analysis of preference and its relatioship to foraging models. Ecology. 64(5):1297–1304.
- Christie W. 2003. Lipid analysis: Isolation, separation, identification and structural analysis of lipids. Bridgwater, England: Oily Press.
- Clarke KR. 1993. Non‐parametric multivariate analyses of changes in community structure. Aust Ecol. 18(1):117–143.
- Conlan JA, Rocker MM, Francis DS. 2017. A comparison of two common sample preparation techniques for lipid and fatty acid analysis in three different coral morphotypes reveals quantitative and qualitative differences. PeerJ. 5:e3645.
- Cruz-Rivera E, Hay ME. 2000. Can quantity replace quality? Food choice, compensatory feeding, and fitness of marine mesograzers. Ecology. 81(1):201–219.2.0.CO;2]
- D'Souza FML, Loneragan NR. 1999. Effects of monospecific and mixed-algae diets on survival, development and fatty acid composition of penaeid prawn (Penaeus spp.) larvae. Mar Biol. 133(4):621–633.
- Dalsgaard J, John MS, Kattner G, Müller-Navarra D, Hagen W. 2003. Fatty acid trophic markers in the pelagic marine environment. Adv Mar Biol. 46:227–318.
- de Kluijver A, Yu J, Houtekamer M, Middelburg JJ, Liu ZJL. 2012. Cyanobacteria as a carbon source for zooplankton in eutrophic Lake Taihu. Limnol Oceanogr. 57(4):1245–1254.
- Department of Agriculture, Water and the Environment. 2018. Species profile and threats database - Maccullochella peelii — Murray cod. http://www.environment.gov.au/cgi-bin/sprat/public/publicspecies.pl?taxon_id=66633.
- Department of Water and Energy. 2007. Pinneena 9.2: New South Wales Surface Water Archive. Sydney: NSW Department of Water and Energy.
- Desvilettes C, Bourdier G, Amblard C, Barth B. 1997. Use of fatty acids for the assessment of zooplankton grazing on bacteria, protozoans and microalgae. Freshw Biol. 38(3):629–637.
- Docker B, Robinson I. 2014. Environmental water management in Australia: experience from the Murray-Darling Basin. Int J Water Resour Dev. 30(1):164–177.
- Environment Climate change and Water NSW. 2011. Gwydir Wetlands Adaptive Environmental Management Plan. Sydney.
- Falk-Petersen S, Dahl TM, Scott CL, Sargent JR, Gulliksen B, Kwasniewski S, Hop H, Millar R-M. 2002. Lipid biomarkers and trophic linkages between ctenophores and copepods in Svalbard waters. Mar Ecol Prog Ser. 227:187–194.
- Freese HM, Martin-Creuzburg D. 2013. Food quality of mixed bacteria–algae diets for Daphnia magna. Hydrobiologia. 715(1):63–76.
- Frisch D, Libman BS, D'Surney SJ, Threlkeld ST. 2005. Diversity of floodplain copepods (Crustacea) modified by flooding: species richness, diapause strategies and population genetics. Arch Hydrobiol. 162(1):1–17.
- Gawne B, Roots J, Hale J, Stewardson M. 2014. Commonwealth Environmental Water Office Long–Term Intervention Monitoring Project: Basin Evaluation Plan. Report prepared for the Commonwealth Environmental Water Office by the Murray–Darling Freshwater Research Centre MDFRC Publication. 422014.
- Goedkoop W, Sonesten L, Ahlgren G, Boberg M. 2000. Fatty acids in profundal benthic invertebrates and their major food resources in Lake Erken, Sweden: seasonal variation and trophic indications. Can J Fish Aquat Sci. 57(11):2267–2279.
- Gophen M, Geller W. 1984. Filter mesh size and food particle uptake by Daphnia. Oecologia. 64(3):408–412.
- Growns I, Lewis S, Ryder D, Tsoi W, Vincent B. 2020. Patterns of invertebrate emergence and succession in flooded wetland mesocosms. Mar Freshwater Res. https://doi.org/10.1071/MF19351
- Guo F, Kainz MJ, Sheldon F, Bunn SE. 2016. The importance of high-quality algal food sources in stream food webs – current status and future perspectives. Freshw Biol. 61(6):815–831.
- Hansen MJ, Wahl DH. 1981. Selection of Small Daphnia pulex by Yellow Perch Fry in Oneida Lake, New York. Trans Am Fish Soc. 110(1):64–71.
- Harris J, Rowland S. 1996. Australian freshwater cods and basses. In McDowall RM, editors. Freshwater Fishes of South-eastern Australia. Reed Books: Chatswood; p. 150–163.
- Hayakawa K, Tsujimura S, Napolitano GE, Nakano S-i, Kumagai M, Nakajima T, Jiao C. 2002. Fatty acid composition as an indicator of physiological condition of the cyanobacterium Microcystis aeruginosa. Limnology. 3:29–35.
- Heintz RA, Nelson BD, Hudson J, Larsen M, Holland L, Wipfli M. 2004. Marine subsidies in freshwater: effects of salmon carcasses on lipid class and fatty acid composition of juvenile coho salmon. Trans Am Fish Soc. 133(3):559–567.
- Humphries P. 2005. Spawning time and early life history of Murray cod, Maccullochella peelii (Mitchell) in an Australian river. Environ Biol Fish. 72(4):393–407.
- Ingram BA, De Silva SS. 2007. Diet composition and preference of juvenile Murray cod, trout cod and Macquarie perch (Percichthyidae) reared in fertilised earthen ponds. Aquaculture. 271(1–4):260–270.
- James CS, Thoms MC, Quinn GP. 2008. Zooplankton dynamics from inundation to drying in a complex ephemeral floodplain-wetland. Aquat Sci. 70(3):259–271.
- Jardine TD, Woods R, Marshall J, Fawcetr J, Lobegeiger J, Valdez D, Kainz MJ. 2015. Reconciling the role of organic matter pathways in aquatic food webs by measuring multiple tracers in individuals. Ecology. 96(12):3257–3269.
- Jenkins KM, Boulton AJ, Ryder DS. 2005. A common parched future? Research and management of Australian Arid-zone floodplain wetlands. Hydrobiologia. 552(1):57–73.
- Johns R, Nichols P, Perry G. 1979. Fatty acid composition of ten marine algae from Australian waters. Phytochemistry. 18(5):799–802.
- Kaminskas S, Humphries P. 2009. Diet of Murray cod (Maccullochella peelii) (Mitchell) larvae in an Australian lowland river in low flow and high flow years. Hydrobiologia. 636(1):449–461.
- Kelleway J, Mazumder D, Wilson GG, Saintilan N, Knowles L, Iles J, Kobayashi T. 2010. Trophic structure of benthic resources and consumers varies across a regulated floodplain wetland. Mar Freshw Res. 61(4):430–440.
- Kelly JR, Scheibling RE. 2012. Fatty acids as dietary tracers in benthic food webs. Mar Ecol Prog Ser. 446:1–22.
- King A. 2002. Recruitment ecology of fish in Murray–Darling Basin floodplain rivers [Ph.D. Thesis]. Melbourne: Monash University.
- King AJ. 2004. Density and distribution of potential prey for larval fish in the main channel of a floodplain river: pelagic versus epibenthic meiofauna. River Res Appl. 20(8):883–897.
- Kingsford RT. 2000. Ecological impacts of dams, water diversions and river management on floodplain wetlands in Australia. Austral Ecol. 25(2):109–127.
- Lemly AD, Kingsford RT, Thompson JR. 2000. Irrigated agriculture and wildlife conservation: Conflict on a global scale. Environ Manage. 25(5):485–512.
- Li AO, Dudgeon D. 2008. Food resources of shredders and other benthic macroinvertebrates in relation to shading conditions in tropical Hong Kong streams. Freshw Biol. 53(10):2011–2025.
- Lindholm M, Hessen DO, Ramberg L. 2009. Diversity, dispersal and disturbance: cladoceran species composition in the Okavango Delta. Afr Zool. 44(1):24–35.
- Lowe WH, Likens GE, Power ME. 2006. Linking scales in stream ecology. BioScience. 56(7):591–597. 2006/07/012.0.CO;2]
- Manly B. 1974. A model for certain types of selection experiments. Biometrics. 30(2):281–294.
- Mantel SK, Salas M, Dudgeon D. 2004. Foodweb structure in a tropical Asian forest stream. J N Am Benthol Soc. 23(4):728–755.
- Martin-Creuzburg D, Westerlund SA, Hoffmann KH. 2007. Ecdysteroid levels in Daphnia magna during a molt cycle: determination by radioimmunoassay (RIA) and liquid chromatography-mass spectrometry (LC-MS). Gen Comp Endocrinol. 151(1):66–71.
- Meziane T, Tsuchiya M. 2000. Fatty acids as tracers of organic matter in the sediment and food web of a mangrove/intertidal flat ecosystem, Okinawa, Japan. Mar Ecol Prog Ser. 200:49–57.
- Millennium Ecosystem Assessment. 2005. Synthesis report. Island, Washington, DC.
- Murray-Darling Basin Authority. 2011a. Delivering a Healthy Working Basin: About the Draft Basin Plan: Murray-Darling Basin Authority. Canberra: Murray-Darling Basin Authority.
- Murray-Darling Basin Authority. 2011b. The proposed ‘environmentally sustainable level of take’for surface water of the Murray-Darling Basin: Methods and outcomes. Canberra: MDBA.
- Murray-Darling Basin Authority 2014. Basin-wide environmental watering strategy, Publication No. 20/14. Canberra: Murray-Darling Basin Authority.
- Napolitano GE. 1999. Fatty acids as trophic and chemical markers in freshwater ecosystems. In: Lipids in freshwater ecosystems. New York: Springer; p. 21–44.
- Oberholster PJ, Botha AM, Cloete TE. 2006. Use of molecular markers as indicators for winter zooplankton grazing on toxic benthic cyanobacteria colonies in an urban Colorado lake. Harmful Algae. 5(6):705–716.
- Pietsch T. 2006. Fluvial geomorphology and late quaternary geochronology of the Gwydir fan-plain [PhD Thesis]. University of Wollongong.
- Robson BJ, Lester RE, Baldwin DS, Bond NR, Drouart R, Rolls RJ, Ryder DS, Thompson RM. 2017. Modelling food-web mediated effects of hydrological variability and environmental flows. Water Res. 124:108–128.
- Rolls RJ, Baldwin DS, Bond NR, Lester RE, Robson BJ, Ryder DS, Thompson RM, Watson GA. 2017. A framework for evaluating food-web responses to hydrological manipulations in riverine systems. J Environ Manage. 203(Pt 1):136–150.
- Ruiz YC, Rivera-Rondon CA, Ovalle H. 2017. Feeding habits of chironomids (Diptera: Chironomidae) of paramo lakes, Chingaza, Colombia. Rev. Biol. Trop. 66(1):136–148.
- Ryder DS, Watts RJ, Nye E, Burns AJM. 2006. Can flow velocity regulate epixylic biofilm structure in a regulated floodplain river? Mar Freshw Res. 57(1):29–36.
- Sheldon F, Walker KF. 1997. Changes in biofilms induced by flow regulation could explain extinctions of aquatic snails in the lower River Murray, Australia. Hydrobiologia. 347(1/3):97–108.
- Southwell M, Wilson G, Ryder D, Sparks P, Thoms M. 2015. Monitoring the ecological response of Commonwealth Environmental Water delivered in 2013-14 in the Gwydir River system A report to the Department of Environment. Armidale: University of New England.
- Sullivan ML, Zhang YX, Bonner TH. 2014. Carbon and nitrogen ratios of aquatic and terrestrial prey for freshwater fishes. J Freshwater Ecol. 29(2):259–266.
- Taipale SJ, Brett MT, Pulkkinen K, Kainz MJ. 2012. The influence of bacteria-dominated diets on Daphnia magna somatic growth, reproduction, and lipid composition. FEMS Microbiol Ecol. 82(1):50–62.
- Thys I, Leporcq B, Descy JP. 2003. Seasonal shifts in phytoplankton ingestion by Daphnia galeata, assessed by analysis of marker pigments. J Plankton Res. 25(12):1471–1484.
- Tonkin Z, Kitchingman A, Lyon J, Kearns J, Hackett G, O’Mahony J, Moloney PD, Krusic-Golub K, Bird T. 2017. Flow magnitude and variability influence growth of two freshwater fish species in a large regulated floodplain river. Hydrobiologia. 797(1):289–301.
- Traugott M, Kamenova S, Ruess L, Seeber J, Plantegenest M. 2013. Empirically characterising trophic networks: what emerging DNA-based methods, stable isotope and fatty acid analyses can offer. Adv Ecol Res. 49:177–224.
- Vadstein O. 2000. Heterotrophic, planktonic bacteria and cycling of phosphorus. In: Advances in microbial ecology. Boston: Springer; p. 115–167.
- Vestal JR, White DC. 1989. Lipid analysis in microbial ecology. Bioscience. 39(8):535–541.
- Volkman J, Jeffrey S, Nichols P, Rogers G, Garland C. 1989. Fatty acid and lipid composition of 10 species of microalgae used in mariculture. J Exp Mar Biol Ecol. 128(3):219–240.
- Vörösmarty CJ, McIntyre PB, Gessner MO, Dudgeon D, Prusevich A, Green P, Glidden S, Bunn SE, Sullivan CA, Liermann CR, et al. 2010. Global threats to human water security and river biodiversity. Nature. 467(7315):555–561.
- Wakeham SG. 1995. Lipid biomarkers for heterotrophic alteration of suspended particulate organic matter in oxygenated and anoxic water columns of the ocean. Deep Sea Res Part I. 42(10):1749–1771.
- Willers C, Jansen van Rensburg P, Claassens S. 2015. Phospholipid fatty acid profiling of microbial communities-a review of interpretations and recent applications. J Appl Microbiol. 119(5):1207–1218.
- Williamson N, Kobayashi T, Outhet D, Bowling LC. 2018. Survival of cyanobacteria in rivers following their release in water from large headwater reservoirs. Harmful Algae. 75:1–15.
- Xu X, Li W, Fujibayashi M, Nomura M, Sakamaki T, Nishimura O, Li X. 2014. Feedback of threshold via estimating sources and composition of sedimentary organic matter across trophic gradients in freshwater lakes. Sci Total Environ. 500–501:373–382.