
Abstract
As an important factor affecting the structure of microbial communities, salinity has traditionally been a focus of exploratory studies of microorganisms. Here, we defined a salinity gradient with reference to the degree of natural salinization in a lake and withdrew the influence of irrelevant factors to explore the impacts of changes in salinity on the biological community. With the gradual increase in salinity, we found that Firmicutes replaced Bacteroidetes as the dominant flora. Through a network diagram, we found that Bacteroidetes had a weaker taxonomic correlation with the bacterial community in the saline environment, which indicated that the increase of salinity did play a role in filtering the bacterial community. In addition, we also found the typical freshwater bacteria GKS98 in a higher salinity environment, which supports the idea proposed by previous researchers that salinity creates a wider niche. However, our functional prediction results show that salinity is not the main factor affecting the functional characteristics of bacterial communities. Moreover, through a network diagram, we found that the symbiotic relationship between GKS98 and other strains also changed with increasing salinity. This suggests that the effects of salinity on microorganisms may involve additional ecological mechanisms such as niche occupation and functional interdependence within the community.
Introduction
Identifying the basis for predicting bacterial community responses to environmental changes is one of the major challenges in the field of microbial ecology today (Antwis et al. Citation2017). Unfortunately, due to the many factors and complex mechanisms that influence community composition, our understanding of the underlying dynamics regulating microbial community structure is still limited. Previous investigations of bacterial diversity have shown that salinity is the main factor affecting the composition of bacterial communities (Wu et al. Citation2006; Lozupone and Knight Citation2007), and a large number of existing studies have also shown that salinity is the factor most closely related to community composition in aquatic systems (Herlemann et al. Citation2011; Tang et al. Citation2012; Liu et al. Citation2013; Liang et al. Citation2019). Understanding how the bacterial community responds to changes in salinity is therefore an essential first step in this challenge of microbial ecology.
Several studies have been conducted on the changes in the composition of bacterial communities along aquatic salinity gradients (Crump et al. Citation2004; Kirchman et al. Citation2005; Kan et al. Citation2008; Steiner et al. Citation2019; Wang et al. Citation2020). However, these studies are usually performed in estuaries. On the one hand, these ecosystems have the characteristics of short hydrological residence time and dynamic changes in salinity due to tidal effects and variable freshwater input. However, the hydrological characteristics of these systems limit the establishment of microbial communities in brackish water (Kowalchuk et al. Citation2002). On the other hand, the mixing of seawater and freshwater in estuaries results in significant changes to the salinity gradients, but the gradient usually changes in complex nonlinear ways with organic matter, plant biomass, sulfides, oxygen, and other abiotic parameters (Zak et al. Citation2003; Van Der Heijden et al. Citation2008). When we eliminate the influence of irrelevant factors and increase the correlation between salinity and the bacterial community, can we more accurately describe the relationship between the two?
For example, some studies have noted that microorganisms adapt to salty environments by ingesting salt or synthetic osmotic substances (Zahran Citation1997; Yan and Marschner Citation2012). In addition, salt can affect the metabolic activities of microorganisms and denature the extracellular enzymes necessary for carbon and nutrient metabolism (Oren Citation2001; Newman Citation2003; Van Horn et al. Citation2014). These changes make it more difficult for us to delve deeper into the structure of microbial communities and the interactions among microorganisms, as well as to predict the response of microbial communities to environmental changes.
However, some studies of the soil and sediment microbial communities near high-salinity lakes have found that changes in microbial communities are highly related to water content, nutrient concentrations and pH rather than salinity (Hollister et al. Citation2010). We hope that salinity is the first factor in our experiment. Therefore, we set up four different salinity gradients with reference to naturally salinized lakes to understand how bacterial communities adapt to changes in salinity.
Network analysis can be used to explore the mathematical, statistical, and structural properties of a group of items (nodes) and the relationships between them (Newman Citation2003; Proulx et al. Citation2005). At present, it has been extensively used to explore interactions among entities (such as food webs and protein metabolic pathways) (Moody Citation2001; Pastor-Satorras and Vespignani Citation2001; Krause et al. Citation2003; Guimera and Amaral Citation2005). Researchers have used network analysis for the preliminary exploration of microbial symbiosis networks (Jiao et al. Citation2016; Xue et al. Citation2017). These networks are based on a certain spatial or temporal gradient, so there is sufficient variability in the taxonomic abundance to explore co-occurrences among microbial groups. Therefore, under a certain temporal gradient, how will the change in salinity affect symbiotic relationships among microorganisms? This appears to be an interesting and under-researched issue.
As we said earlier, changes in salinity will affect microorganisms themselves and their community structure. We can imagine, in turn, that in a gradually salty lake, microorganisms change with the increase of salinity. Will these changes be powered back to the lake? In response, we have introduced functional prediction to reveal the functional characteristics of microbial communities in different salinity gradients and to explore the functional changes of bacterial communities, hoping to be able to provide reference data for evaluating the salinization of fresh water lakes in the future.
Following a review of the above problems, we will focus on microbial communities in lakes that show salinization trends. We exclude the influence of irrelevant factors and establish salinity gradients based on the salinity of the lake. This paper focuses on the effect of salinity on bacterial communities and discusses the response of the symbiotic relationships among microorganisms to salinity.
Materials and methods
Experimental design
The experiment was performed in the laboratory of Xinjiang Bosten Lake Science Research Institute starting on May 1, 2013, and we conducted an experiment in the laboratory for 180 consecutive days (May 1, 2013 to October 28, 2013). The lake water used in the experiment was taken from the freshwater area of Bosten Lake (41°80ˊ75ʺN, 86°63ˊ94ʺE), thoroughly mixed and poured into 12 glass containers (60 cm × 50 cm × 30 cm, open only at the top). Lake Bosten, the largest oligosaline lake in the arid region of China, is representative of an oligosaline lake that evolved from a freshwater lake (Bai et al. Citation2011). The freshwater inflows supplied by melting ice, precipitation and groundwater in the mountainous regions of Xiao et al. (Citation2010) helped shape the freshwater region of this lake. In the past 50 years, however, it has evolved from a freshwater to an oligosaline lake, it represents an interesting ecosystem featuring a complex hydrology and an intrasystem salinity gradient (Tang et al. Citation2012). The water depth in the tank was kept at 50 cm, and the test was started after the water was left to stand for 1 day. To prevent interference from irrelevant factors, the water lost due to evaporation during the test was replaced with sterilized deionized water, and the salt used in each group in the experiment was sterile crystalline salt from Salt Farm of Bosten Lake.
The salinity levels of the experiment were set up in four groups according to the natural salinity of the lake, from fresh water to saltwater, with three replicates in each group. The groups were the control treatment F (freshwater group), the B treatment (brackish group), the O treatment (oligosaline group) and the S treatment (salty group). To simulate the saline conditions of the lake as much as possible, the salinity settings of the four groups (F, B, O, and S) were 0.3 ‰ (fresh water, which simulates the historic Bosten Lake), 1.5 ‰ (brackish water, which simulates the current Bosten Lake), 3.5 ‰ (e.g. another oligosaline lake in this region: Lake Ulungur) and 10 ‰ (saltwater, which simulates Qinghai Lake).
Sample collection
Water samples (800 mL) were taken from the four groups of experimental water tanks with different salinity at 1, 3, 7, 30, 90, and 180 days after the beginning of the experiment placed in glass containers washed with deionized water (taking the fresh water group as an example, according to the extraction time, the water sample is named F-1, F-3, F-7, F-30, F-90, F-180; F-0 means the untreated control group). Each glass container was then sent to the sample analysis room of the Bosten Lake Institute for analysis. Two hundred millilitres of the water samples were analysed and filtered with a 0.2 µm polycarbonate membrane (Millipore, Cork, Ireland) under negative pressure, and the filtered membranes were collected. The filter membrane of the established replicate group was mixed with that of the experimental group, cut with 75% alcohol-sterilized medical scissors, placed in 2 mL sterile centrifuge tubes, and stored in an ultralow temperature refrigerator at −80 °C until DNA extraction.
Physical and chemical analysis
A multiparameter water quality analyser (YSI 6600V2, USA) was used to measure the T (temperature), DO (dissolved oxygen), TDS (total dissolved solids) and pH value of the samples at the time of collection. For the measurement methods for TP (total phosphorus) and TN (total nitrogen), please refer to the "Method for Monitoring and Analysis of Water and Wastewater" (Fourth Edition) (Wei et al. Citation2002).
DNA extraction, purification and PCR amplification
For all samples in this study, FastDNA Spin Kit for Soil (MP Biomedicals, Fountain Pkwy. Solon, OH, USA) was used only for DNA extraction for ten minutes. After the DNA is completely dissolved, the concentration and purity of genomic DNA are measured using a UV spectrophotometer. Depending on the results of the concentration test, a 0.8% agarose gel was used to perform electrophoresis at a voltage of 120 V for about 20 minutes to check the integrity of the DNA sample.
The extracted DNA stock was diluted to 20 ng. μl-1 and used as a PCR template. The V1-V3 region of the bacterial 16S rRNA gene was amplified using PCR amplification of universal primers 8 F (5′-AGAGTTTGATCCTGGCTCAG-3′) and 533 R (5′-TTACCGCGGCTGCTGGCAC-3′) (Bai et al. Citation2012). PCR amplification was carried out using a 50 μL reaction system under the following conditions: predenaturation at 94 °C for 5 minutes, and denaturation at 50 °C. Anneal at 94 °C for 30 seconds, 55 °C for 45 seconds, 72 °C for 1 minute, 27 cycles, 72 °C for 8 minutes, and stored at 4 °C, the experiment was repeated 3 times. The PCR product was purified and concentrated using E.Z.N.A. ®Cycle-Pure Kit. The PCR products from each sample were then mixed in a single tube in equimolar ratios.
454 Pyrosequencing and data analysis
With the Roche Genome Sequencer GS FLX Titanium platform, we performed amplicon pyrosequencing using the 454/Roche A sequencing primer kit. Each read file generated by a pyrosequencing run is associated with a file containing the mass score of each base. After sequencing, sequences with a length of less than 200 bases, an average mass fraction of less than 25, or no primer and barcode sequences were excluded using the QIIME software package (Caporaso et al. Citation2010). The remaining sequences were trimmed and compared with the Silva bacterial database (SILVA version 106; http://www.arb-silva.de/documentation/background/release-106/) via QIIME (Edgar Citation2010). Similar sequences were aggregated into operating classification units (OTUs) with a minimum of 97% identity using UCLUST software. Using the QIIME Platform (http://qiime.org/scripts/assign_taxonomy.html), a taxonomic analysis was performed on the 97% representative OTU sequences with similar levels, and the community composition of each sample was determined.
Bacterial diversity and statistical analysis
OTUs with 97% similarity were selected. The alpha diversity index under different random samples was calculated using Mothur, and the curve was made by the R language tool (R Core Team Citation2013). Beta diversity analysis was represented by Bray-Curtis distance matrices generated from the OTU table, and statistical analysis and mapping was performed with PCoA in R language (Mitter et al. Citation2017). According to the results of the taxonomic analysis, we determined the composition of the community structure of discrete samples at various classification levels (such as phylum, genus, and OTU). Bacterial functions and metabolic pathways were predicted by PICRUSt2 software, and the closed OTU table obtained from QIIME was compared with the COG and KEGG databases to obtain different functional prediction information. The PICRUSt2 software (Fierer et al. Citation2012) and network analysis steps of the microbial community were performed on an online analysis platform (https://www.i-sanger.com/). The raw sequencing data have been submitted to NCBI Sequence Read Archive under the project accession code SRP241750.
Results
Physical and chemical properties
We tested and recorded the relevant parameters on the 1st, 90th and 180th days of the experiment. As showed in the data in Table S1 (supplementary material), the experimental water temperature is relatively stable (24.82 ∼ 25.26), the pH value increases with time (7.98 ∼ 8.56), while DO changes slightly (6.02 ∼ 6.78).
Diversity and richness analysis of bacterial communities
The microbial community diversity and phylogenetic structure of 25 samples in the experiment were analysed by 454 pyrosequencing technology. After quality control of the original data, discarding the low-quality sequences, the sequencing analysis yielded a total of 287,417 high-quality sequence reads, with an average length of approximately 400 bp. The obtained high-quality sequences were considered to have a similarity of 0.97. The sparse curves of all samples tended to approach saturation (), indicating that a reasonable number of individual samples were collected, and the sample coverage was 98.6% or above (), indicating that the depth of sequencing is sufficient to support analytical research. In addition, the OTUs of the 25 samples were different, but the number of OTUs in groups F and B was significantly higher than that in groups O and S. This indicates that as salinity increased, the number of OTUs gradually decreased. The results of the Chao 1 index and ACE index also supported this conclusion.
Figure 1. (a) Rarefaction curves of OTUs. (b) Principal co-ordinates analysis. (c) Partial least squares discriminant analysis.
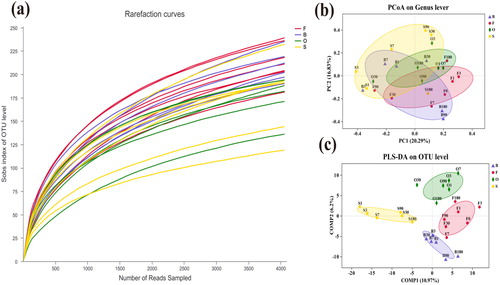
Table 1. Estimates of richness and diversity for operational taxonomic units (OTUs) definition of 97% similarity for twenty-five samples obtained.
The Shannon index is an indicator of the abundance of microbial diversity. The Shannon index values of groups F and B were 3.59 ± 0.49 (Average value ± Standard deviation; the following are the same) and 3.43 ± 0.41, respectively, while the of groups O and S were 3.20 ± 0.64 and 3.25 ± 0.50, respectively (Table 1). Therefore, the microbial diversity was higher in groups F and B, while the diversity was lower in groups O and S. The Simpson index is an indication of the uniformity of microbial diversity. As shown in Table 1, the Simpson index value of group F was the lowest (0.0828 ± 0.064). The of group O was the highest (0.1324 ± 0.101), followed those of group B (0.1090 ± 0.089) and group S (0.1188 ± 0.066). The results showed that the uniformity of microbial diversity was higher in groups O and B and lower in groups F and S.
Beta diversity analysis
PCoA was performed using the paired Bray-Curtis similarity index to further observe the overall situation of the bacterial community. The figure demonstrates that the community structure of bacteria at different salinities can be clearly divided, which shows the positive response of bacteria to changes in salinity. The results of PLS-DA analysis () showed that four samples from the different salinity gradients could be distinguished and clustered into groups, indicating that the bacterial community composition under different salinity conditions is quite different. In addition, the discrete situation of the sample point distribution in the PLS-DA analysis indicates that the flora composition under different salinity gradients is quite different ().
Composition of bacterial communities
The sample sequences were classified at the phylum level, and phyla with an average abundance of at least 1% were compared. As shown in the figure, the community composition of the samples revealed similarities in the bacterial composition of the different treated samples, but the distribution of each phylum was different. In general, the relative abundance of Proteobacteria, Firmicutes, Actinobacteria, and Bacteroidetes in all samples is relatively high, but their abundance fluctuated greatly under different treatment conditions. For example, the Proteobacteria phylum, which made up the largest proportion, reached 78. 25% in B-3 and only 14. 24% in F-180; Firmicutes accounted for 68.00% in S-90 and 7.63% in B-180. In addition, specific strains showed different trends under different conditions. For example, The Actinobacteria in group f showed a decreasing trend with time from day 1 to day 180 (from 26.17% to 6.62%), but in group B (from 13.37% to 33.05%) and group S (from 4.76% to 28.17%), Actinobacteria showed a trend of increasing with time. Bacteroidetes showed different abundances under different salinity conditions. The average abundance in group B was only 4.92%, while the average abundance in group O was 30.17%. At the class level, we found that, unlike in the B and O groups (lower salinity), in the S group (higher salinity), Gammaproteobacteria gradually became the dominant class. It is useful to note that in the subsequent days of the experiment, more Gammaproteobacteria also appeared in group F (lower salinity).
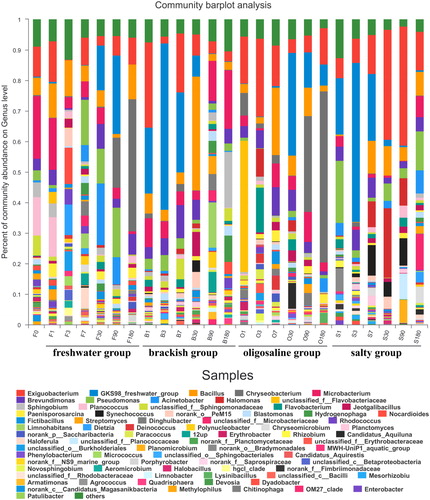
To further reveal the microbial community structure in the sample, the OTUs and their relative abundances were analysed at the genus level, as shown in the figure. The differences in the genera and their abundances under different treatment conditions indicated that the distribution of the microbial bacteria in the samples were different. The dominant bacteria in all 25 samples were the genera Exiguobacterium, GKS98, Bacillus, Chryseobacterium and Microbacterium. It is worth noting that the genus Chryseobacterium accounted for a large proportion of Groups F and O and showed a clear upward trend, while in salinity Group B, which is located between groups F and O, its abundance was relatively low and had no obvious trend of change.
The metabolism rate of microorganisms is fast, so changes in the community composition on the first day of a salinity change have significant research value. By comparing the changes in the community composition on the genus level on the first day of salt addition in each group, we found that the proportion of the genera Microbacterium, Bacillus, and Planococcus gradually decreased after the salinity increased; Microbacterium decreased from 20.5% to 3.3%, and Bacillus fell from 5.6% to 0.4%. It is worth noting that the genus Planococcus accounted for 12.5% and 13.0% in F-0 and F-1, respectively, but the genus was not detected in groups B, O or S with higher salinity.
To compare the differences between the groups in the genus and genus categories, we performed a test of significance between the dominant phyla (left) and the dominant genera (right) for the samples under the four different salinities. The results showed that at the phylum level, Armatimonadetes was significantly different at the four salinities, and its abundance among the four groups was F: 0.1399%, B: 0.5307%, O: 0.008828%, and S: 0.5266%. The abundance of Armatimonadetes in the salt-added group was significantly higher than that in the control group, but its abundance in the moderately saline O group fell below the level in the control group. At the genus level, the genera Chryseobacterium (F: 10.05%, B: 0.7488%, O: 16.57%, and S: 0.2962%), Pseudomonas (F: 7.294%, B: 2.999%, O: 0.7406%, and S: 7.624%) and Sphingobium (F: 1.543%, B: 4.065%, O: 0.7611% and S: 0.2715%) showed significant differences under the four salinity levels. Among them, the genus Chryseobacterium had a lower abundance in groups B and S but a higher abundance in groups F and O. The abundance of the genus Pseudomonas decreased with increasing salinity, but as the salinity increased to 10%, its relative abundance increased significantly, while the genus Sphingobium had a higher average abundance only in group B.
Significant differences in microbial communities
To further identify bacterial taxonomic groups with significant differences in abundance between samples under different salinity effects, we performed a biomarker analysis using the linear discriminant analysis (LDA) effect size (LEfSe) method. At the phylum level, it was consistent with the analysis of the significance of the differences between the groups. The branch diagram also shows that the abundance of Armatimonadetes is significantly different between the samples, and it is considerably enriched in the B group. In addition to the genera Chryseobacterium, Pseudomonas, and Sphingobium, other genera, such as Domibacillus, Dyadobacter, Ferruginibacter, and Dinghuibacter, which were enriched in different samples and had significant differences in abundance, were also discovered. On the one hand, we found that these were the most abundant bacterial genera (up to 12) in the S group samples, with the highest salinity. Although the genus Chryseobacterium is the fourth most abundant bacterial genus (supplementary material, Figure S1), it had a greater effect on the different community compositions at different salinities than other major bacterial genera. This indicates that there is no correlation between the abundance of microbial genera and their effects on differences in community composition.
Co-occurrence network analysis
To better show the changes in the symbiotic relationships among microorganisms under different salinities, we created co-occurrence networks for bacterial communities under different salinities. It is useful to note that Bacteroidetes, which is one of the dominant phyla, shows a low degree of taxonomic correlation in the overall network diagram, and it is mostly negatively correlated with other taxa. It is also interesting that the network diagram of group O () bacteria is only assigned to six different phyla (lower than the nine phyla in the other three groups), which indicates that the taxonomic network of group O is relatively simple. This may be because the taxonomic diversity of group O is lower. In addition, in the network diagram for group S (), some genera were classified as Armatimonadetes, while in the network diagrams for the other groups, no genera were classified as Armatimonadetes. This indicates that the change in salinity caused other bacteria to increase in population and replace the Armatimonadetes bacteria.
Prediction of functions of bacterial communities
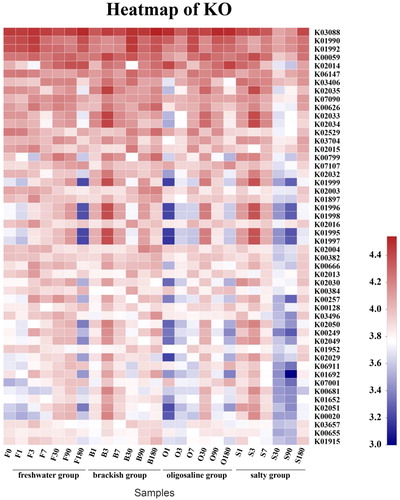
We suspect that bacterial function changes in a similar way to bacterial diversity and community composition. To verify this hypothesis, a new bioinformatics tool PICRUSt2 was used to predict the functional spectrum based on 16S rRNA gene data. According to the generated heat map, RNA polymerase sigma-70factor, ECF sub-family (k03088), ABC-2typetransport system ATP-binding protein (k01990) and ABC-2typetransport system perm ease protein (k01992) have the highest functional abundance. Among them, it is worth noting that RNA polymerase sigma-70 factor has a higher functional abundance in each group, but lower functional abundance in group S at 30 and 90 days. We found thioredoxin reductase (K00384) in the figure. Research shows that Thioredoxin (Trx), Thioredoxin Reductase (TrxR, EC: 1.8.1.9) and NADPH constitute TRX system. The system is the principal electron donor of enzymes such as Ribo Nucleotide Reductase (EC: 1.17.4.1), Methionine Sulfoxide Reductase S (EC: 1.8.4.11), Peroxiredoxin S (EC: 1.11.1.15) and Glutathione Peroxidase S (EC: 1.11.1.9) (Lu and Holmgren Citation2012; García-Giménez et al. Citation2013). This shows that the Thioredoxin-Thioredoxin Reductase System is still functioning under the influence of salinity. In addition, aldehyde dehydrogenase (K00128; EC: 1.2.1.3) also has a higher functional abundance.
Discussion
The first objective of this study was to investigate the effects of salinity on the diversity and community structure of microbial communities in aquatic ecosystems. As we mentioned in the foreword, traditional research on the influence of salinity on the changes in bacterial communities in estuaries includes the impacts of other unrelated parameters. Moreover, the studies of Hollister and others (Hollister et al. Citation2010) have shown that in salt-rich environments, water content, nutrient concentration, and pH have greater effects on microbial communities than salinity. Here, we simulate the different salinity levels of freshwater lakes during the gradual salinization process and explore the changes in microbial community diversity and community structure under natural salinity changes. We found that changes in the microbial community along the salinity gradient may have led to the formation of unique microbial symbiosis patterns.
Salinity acts as a filter for the distribution of community characteristics. In previous studies, it was found that salinity is a significant factor that affects the composition and distribution of microorganisms (Lozupone and Knight Citation2007). It has also been demonstrated in our research that the microbial community composition changed after the first day of salt addition, which indicates that the microbial community can quickly adjust its community composition in response to changes in environmental conditions. In the next few days, the composition of the microbial community continued to change ( and ). This shows that the consistency between microbial community composition and environmental changes is gradual, not achieved overnight, and it takes more time to stabilize a better environmental filter.
Figure 2. (a) Bacterial community structure and distribution at phylum level. (b) Bacterial community structure and distribution at class level.
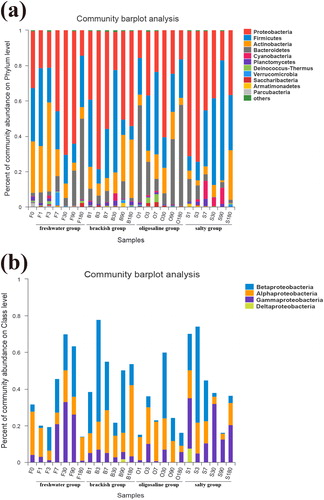
Figure 3. Bacterial community structure and distribution at genus level.
Generally, an increase in salinity will lead to higher osmotic pressure and cause cells to expel water. Therefore, in ecological theory, it is believed that species diversity should decrease with increasing salinity (Newton et al. Citation2011). However, previous studies (Zhang et al. Citation2013) showed that an intermediate salinity level (6.86 g/L) had the lowest number of OTUs and bacterial diversity, and similar results were obtained in our study. It can be seen from the Shannon index values (Table 1) that in our experiments, the diversity of groups O and S was lower than that of groups F and B (lower salinity), which indicates that the increase in salinity does limit the bacterial diversity. The reason may be that the salinity in the O and S groups is too high for freshwater bacteria and too low for marine bacteria.
Environmental filters affect the composition of microbial communities. This study examined the microbial community structure under different salinity levels. Our results showed that Proteobacteria, Firmicutes, Actinobacteria, and Bacteroidetes were the main dominant flora at the phylum level (). Among them, Proteobacteria is currently recognized as the largest bacterial group (Rizzatti et al. Citation2017). Proteobacteria have been shown to dominate marine communities (Edmonds et al. Citation2009; Campbell and Kirchman Citation2013; Herlemann et al. Citation2016), and their presence has also been found in freshwater environments (Zhang et al. Citation2014), which proves that they have a high abundance under different salinity levels. It is worth noting that Bacteroidetes has been considered the second most abundant phylum of the bacterial community in Lake Bosten in previous studies of Lake Bosten (Tang et al. Citation2015). However, in our study, Firmicutes replaced it as the second most abundant phylum. According to , we can see that Bacteroidetes have a weak taxonomic correlation with the bacterial community in freshwater and saline environments. As shown in the figure, only two genera, Dinghuibacter and Candidatus-Aquirestis, are noted in this phylum. Their abundances are relatively low (). Firmicutes, which replaced Bacteroidetes as the second most abundant phylum, have also proven to be suitable for saline environments (Van Horn et al. Citation2014; León-Lorenzana et al. Citation2018). Their ability to survive can be attributed to their Gram-positive cell wall and spore-forming ability, which make them resistant to environmental conditions that gradually increase in salinity. Second, some studies have pointed out that Firmicutes abundance increases with increasing environmental resources, which explains why Firmicutes maintained a high abundance under the same nutritional conditions (Tiao et al. Citation2012). In addition, Armatimonadetes showed significant differences at different salinity levels ( and ), especially in groups B and S, where it showed high abundance. In the network diagram (), we also found that the genus unclassified-f-Fimbriimonadaceae in the Armatimonadetes had a positive correlation with Devosia, and the genera Devosia and Rhizobium have been proven to have symbiotic genes that are interchangeable through horizontal transfer and have obvious aggregation (Rivas et al. Citation2002). Interestingly, in our study, the genus unclassified-f-Fimbriimonadaceae also had the same abundance trend as the genus Devosia in groups B and S (), which may reveal a new type of symbiotic relationship.
Figure 4. Significantly different relative abundance of dominant bacteria in four groups. Kruskal-Wallis was used to evaluate the importance of comparisons between indicated groups. *P < 0.05, **P < 0.01, ***P < 0.001. (a) At the phylum level. (b) At the genus level.
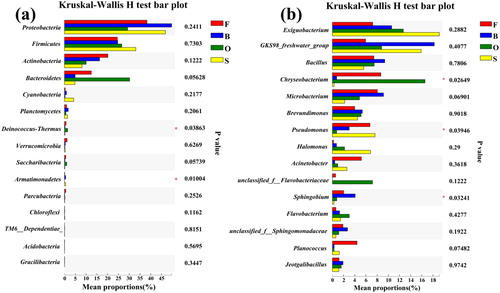
Figure 5. The cladogram of microbial communities. Nodes with different colors represent the microflora that are significantly enriched in the corresponding groups and have significant influence on the differences between groups. Pale yellow nodes indicate the micro-organism groups that have no significant difference in different groups or have no significant influence on the differences between groups.
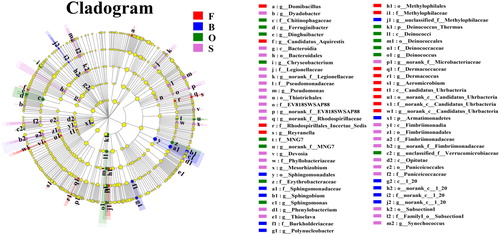
Figure 6. Co-occurrence network analysis for 25 samples. Each node was labelled at the phylum level, shown at the genus level. A connection stands for a strong (Spearman's p > 0.6) and significant (P < 0.05) correlation. The size of each node is proportional to the relative abundance; the thickness of each connection between two nodes (edge) is proportional to the value of Speaman's correlation coefficients. Red and cyan lines indicate positive and negative correlations, respectively. (a) Co-occurrence network analysis for 25 samples. (b) Co-occurrence network analysis of group F samples. (c) Co-occurrence network analysis of group O samples. (d) Co-occurrence network analysis of group S samples.
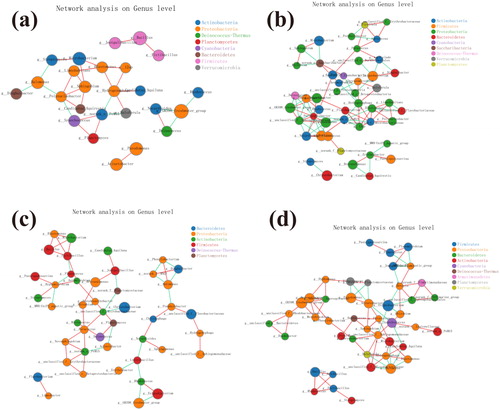
Figure 7. The abscissa is the sample name and the ordinate is the KO number. The color block color gradient is utilized to show the changes in the abundance of different functions in the sample. The legend represents the value represented by the color gradient.
In addition to the genera unclassified-f-Fimbriimonadaceae and Devosia, other bacterial taxa also showed interesting phenomena in our experiments. For example, class Gammaproteobacteria showed higher abundance in the control group in subsequent experiments. After analysing the genus level map, we found that mainly the genus Pseudomonas increased. Studies have shown that some bacteria have high plasticity and adaptability (Evans and Hofmann Citation2012). The genus Pseudomonas has also been proven to have strong adaptability, which may explain the increase in the genus Pseudomonas in subsequent experiments in the freshwater group. In addition, GKS98 also attracted our attention. As a typical freshwater genus, it was observed in the higher-salinity O and S groups (). In previous studies (Zwart et al. Citation2002; LindströM et al. Citation2005; Wu et al. Citation2006), GKS98 was found in acidic and humic freshwater environments and saltwater environments, which indicates that it has a certain degree of ecological and physiological adaptability. Wu et al. (Wu et al. Citation2006) also noted that salinity may create a larger niche width, and GKS98, which appeared at higher salinity levels, also confirmed this view. The genus Chryseobacterium, as the genus that had the greatest effect on the difference in community composition (Figure S1, supplementary material), was enriched in groups F and O, which was related to its preference for the salinity levels in groups F and O (Kim et al. Citation2008). The growth of the genus Chryseobacterium throughout the experimental period may have been due to its ability to adapt to the environment (Arias et al. Citation2012; Bajerski et al. Citation2017; Wang et al. Citation2020).
Environmental filters impact microbial symbiosis. Previous studies (Weiher et al. Citation1998; Faust et al. Citation2012) on the composition of the microbiome have emphasized phylogeny as a key determinant of co-occurrence patterns. However, other studies (Levy and Borenstein Citation2013) show that phylogeny does not fully explain the observed environmental filtration patterns. Therefore, we hope to better understand symbiotic microbial relationships under the influence of various environmental filters. In our study, the changes in salinity changed the relative abundances of bacteria, resulting in different network diagrams for different groups at the phylum level, such as Armatimonadetes, mentioned earlier. To better understand the influence of environmental filters on microorganisms, we will focus on the genus level. Taking GKS98 as an example, with the change in salinity, the symbiotic relationships between GKS98 and other bacterial genera also changed. We speculate that GKS98 may adapt to increasing salinity by changing its symbiotic relationships with other bacterial species. In addition, it has been suggested that the succession of microbial communities is partially self-generating, which indicates that the intertwining of populations in communities can change the physical and chemical characteristics of the surrounding environment (Archer et al. Citation1988; Walker and Del Moral Citation2003). This may affect secondary succession species through competition for nutrients, antagonism or promotion. For example, nitrogen fixed by cyanobacteria introduces ammonia into the system, creating favourable conditions for the growth of other organisms (Schütte et al. Citation2009). Therefore, this concept of succession may be extended to other ecological mechanisms, such as niche occupation and functional interdependence, within the community.
In our research, RNA polymerase sigma-70 factor has the highest functional abundance. Some researches (Bayer-Santos et al. Citation2018) pointed out that it has the regulatory mechanism of photosynthesis in serine/threonine protein kinases, while the figure of serine/threonine-protein kinase was also found in our research (supplementary material, Table S2). However, shows that the OUT numbers of S30 and S90 are relatively small, which explains why the functional abundance of RNA polymerase sigma-70 factor is relatively low in group S at 30 and 90 days. Previous studies (Tagnon and Simeon Citation2017) have shown that during dehydration, salt, heat and oxidative stress, a large number of toxic aldehydes will be produced, which will lead to increasing expression of aldehyde dehydrogenase. In addition, we have noticed that the functional abundance of Thioredoxin (Trx) is not elevated (supplementary material, Table S2), which may be that aldehydes restrict the activity of Thioredoxin (Trx). Indeed (Dafre et al. Citation2017), some aldehyde molecules including malondialdehyde (MDA), trans-2-hexenal and 4-hydroxynonenal were proved to function as powerful gene activators despite their potential toxicity. Our research shows that changes in salinity on the structure of bacterial communities are obvious, but the impact on bacterial function is limited. Therefore, further research is needed to better understand how salinity affects the functional characteristics of bacterial endophyte communities.
Conclusion
Overall, our results show that salinity can be a filter for the distribution of community characteristics, but it takes time to stabilize a stronger environmental filter. Our results from the study of bacterial communities show that at the salinity of 10 ‰, Firmicutes seem to be more suitable for saline environments than Bacteroidetes, probably because Bacteroidetes had a weaker taxonomic correlation with the microbial communities in the environment. The appearance of the typical freshwater bacteria GKS98 in group S (the salinity of 10 ‰) appears to confirm the view that salinity creates a greater niche width. Different from the community structure, salinity has relatively limited influence on the functional characteristics of the community. Through related research on the symbiotic network, we can also see that salinity also affects symbiotic microbial relationships. This demonstrates that the effect of salinity on microorganisms is multifaceted, rather than being a simple positive or negative effect. In addition, the emergence of symbiotic networks has led to a variety of different perspectives for microbial research. Subsequent studies can use network tools to further reveal the complex interactions between microbes. We view these unsolved mysteries as an exciting area for future work.
Supplemental Material
Download MS Word (857.3 KB)Disclosure statement
No potential conflict of interest was reported by the author(s).
Additional information
Funding
Notes on contributors
Lei Zhang
Lei Zhang, PhD, is a Professor at School of Civil Engineering and Architecture, Chuzhou University, Chuzhou, China. His work explores Conceptualization, Software, Resources, and Funding acquisition.
Yao Hu
Yao Hu, Master, is a Student at School of Civil Engineering and Architecture, Chuzhou University, Chuzhou, China. His work explores Data Curation, Writing - Original Draft, and Supervision.
Xingchen Li
Xingchen Li, Master, is a Student at School of Civil Engineering and Architecture, Chuzhou University, Chuzhou, China, His work explores Software, Formal analysis, and Supervision.
Wenxuan Lu
Wenxuan Lu, PhD, is a Professor at Fisheries Research Institute, Anhui Academy of Agricultural Sciences, Hefei, China. His work explores Investigation, Resources, and Project administration.
Jing Li
Jing Li, PhD, is a Professor at Fisheries Research Institute, Anhui Academy of Agricultural Sciences, Hefei, China. Her work explores Validation, Software, and Visualization.
References
- Antwis RE, Griffiths SM, Harrison XA, Aranega-Bou P, Arce A, Bettridge AS, et al. 2017. Fifty important research questions in microbial ecology. FEMS Microbiol Ecol. 93.
- Archer S, Scifres C, Bassham CR, Maggio R. 1988. Autogenic succession in a subtropical savanna: conversion of grassland to thorn woodland. Ecol. Monogr. 58(2):111–127.
- Arias CR, Lafrentz S, Cai W, Olivares-Fuster O. 2012. Adaptive response to starvation in the fish pathogen Flavobacterium columnare: cell viability and ultrastructural changes. BMC Microbiol. 12:266
- Bai J, Chen X, Li J, Yang L, Fang H. 2011. Changes in the area of inland lakes in arid regions of central Asia during the past 30 years. Environ Monit Assess. 178(1-4):247–256.
- Bai Y, Shi Q, Wen D, Li Z, Jefferson WA, Feng C, Tang X. 2012. Bacterial communities in the sediments of Dianchi Lake, a partitioned eutrophic waterbody in China. PloS One. 7(5):e37796.
- Bajerski F, Wagner D, Mangelsdorf K. 2017. Cell membrane fatty acid composition of Chryseobacterium frigidisoli PB4T, isolated from Antarctic glacier forefield soils, in response to changing temperature and pH conditions. Front Microbiol. 8:677
- Bayer-Santos E, Lima LDP, Ceseti L. d M, Ratagami CY, de Santana ES, da Silva AM, Farah CS, Alvarez-Martinez CE. 2018. Xanthomonas citri T6SS mediates resistance to Dictyostelium predation and is regulated by an ECF σ factor and cognate Ser/Thr kinase. Environ Microbiol. 20(4):1562–1575.
- Campbell BJ, Kirchman DL. 2013. Bacterial diversity, community structure and potential growth rates along an estuarine salinity gradient. ISME J. 7(1):210–220.
- Caporaso JG, Kuczynski J, Stombaugh J, Bittinger K, Bushman FD, Costello EK, Fierer N, Peña AG, Goodrich JK, Gordon JI, et al. 2010. QIIME allows analysis of high-throughput community sequencing data. Nat Methods. 7(5):335–336.
- Crump BC, Hopkinson CS, Sogin ML, Hobbie JE. 2004. Microbial biogeography along an estuarine salinity gradient: combined influences of bacterial growth and residence time. Appl Environ Microbiol. 70(3):1494–1505.
- Dafre AL, Schmitz AE, Maher P. 2017. Methylglyoxal-induced AMPK activation leads to autophagic degradation of thioredoxin 1 and glyoxalase 2 in HT22 nerve cells. Free Radic Biol Med. 108:270–279.
- Edgar RC. 2010. Search and clustering orders of magnitude faster than BLAST. Bioinformatics. 26(19):2460–2461.
- Edmonds JW, Weston NB, Joye SB, Mou X, Moran MA. 2009. Microbial community response to seawater amendment in low-salinity tidal sediments. Microb Ecol. 58(3):558–568.
- Evans TG, Hofmann GE. 2012. Defining the limits of physiological plasticity: how gene expression can assess and predict the consequences of ocean change. Philos Trans R Soc Lond, B: Biol Sci. 367(1596):1733–1745.
- Faust K, Sathirapongsasuti JF, Izard J, Segata N, Gevers D, Raes J, Huttenhower C. 2012. Microbial co-occurrence relationships in the human microbiome. PLoS Comput Biol. 8(7):e1002606.
- Fierer N, Leff JW, Adams BJ, Nielsen UN, Bates ST, Lauber CL, Owens S, Gilbert JA, Wall DH, Caporaso JG, et al. 2012. Cross-biome metagenomic analyses of soil microbial communities and their functional attributes. Proc Natl Acad Sci USA. 109(52):21390–21395.
- García-Giménez JL, Seco-Cervera M, Aguado C, Romá-Mateo C, Dasí F, Priego S, Markovic J, Knecht E, Sanz P, Pallardó FV, et al. 2013. Lafora disease fibroblasts exemplify the molecular interdependence between thioredoxin 1 and the proteasome in mammalian cells. Free Radic Biol Med. 65:347–359.
- Guimera R, Amaral LAN. 2005. Functional cartography of complex metabolic networks. Nature. 433:895–900.
- Herlemann DPR, Labrenz M, Jurgens K, Bertilsson S, Waniek JJ, Andersson AF. 2011. Transitions in bacterial communities along the 2000 km salinity gradient of the Baltic Sea. ISME J. 5(10):1571–1579.
- Herlemann DP, Lundin D, Andersson AF, Labrenz M, Jürgens K. 2016. Phylogenetic signals of salinity and season in bacterial community composition across the salinity gradient of the Baltic Sea. Front Microbiol. 7:1883
- Hollister EB, Engledow AS, Hammett AJM, Provin TL, Wilkinson HH, Gentry TJ. 2010. Shifts in microbial community structure along an ecological gradient of hypersaline soils and sediments. ISME J. 4(6):829–838.
- Jiao S, Liu Z, Lin Y, Yang J, Chen W, Wei G. 2016. Bacterial communities in oil contaminated soils: Biogeography and co-occurrence patterns. Soil Biol Biochem. 98:64–73.
- Kan J, Evans SE, Chen F, Suzuki MT. 2008. Novel estuarine bacterioplankton in rRNA operon libraries from the Chesapeake Bay. Aquat Microb Ecol. 51:55–66.
- Kim KK, Lee KC, Oh HM, Lee JS. 2008. Chryseobacterium aquaticum sp. nov., isolated from a water reservoir. Int J Syst Evol Microbiol. 58(Pt 3):533–537.
- Kirchman DL, Dittel AI, Malmstrom RR, Cottrell MT. 2005. Biogeography of major bacterial groups in the Delaware Estuary. Limnol Oceanogr. 50(5):1697–1706.
- Kowalchuk GA, Buma DS, de Boer W, Klinkhamer PG, van Veen JA. 2002. Effects of above-ground plant species composition and diversity on the diversity of soil-borne microorganisms. Antonie Van Leeuwenhoek. 81(1–4):509–520.
- Krause AE, Frank KA, Mason DM, Ulanowicz RE, Taylor WW. 2003. Compartments revealed in food-web structure. Nature. 426(6964):282–285.
- León-Lorenzana D, Arit S, Delgado-Balbuena L, Domínguez-Mendoza CA, Navarro-Noya YE, Luna-Guido M, et al. 2018. Soil salinity controls relative abundance of specific bacterial groups involved in the decomposition of maize plant residues. Front Ecol Evol. 6:51.
- Levy R, Borenstein E. 2013. Metabolic modeling of species interaction in the human microbiome elucidates community-level assembly rules. Proc Natl Acad Sci USA. 110(31):12804–12809.
- Liang J, Liu J, Wang X, Lin H, Liu J, Zhou S, Sun H, Zhang X-H. 2019. Spatiotemporal dynamics of free-living and particle-associated Vibrio communities in the northern Chinese marginal seas. Appl Environ Microbiol. 85(9):19. e00217
- LindströM ES, Kamst-Van Agterveld MP, Zwart G. 2005. Distribution of typical freshwater bacterial groups is associated with pH, temperature, and lake water retention time. AEM. 71(12):8201–8206.
- Liu Y, Yao T, Jiao N, Zhu L, Hu A, Liu X, Gao J, Chen Z-Q. 2013. Salinity impact on bacterial community composition in five high-altitude lakes from the Tibetan Plateau, Western China. Geomicrobiol J. 30(5):462–469.
- Lozupone CA, Knight R. 2007. Global patterns in bacterial diversity. Proc Natl Acad Sci Usa. 104(27):11436–11440.
- Lu J, Holmgren A. 2012. Thioredoxin system in cell death progression. Antioxid Redox Signal. 17(12):1738–1747.
- Mitter EK, de Freitas JR, Germida JJ. 2017. Bacterial root microbiome of plants growing in oil sands reclamation covers. Front Microbiol. 8:849.
- Moody J. 2001. Race, school integration, and friendship segregation in America. Am J Sociol. 107(3):679–716.
- Newman MEJ. 2003. The structure and function of complex networks. SIAM Rev. 45(2):167–256.
- Newton RJ, Jones SE, Eiler A, McMahon KD, Bertilsson S. 2011. A guide to the natural history of freshwater lake bacteria. Microbiol Mol Biol Rev. 75(1):14–49.
- Oren A. 2001. The bioenergetic basis for the decrease in metabolic diversity at increasing salt concentrations: implications for the functioning of salt lake ecosystems. Dordrecht: Springer; p. 61–72.
- Pastor-Satorras R, Vespignani A. 2001. Epidemic spreading in scale-free networks. Phys Rev Lett. 86(14):3200–3203.
- Proulx SR, Promislow DEL, Phillips PC. 2005. Network thinking in ecology and evolution. Trends Ecol Evol (Amst). 20(6):345–353.
- R Core Team, 2013. R: A language and environment for statistical computing. Computing. 1:12–21.
- Rivas R, Velázquez E, Willems A, Vizcaíno N, Subba-Rao NS, Mateos PF, Gillis M, Dazzo FB, Martínez-Molina E. 2002. A new species of Devosia that forms a unique nitrogen-fixing root-nodule symbiosis with the aquatic legume Neptunia natans (Lf) Druce. Appl Environ Microbiol. 68(11):5217–5222.
- Rizzatti G, Lopetuso LR, Gibiino G, Binda C, Gasbarrini A. 2017. Proteobacteria: a common factor in human diseases. Biomed Res Int. 2017:9351507.
- Schütte UME, Abdo Z, Bent SJ, Williams CJ, Schneider GM, Solheim B, Forney LJ. 2009. Bacterial succession in a glacier foreland of the high Arctic. ISME J. 3(11):1258–1268.
- Steiner PA, Sintes E, Simó R, De Corte D, Pfannkuchen DM, Ivančić I, Najdek M, Herndl GJ. 2019. Seasonal dynamics of marine snow-associated and free-living demethylating bacterial communities in the coastal northern Adriatic Sea. Environ Microbiol Rep. 11(5):699–707.
- Tagnon MD, Simeon KO. 2017. Aldehyde dehydrogenases may modulate signaling by lipid peroxidation-derived bioactive aldehydes. Plant Signal Behav. 12(11):e1387707
- Tang X, Xie G, Shao K, Chen Y, Gao G. 2012. Influence of salinity on the bacterial community composition in Lake Bosten, a large oligosaline lake in arid northwestern China. Appl Environ Microbiol. 78:4748–4751.
- Tang X, Xie G, Shao K, Dai J, Chen Y, Xu Q, Gao G. 2015. Bacterial community composition in oligosaline lake Bosten: Low overlap of betaproteobacteria and bacteroidetes with freshwater ecosystems. Microbes Environ. 30(2):180–188.
- Tiao G, Lee CK, McDonald IR, Cowan DA, Cary SC. 2012. Rapid microbial response to the presence of an ancient relic in the Antarctic Dry Valleys. Nat Commun. 3(1):18.
- Van Der Heijden MGA, Bardgett RD, Van Straalen NM. 2008. The unseen majority: soil microbes as drivers of plant diversity and productivity in terrestrial ecosystems. Ecol Lett. 11(3):296–310.
- Van Horn DJ, Okie JG, Buelow HN, Gooseff MN, Barrett JE, Takacs-Vesbach CD. 2014. Soil microbial responses to increased moisture and organic resources along a salinity gradient in a polar desert. Appl Environ Microbiol. 80(10):3034–3043.
- Walker LR, Del Moral R. 2003. Primary succession and ecosystem rehabilitation. Cambridge: Cambridge University Press.
- Wang Y, Pan J, Yang J, Zhou Z, Pan Y, Li M. 2020. Patterns and processes of free‐living and particle‐associated bacterioplankton and archaeaplankton communities in a subtropical river‐bay system in South China. Limnol Oceanogr. 65(S1).
- Wang H, Wu P, Liu J, Yang S, Ruan B, Rehman S, Liu L, Zhu N. 2020. The regulatory mechanism of Chryseobacterium sp. resistance mediated by montmorillonite upon cadmium stress. Chemosphere. 240:124851
- Wei FS, Qi WQ, Bi T, Sun ZG, Huang YR, Sheng YW. 2002. Discharge standard of pollutants for municipal wastewater treatment plant. 291–2981. Beijing: China Environmental Science Press (in Chinese).
- Weiher E, Clarke GDP, Keddy PA. 1998. Community assembly rules, morphological dispersion, and the coexistence of plant species. Oikos. 81(2):309–322.
- Wu QL, Zwart G, Schauer M, Kamst-van Agterveld MP, Hahn MW. 2006. Bacterioplankton community composition along a salinity gradient of sixteen high-mountain lakes located on the Tibetan Plateau, China. Appl Environ Microbiol. 72(8):5478–5485.
- Xiao M, Wu F, Liao H, Li W, Lee X, Huang R. 2010. Characteristics and distribution of low molecular weight organic acids in the sediment porewaters in Bosten Lake. China J Environ Sci. 22(3):328–337.
- Xue L, Ren H, Li S, Leng X, Yao X. 2017. Soil bacterial community structure and co-occurrence pattern during vegetation restoration in karst rocky desertification area. Front Microbiol. 8:2377
- Yan N, Marschner P. 2012. Response of microbial activity and biomass to increasing salinity depends on the final salinity, not the original salinity. Soil Biol Biochem. 53:50–55.
- Zahran HH. 1997. Diversity, adaptation and activity of the bacterial flora in saline environments. Biol Fertil Soils. 25(3):211–223.
- Zak DR, Holmes WE, White DC, Peacock AD, Tilman D. 2003. Plant diversity, soil microbial communities, and ecosystem function: are there any links?. Ecology. 84(8):2042–2050.
- Zhang L, Gao G, Tang X, Shao K. 2014. Can the freshwater bacterial communities shift to the “‘marine-like’taxa?”J Basic Microbiol. 54(11):1264–1272.
- Zhang L, Gao G, Tang X, Shao K, Bayartu S, Dai J. 2013. Bacterial community changes along a salinity gradient in a Chinese wetland. Can J Microbiol. 59(9):611–619.
- Zwart G, Crump BC, Kamst-van Agterveld MP, Hagen F, Han SK. 2002. Typical freshwater bacteria: an analysis of available 16S rRNA gene sequences from plankton of lakes and rivers. Aquat Microb Ecol. 28:141–155.