
 ?Mathematical formulae have been encoded as MathML and are displayed in this HTML version using MathJax in order to improve their display. Uncheck the box to turn MathJax off. This feature requires Javascript. Click on a formula to zoom.
Abstract
Invasive species introduction and expansion is the second greatest threat to global biodiversity decline after habitat degradation. Introduced in the 1930s, the benthivorous Longnose Sucker (Catostomus catostomus) became established in Yellowstone Lake, Wyoming, USA, and used tributary streams for spawning. With this introduction, concerns were raised regarding their possible competition for food resources with native adfluvial Yellowstone Cutthroat Trout (Oncorhynchus clarkii bouvieri). Additionally, insufficient literature exists on Longnose Sucker feeding habits throughout their range, and there has been no comprehensive study of Longnose Sucker diet in Yellowstone Lake. The need exists for understanding the community ecology and food web dynamics in Yellowstone Lake, especially as non-native Lake Trout (Salvelinus namaycush) have caused declines in Yellowstone Cutthroat Trout through predation. The objectives of this study were to examine possible size-specific shifts in feeding habits, evaluate feeding strategy, and compare historical and contemporary diet data of Longnose Suckers in Yellowstone Lake. Diet data collected during summer of 2018 were analyzed by length-class to test for size-specific diet shifts. As Longnose Sucker length increased, copepods (Diacyclops bicuspidatus thomasi, Leptodiaptomus ashlandi or Hesperodiaptomus shoshone) decreased in proportion by weight. In contrast, dipterans (Chironomidae) and amphipods (Hyalella spp. or Gammarus spp.) varied in proportion by weight in the diet across length classes. We assessed the feeding strategy by evaluating the relationship between prey-specific abundance and percent frequency of occurrence. This assessment indicates that Longnose Suckers have a heterogeneous diet and generalized feeding strategy as all prey items had a prey-specific abundance value of <50%. Diet composition differed significantly between historical and contemporary samples, likely related to the differences in sampling locations and possibly due to a Lake Trout-induced trophic cascade. This study established the diet composition and feeding habits of Longnose Suckers residing in Yellowstone Lake, thus, expanding our knowledge of Longnose Sucker feeding patterns and ecology.
Introduction
Invasive species introduction and expansion is the second greatest threat to global biodiversity decline after habitat degradation (Wilcove et al. Citation1998; WWF Citation2016). Additionally, introductions are recognized as a major threat to aquatic ecosystems (Ricciardi and Rasmussen Citation1999; Pimentel et al. Citation2005). For example, the non-native Lake Trout (Salvelinus namaycush) in Yellowstone Lake caused the near-collapse of the native Yellowstone Cutthroat Trout (Oncorhynchus clarkii bouvieri) population and a four-level trophic cascade (Koel et al. Citation2019). The effects of the Lake Trout invasion in Yellowstone Lake and tributary streams are well-documented, and research demonstrates how Lake Trout indirectly forced declines, displacements, and prey shifting by bald eagles (Haliaeetus leucocephalus), ospreys (Pandion haliaetus), river otters (Lutra canadensis), and black and grizzly bears (Ursus americanus and Ursus arctos, respectively) in Yellowstone National Park (Koel et al. Citation2019).
Lake Trout, however, are not the only non-native species introduced into Yellowstone Lake. In the 1930s, the benthivorous Longnose Sucker was introduced and became established in Yellowstone Lake and used tributary streams for spawning (Brown and Graham Citation1954; Koel et al. Citation2019). The introduction of Longnose Suckers in Yellowstone Lake raised concerns about their potential effect on Yellowstone Cutthroat Trout. Therefore, research was conducted to understand Longnose Sucker life history. An investigation on spawning behavior, age and growth, distribution and diet of the Longnose Sucker collected in tributaries of Yellowstone Lake showed no indication that Longnose Suckers had negative effect on Yellowstone Cutthroat Trout populations (Brown and Graham Citation1954; Biesinger Citation1961).
Both within Yellowstone Lake and throughout their native range, insufficient literature exists regarding the Longnose Sucker life history. Additionally, as Lake Trout suppression efforts continue in Yellowstone Lake to promote Yellowstone Cutthroat Trout recovery, it is essential to understand the community ecology and food-web dynamics in the lake. We wanted to investigate the diets of the Longnose Sucker sampled from Yellowstone Lake to expand the knowledge regarding Longnose Suckers in their non-native range. The objectives of this study were to examine possible size-specific shifts in feeding habits, evaluate feeding patterns and compare historical (Brown and Graham Citation1954; Biesinger Citation1961) diet data and contemporary diet data of Longnose Suckers sampled in Yellowstone Lake.
Methods and materials
Study site
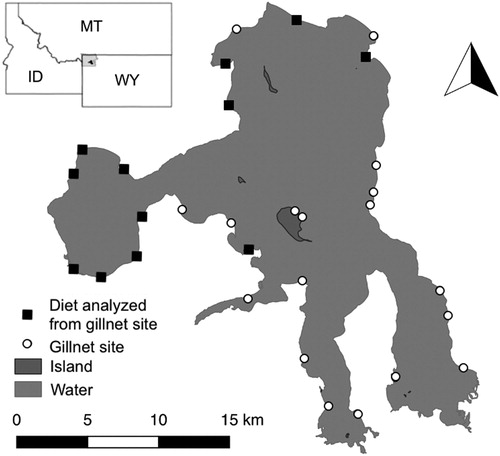
Yellowstone Lake is located in Yellowstone National Park in northwestern Wyoming, USA (), and is the largest high elevation (above 2000 m; 2357 m) lake in North America, with a surface area of 34,020 ha (Kaplinski Citation1991) and a maximum depth of 133 m (Morgan et al. 2003). In addition to Yellowstone Cutthroat Trout, Lake Trout and Longnose Sucker, the fish assemblage consists of the native Longnose Dace (Rhinichthys cataractae) and two non-native fishes, Redside Shiner (Richardsonius balteatus) and Lake Chub (Couesius plumbeus) (Koel et al. Citation2006). Yellowstone Cutthroat Trout, Lake Trout and Longnose Sucker are well-established across the lake; the Leucisid species (also known as ‘minnows’) inhabit only vegetated bays and other littoral areas (Kaeding and Koel Citation2011).
Figure 1. Map of Yellowstone Lake, Wyoming with 2018 gillnet locations. Open circles or black squares represent locations of 2018 sampling sites, while black squares are the gillnets from which Longnose Suckers were sampled and had diets analyzed for inclusion in this study.
Fish collection
Gill nets were used to sample 30 sites across the lake from 2 August 2018 to 20 September 2018 (i.e. evenly distributed, stratified sampling resulting in six sites in each of the four regions of the lake; ). At each site, a small-mesh sinking gill net and a large-mesh sinking gill net were set overnight, parallel to each other and perpendicular to the shore, at three depth strata determined by the depth of the thermocline: epilimnion (3–10 m); metalimnion (10–30 m) and hypolimnion (>40 m) () (Syslo et al. Citation2016). This sampling design was implemented to sample across the existing range of fish sizes in the lake, at each site. Small-mesh gill nets were 2.4-m deep by 90-m long and consisted of six 15-m panels (19-, 25-, 32-, 38-, 44- and 51-mm bar measure mesh). Large-mesh gill nets were 2.4-m deep by 75-m long and consisted of five 13.7-m panels (57-, 64-, 70-, 76- and 89-mm bar measure mesh). The total length of fish was measured to the nearest millimeter. Fishes captured other than Longnose Suckers included Yellowstone Cutthroat Trout and Lake Trout. Of the trout species collected as incidental mortalities, diet analyses were also conducted to inform other Yellowstone Lake studies.
Diet extraction and identification
Of the collected fish, the alimentary canal was extracted and preserved in 70% ethanol. If the canal was greater than 150-mm, only the first 150-mm portion was extracted. We selected the beginning of the canal because we hypothesized that food items would be less digested at the beginning of the canal than at the end of the canal. Diet contents were poured into a container with ten equally sized units. To subsample the diets, a random number generator was used to select a number between 1 and 10, twice, to randomly select two grid units. We used preliminary diet extractions with and without subsampling to confirm that a 20% subsample was indeed representative of the whole diet collected from the fish. Prey items were identified to the lowest taxonomic level possible, typically to genus and blotted wet-weights were recorded to the nearest 0.0001 g. Detritus was weighed in the same manner as invertebrates or phytoplankton using blotted wet-weight. Unidentified materials found in diets were weighed but not included in proportional or statistical analyses.
Diet analysis
Size-specific diet shift
To account for size-specific diet shifts, we sampled at least ten individuals from each length-class (total length in millimeters): 100–199, 200–299, 300–399, 400–499 and 500–599. We analyzed the mean percent composition by weight of each prey item by length-class. Mean composition by weight is useful for assessing the importance of prey type to the diet of a predator and is calculated by dividing the weight of each prey category consumed by the total weight of all items in the diet (Chipps and Garvey Citation2007). Mean composition by weight is calculated as:
where MWi is the mean composition by weight, P is the number of fish with food in their stomachs, Wij is the weight of prey i in the stomach contents of individual fish j, and Q is the number of food types (Chipps and Garvey Citation2007). Beta regression (betareg package) (Cribari-Neto and Zeileis Citation2010) was used to test for differences in mean composition by weight among length-classes.
Feeding patterns
We assessed feeding patterns using the graphical technique proposed by Costello (1990) and modified by Amundsen et al. (Citation1996), which evaluates the relationship between prey-specific abundance and percentage frequency of occurrence. Amundsen et al. (Citation1996) defined prey-specific abundance as the proportion that prey i comprises of all prey items in only the predators that contain prey i (Amundsen et al. Citation1996). Prey-specific abundance is calculated as:
where Pi is the prey-specific abundance of prey i, Si the stomach content weight comprised of prey i and Sti the total stomach content weight in only those predators with prey i in their stomach (Amundsen et al. Citation1996). We used this graphical technique to analyze prey importance and feeding strategy. Summarized interpretation of the quadrant labels for the Costello (1990) technique are below (adapted from Amundsen et al. Citation1996), or can be further explained by referencing Amundsen et al. (Citation1996):
Prey importance and predator feeding strategy are obtained by viewing distributions of points along the diagonals and axes of the diagram.
Predator feeding strategy in terms of specialization or generalization is represented on the vertical axis (more specialized predator is in the upper part of the graph).
Prey in the upper left corner of the graph will have been consumed by a few individuals displaying specialization.
Prey in the lower right corner of the graph will have been eaten occasionally by most individuals.
Historical comparison
Longnose Sucker diet data from this study were compared to Biesinger (Citation1961) and Brown and Graham (Citation1954) using the percentage frequency of prey occurrence. Biesinger (Citation1961) and Brown and Graham (Citation1954) used percentage frequency of occurrence to describe diet data calculated as:
where Oi is the percentage frequency of occurrence of prey i, Ji is the number of fish containing prey i and P is the number of fish with food in their stomach (Chipps and Garvey Citation2007). Pearson's chi-squared test (α = 0.05) was used to compare the number of stomachs containing each diet item amongst Biesinger (Citation1961), Brown and Graham (Citation1954) and this study. All statistical analyses were conducted in R, version 3.5.3 (R Core Team Citation2019).
Results
We sampled 56 Longnose Sucker for diet examination, varying in length from 160 to 589 mm (12 fish in 100–200 mm; 12 fish in 201–300 mm; 10 fish in 301–400 mm; 11 fish in 401–500 mm; 11 fish in 501–600 mm), all fish contained food in their digestive tracts. The most prevalent prey categories were detritus, copepods (Diacyclops bicuspidatus thomasi, Leptodiaptomus ashlandi or Hesperodiaptomus shoshone) and dipterans (Chironomidae). Amphipods (Hyalella spp. or Gammarus spp.), cladocerans (Daphnia schødleri or Daphnia pulicaria), ephemeropterans (Siphlonurus spp., Stenacron spp., Ephemerella spp., Serratella spp. or Baetis spp.), mollusks (Spheariidae, Planorbidae or Physidae) and benthic algae (Anabaena spp.) were also present but accounted for less of the diet weight. Detritus composed 30.4% of the diet by weight and occurred in 94.7% of diets in all length-classes (). Dipterans were the second-highest proportion of the diet of all length-classes, composing 30.0% of the diet by weight and occurring in 84.2% of diets. Longnose Suckers also relied upon copepods, which comprised 10.4% of the diet but at a low frequency of occurrence of 8.8%. Amphipods, cladocerans, ephemeropterans, mollusks and benthic algae each composed less than 10% of the diet by weight in all length-classes.
Table 1. Frequencies of occurrence and percent composition by weight for diet items eaten by Longnose Suckers sampled in 2018 (this study), Biesinger (Citation1961) and Brown and Graham (Citation1954).
Size-specific diet shift
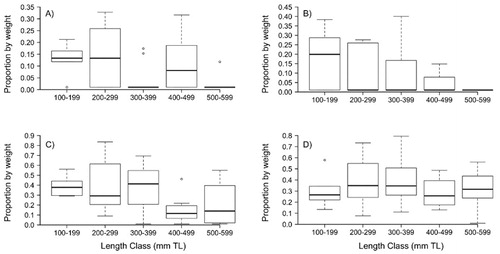
We wanted to further examine possible differences across Longnose Sucker length classes for the most prevalent diet items by weight. Mean composition by weight for amphipods, copepods, detritus and dipterans varied among length-classes (), but statistical significance was not supported for any diet items from beta regression or post-hoc Tukey tests. Amphipod proportion by weight was least for the 300 mm and 500 mm length class (). Overall, copepod proportion by weight decreased from length-class 100 mm to length-class 500 mm (). Dipterans and detritus proportion by weight was relatively constant across all length classes ().
Figure 2. Proportion by weight across length class (total length; TL) for (A) amphipods, (B) copepods, (C) Diptera and (D) detritus in Longnose Sucker diets collected in Yellowstone Lake, Wyoming, USA in 2018. Black lines are median values, boxes are interquartile range (IQR), whiskers are 1.5 × IQR and points are outliers.
Feeding patterns
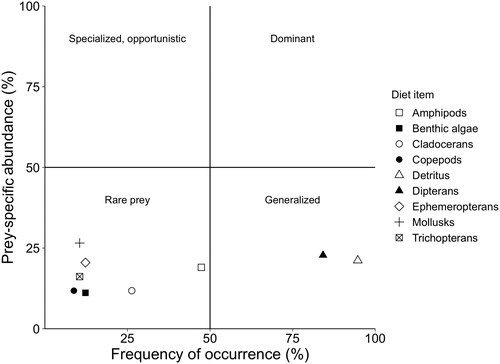
The relationship between prey-specific abundance and frequency of occurrence indicate that Longnose Suckers exhibit a generalized feeding strategy (). The most important diet items were dipterans and detritus, eaten by more than half of the fish, but their average contribution to the stomach contents of these fish was low (). Rare (in terms of being found in diets) prey items included amphipods, cladocerans, copepods, ephemeropterans, mollusks, benthic algae and trichopterans ().
Figure 3. Relation between prey-specific abundance and frequency of occurrence of prey taxa for Longnose Suckers sampled from Yellowstone Lake, Wyoming during the summer of 2018. Summarized interpretation of the quadrant labels for the Costello (1990) technique are below (adapted from Amundsen et al. Citation1996) or can be further explained by referencing Amundsen et al. (Citation1996):
• Prey importance and predator feeding strategy are obtained by viewing distributions of points along the diagonals and axes of the diagram.
• Predator feeding strategy in terms of specialization or generalization is represented on the vertical axis (more specialized predator is in the upper part of the graph).
• Prey in the upper left corner of the graph will have been consumed by a few individuals displaying specialization.
• Prey in the lower right corner of thee graph will have been eaten occasionally by most individuals.
Historical comparison
Brown and Graham (Citation1954) sampled 74 fish for diet examination (total length, 83 mm–496 mm) from June to September of 1951 and 1952, while Biesinger (Citation1961) sampled 100 fish for diet examination (total length, 170–427 mm) from July to August of 1959. Strong evidence exists to support that the number of stomachs containing each diet item differed between Brown and Graham (Citation1954) and this study (χ = 101.17, p = <.0001) and Biesinger (Citation1961) and this study (χ = 111.29, p = <.0001). Amphipods, copepods and cladocerans were absent in diets from Brown and Graham (Citation1954) study while they occurred in 47.4%, 8.8% and 26.3% of diets from this study, respectively (). Coleopteran (spp.) occurred in over 30% of Brown and Graham (Citation1954) diets but were absent in 2018 diets. Benthic algae decreased from 63.0% in the Brown and Graham (Citation1954) diets to 12.3% in 2018 diets (). Dipterans increased from 49.7% in the Brown and Graham (Citation1954) diets to 84.2% in 2018 diets (). Amphipods and cladocerans decreased from 60.0% and 58%, respectively, in Biesinger (Citation1961) to 47.4% and 26.3% in 2018 diets ().
Discussion
Size-specific shift
Longnose Sucker diet composition differed as length increased, though no statistical difference was supported. Generally, amphipods, dipterans and copepods decreased by weight in diets as length increased, while benthic algae weight increased. Size-specific shifts have also been noted in other sucker species' diets. Amphipods increased in importance with increasing total length for White Sucker (Catostomus commersonii) in Lake Michigan (Koehler Citation1979), but we observed a decrease in importance of amphipods with increasing total length (). Amphipods were also an important prey item for Longnose Suckers living in Great Slave Lake, Northwest Territory, Canada and Pyramid Lake, Alberta, Canada, constituting over 60% of diet by volume (Rawson and Elsey Citation1950; Rawson 1951). The apparent size-specific shift we observed may be due to competition for food resources.
After initial discovery in 1994 and subsequent invasion of Lake Trout in Yellowstone Lake, Yellowstone Cutthroat Trout exhibited diet shifts to rely more on benthic amphipods than zooplankton (Syslo et al. Citation2016). As Longnose Sucker length increases, the fish tend to be sampled in deeper waters; therefore, longer Longnose Suckers are more likely to occupy the same strata as Yellowstone Cutthroat Trout, which are more abundant in Yellowstone Lake (Koel et al. Citation2019). Consequently, the competition between these two species may increase as Longnose Sucker length increases. The possibility exists that Longnose Suckers sharing habitat with Yellowstone Cutthroat Trout or Lake Trout must find alternatives to amphipods in their diets as a result of interspecific competition because more than 50% of Yellowstone Cutthroat Trout and Lake Trout diets by weight are comprised of amphipods (Syslo et al. Citation2016).
A Longnose Sucker life-history study in a Wyoming reservoir found that dipterans were not abundant in the diets of smaller fish, and as fish size increased, dipterans became more important (Harned Citation1981). These conclusions are contrary to our study as we found dipterans to decrease in importance with increasing length (). The discrepancy may be explained by our samples not including suckers smaller than 100 mm, while, Harned (Citation1981) sampled Longnose Suckers ranging in length from 45 mm to 300 mm.
Similar to previous studies on Longnose Sucker, detritus made up a large proportion of the diets, and copepods decreased in importance in diets of longer Longnose Suckers (Rawson and Elsey Citation1950; Koehler Citation1979). Previous studies showed that zooplankton were more important than detritus to smaller Longnose Suckers (Rawson and Elsey Citation1950; Koehler Citation1979). The consumption of detritus by a similar species, the White Sucker, is intentional when preferred invertebrate prey are scarce (Ahlgren Citation1990). Detritus has previously been thought of as indigestible and nutritionally insignificant to fish (Darnell Citation1967; Odum Citation1970) and that detritus is indiscriminately ingested with invertebrates (Forbes and Egerton Citation1888; Carl 1937; Macphee Citation1960). However, studies have shown detritus to be 60–75% digestible and assimilated by detritivores and to be nutritionally adequate to support their growth (Bowen Citation1981; Lewis and Peters Citation1984). Thus, detritus is considered an important diet item to Longnose Suckers in Yellowstone Lake for all length-classes.
Feeding pattern
Longnose Suckers in Yellowstone Lake have a heterogeneous diet and generalist feeding strategy. The most important items in Longnose Sucker diets in Yellowstone Lake were dipterans and detritus. However, their average contribution to the stomach contents was low, which is indicative of a generalized feeding strategy. A generalist predator has a broad dietary niche width, utilizing a wide range of food resources at the population level (Amundsen et al. Citation1996). Longnose Suckers in Yellowstone Lake have a relatively high within-phenotype component, meaning individuals exploit a wide range of overlapping resources (Giller Citation1984; Amundsen et al. Citation1996). Previous studies corroborate our findings that Longnose Suckers have generalist feeding strategies, preying on many different prey taxa (Koehler Citation1979; Harned Citation1981).
The generalist feeding strategy of Longnose Suckers may have attributed to their success in colonizing Yellowstone Lake. A combination of factors determines the population trajectory of any species introduction, and while each successful invasion has some unique properties, generalizations on invasion traits exist to predict the success of a species to invade (Simberloff Citation2013; Havel et al. Citation2015). First, non-native species must disperse to reach new habitats (Havel et al. Citation2015), and characteristics lending species to be transported by humans (intentionally or unintentionally) are important attributes of successful colonists (Ehrlich Citation1986). Second, certain characteristics lend species the capability to be successful invaders by their ability to succeed in a new aquatic habitat (Ehrlich Citation1986). Successful colonists tend to be relatively abundant and widely distributed where they are endemic (Ehrlich Citation1986); Longnose Suckers are the most widespread sucker in Northern America (Varley and Schullery Citation1998). In systems that have been minimally altered by human activity, such as Yellowstone Lake, invasive fish are more likely to be represented by top predators and omnivores/detritivores (Moyle and Light Citation1996). Our findings indicate that Longnose Suckers in Yellowstone Lake are polyphagous omnivores-detritivores with a generalist feeding strategy. Finally, the success of a non-native species to persist is partially due to the features of the site to which it has been introduced (Simberloff Citation2013). The clear, cold waters of Yellowstone Lake provide the preferred habitat of Longnose Suckers (Varley and Schullery Citation1998).
Historical comparison
Diet item frequency of occurrence differed in the Brown and Graham (Citation1954) and 2018 diets, which may be due to a variety of factors. A size-specific shift cannot explain the variance in diet composition observed between Brown and Graham (Citation1954) and our study as the total lengths of Longnose Suckers sampled were consistent between the studies. However, different sampling locations may be attributed to the variation in diet composition between Brown and Graham (Citation1954) and our study. The Brown and Graham (Citation1954) study sampled diets from the mouths of two tributary streams, whereas we sampled diets from the lake proper. The difference in sampling location may explain the lack of copepods and cladocerans in the Brown and Graham (Citation1954) diets. Copepods and cladocerans are found in lentic water habitats such as ponds and lakes (Ebert Citation2005; Boxshall and Defaye Citation2008); Longnose Suckers sampled from the lake proper likely fed on zooplankton because copepods and cladocerans are abundant in Yellowstone Lake. Suckers sampled from the tributary streams did not feed on zooplankton because zooplankton may be less available in the tributaries. In Yellowstone National Park, approximately 20 coleopteran species have been identified, but they have not been widely collected in aquatic environments (Roemhild Citation1994). Thus, the possibility exists that the coleopterans observed in Longnose Sucker diets sampled in the Brown and Graham (Citation1954) study were of terrestrial origin and fell into the tributary streams. Dipterans are found in extremely varied habitats encompassing lentic and lotic water habitats (Pinder Citation1995), explaining why this diet item was present in over 50% of diets from Brown and Graham (Citation1954) and our study.
We hypothesize that changes between Biesinger (Citation1961) (sampled fishes in Yellowstone Lake proper) and contemporary diets might be due to another non-native fish, the piscivorous Lake Trout. Non-native Lake Trout introduction altered the ecosystem structure and function in Yellowstone Lake and other water bodies (Tronstad et al. Citation2010; Ellis et al. Citation2011). This effect is apparent in Yellowstone Lake, where Lake Trout invasion caused a four-level trophic cascade resulting in a zooplankton assemblage dominated by small copepods to an assemblage with higher abundance and biomass of larger species (Tronstad et al. Citation2010). The shift in zooplankton assemblage resulted in a decrease in benthic algae biomass.
If Lake Trout attributed to the variance in diet composition between Biesinger (Citation1961) and our study, we expect to see that the dominant food items identified in Lake Trout and Yellowstone Cutthroat Trout diets (i.e. amphipods) (Syslo et al. Citation2016) would result in a decrease in the frequency of overlapping diet items in Longnose Sucker. Amphipod frequency of occurrence decreased in diets of Longnose Suckers sampled from the lake in 2018 compared to those in the Biesinger (Citation1961) study. Larger-bodied zooplankton (cladocerans) were found more frequently than small copepods in diets of Longnose Suckers sampled from the lake in 2018 as well. Thus, the Lake Trout-induced trophic cascade that altered the relative abundances of aquatic invertebrates could have altered invertebrate availability for consumption by the Longnose Suckers.
Conclusion
No comprehensive study existed researching Longnose Sucker diets sampled from Yellowstone Lake, thus, this study provides novel information describing Longnose Sucker diet composition and feeding ecology. Examining the feeding habits of non-native fishes is critical for determining the ecological effects of species introductions and competition between introduced species and native species (Syslo et al. Citation2016). Here, we expanded the knowledge of Longnose Sucker ecology and added to the limited research existing on Longnose Suckers. Plans exist to include this research in food-web and Ecopath (Christensen and Walters Citation2004) modelling that will be integrated into further research in Yellowstone Lake.
Acknowledgements
The authors would like to thank all of those who provided assistance in the field or laboratory. Any use of trade, firm or product names is for descriptive purposes only and does not imply endorsement by the US Government. This study was performed under the auspices of Montana State University institutional animal care and use protocol 2018-72.
Disclosure statement
All authors declare no conflict of interest or involvement in any organization or entity with any financial or non-financial interest in the subject matter or materials discussed in this manuscript.
Data availability statement
The data that support the findings of this study are available with permission from the authors. Restrictions apply to the availability of these data, which were used under license for this study.
Additional information
Funding
Notes on contributors
Kaitlyn M. Furey
Kaitlyn M. Furey is Former laboratory technician for Yellowstone Lake diet study at Montana State University.
Hayley C. Glassic
Hayley C. Glassic is a PhD student researching management and food web structure in Yellowstone Lake.
Christopher S. Guy
Christopher S. Guy is a Montana Cooperative Fishery Research Unit Assistant Unit Leader and Research Fish Biologist.
Todd M. Koel
Todd M. Koel is a Senior Fisheries Biologist Yellowstone Center for Resources.
Jeffrey L. Arnold
Jeffrey L. Arnold is a Former Aquatic Ecologist, Yellowstone Center for Resources. Currently an Aquatic Ecologist, Glen Canyon National Recreation Area.
Philip D. Doepke
Philip D. Doepke is a Fisheries Biologist, Yellowstone Center for Resources.
Patricia E. Bigelow
Patricia E. Bigelow is a Fisheries Biologist, Yellowstone Center for Resources.
References
- Ahlgren MO. 1990. Diet selection and the contribution of detritus to the diet of the juvenile white sucker. Can J Fish Aquat Sci. 47(1):41–48.
- Amundsen PA, Gabler HM, Staldvik FJ. 1996. A new approach to graphical analysis of feeding strategy from stomach contents data-modification of the Costello (1990) method. J Fish Biol. 48(4):607–614.
- Biesinger KE. 1961. Studies on the Relationship of the Redside Shiner (Richardsonius balteatus) and the Longnose Sucker (Catostomus catostomus) to the Cutthroat Trout (Salmo clarki) Popluation in Yellowstone Lake [MS thesis]. Logan (UT): Utah State University. https://digitalcommons.usu.edu/etd/331.
- Bowen SH. 1981. Digestion and assimilation of periphytic detritial aggregate by Tilapia mossambica. Trans Am Fish Soc. 110 (2):239–245.
- Boxshall GA, Defaye D. 2008. Global diversity of copepods (Crustacea: Copepoda) in freshwater. Hydrobiologia. 595(1):195–207.
- Brown CJD, Graham RJ. 1954. Observations on the Longnose Sucker in Yellowstone Lake. Trans Am Fish Soc. 83(1):38–46.
- Carl GC. 1937. Food of the coarse-scaled sucker (Catostomus commersoni Girard). J Biol Board Can. 3(1):20–25.
- Chipps SR, Garvey JE. 2007. Assessment of diets and feeding patterns. In: Guy CS, Brown ML, editors. Analysis and interpretation of freshwater fisheries data. Bethesda (MD): American Fisheries Society; p. 473–514
- Christensen V, Walters CJ. 2004. Ecopath with Ecosim: methods, capabilities and limitations. Ecol Modell. 172(2–4):109–139.
- Cribari-Neto F, Zeileis A. 2010. Beta regression in R. J Stat Soft. 34(2):1–24.
- Darnell RM. 1967. The organic detritus problem. In: Lauff GH, editor. Estuaries. Washington (D.C.): American Association for the Advancement of Science; p. 397–407.
- Ebert D. 2005. Ecology, epidemiology, and evolution of parasitism. In: Daphnia [Internet]. Bethesda (MD): National Center for Biotechnology Information (US). Chapter 2, Introduction to Daphnia Biology. https://www.ncbi.nlm.nih.gov/books/NBK2042/.
- Ehrlich PR. 1986. Which Animal Will Invade? In: Mooney HA, Drake JA, editors. Ecology of biological invasions of North America and Hawaii. New York (NY): Springer; p. 79–95.
- Ellis BK, Stanford JA, Goodman D, Stafford CP, Gustafson DL, Beauchamp DA, Chess DW, Craft JA, Deleray MA, Hansen BS, et al. 2011. Long-term effects of a trophic cascade in a large lake ecosystem. Proc Natl Acad Sci USA. 108(3):1070–1075.
- Forbes SA, Egerton FN. 1888. On the food relations of fresh-water fishes. In: History of ecology. New York (NY): Arno Press; p. 437.
- Giller PS. 1984. Community structure and the niche. Dordrecht: Springer.
- Harned WB. 1981. The early life histories of Longnose and White Suckers in Upper Sunshine Reservoir in Wyoming [MS thesis]. Laramie (WY): University of Wyoming.
- Havel JE, Kovalenko KE, Thomaz SM, Amalfitano S, Kats LB. 2015. Aquatic invasive species: challenges for the future. Hydrobiologia. 750(1):147–170.
- Kaeding LR, Koel TM. 2011. Age, growth, maturity, and fecundity of Yellowstone Lake Cutthroat Trout. Northwest Sci. 85(3):431–444.
- Kaplinski MA. 1991. Geomorphology and geology of Yellowstone Lake, Yellowstone National Park, Wyoming. Flagstaff (AZ): Northern Arizona University.
- Koehler FE. 1979. Life history studies of the Longnose Sucker, Catostomus catostomus, and the White Sucker, Catostomus commersoni, in Nearshore Eastern Lake Michigan Near Ludington, Michigan [MS thesis]. East Lansing (MI): Michigan State University.
- Koel TM, Mahony DL, Kinnan KL, Rasmussen C, Hudson CJ, Murcia S, Kerans BL. 2006. Myxobolus cerebralis in Native Cutthroat Trout of the Yellowstone Lake Ecosystem. J Aquat Anim Health. 18(3):157–175.
- Koel TM, Tronstad LM, Arnold JL, Gunther KA, Smith DW, Syslo JM, White PJ. 2019. Predatory fish invasion induces within and across ecosystem effects in Yellowstone National Park. Sci Adv. 5(3):eaav1139.
- Lewis VP, Peters DS. 1984. Menhaden – A single step from vascular plant to fishery harvest. J Exp Mar Biol Ecol. 84(1):95–100.
- Macphee C. 1960. Postlarval development and diet of the largescale sucker, Catostomus macrocheilus, in Idaho. Copeia. 1960(2):119–125.
- Morgan LA, Shanks IC, Lovalvo DA, Johnson SY, Stephenson WJ, Pierce KL, Harlan SS, Finn CA, Lee G, Webring M, et al. 2003. Exploration and discovery in Yellowstone Lake: results from high-resolution sonar imaging, seismic reflection profiling, and submersible studies. J Volcanol Geotherm Res. 122(3–4):221–242.
- Moyle PB, Light T. 1996. Biological invasions of fresh water: empirical rules and assembly theory. Biol Conserv. 78(1–2):149–161.
- Odum WE. 1970. Utilization of the direct grazing and plant detritus food chains by the stiped mullet Mugil cephalus. In: Steele JH, editor. Marine food chains. Berkeley (CA): University of California Press; p. 397–407.
- Pimentel D, Zuniga R, Morrison D. 2005. Update on the environmental and economic costs associated with alien-invasive species in the United States. Ecol Econ. 52(3):273–288.
- Pinder LCV. 1995. The habits of chironomidae larvae. In: Armitage PD, Cranston PS, Pinder LCV, editors. The Chironomidae: biology and ecology of non-biting midges. Dordrecht: Springer; p. 107–135
- R Core Team. 2019. R: a language and environment for statistical computing. Vienna: R Foundation for Statistical Computing. http://www.R-project.org/.
- Rawson DS. 195l. Studies of the fish of Great Slave Lake. J Fish Res Bd Can. 8b(4):207–240..
- Rawson DS, Elsey CA. 1950. Reduction in the Longnose sucker population of Pyramid Lake, Alberta, in an attempt to improve angling. Trans Am Fish Soc. 78(1):13–31.
- Ricciardi A, Rasmussen JB. 1999. Extinction rates of North American freshwater fauna. Conserv Biol. 13(5):1220–1222.
- Roemhild G. 1994. Aquatic insects and the fires of 1988. Yellowstone Sci. 2(2):2–4. https://www.nps.gov/yell/learn/upload/YS_2_2_sm.pdf.
- Simberloff D. 2013. Invasive species: what everyone needs to know. Oxford: Oxford University Press. http://choicereviews.org/review/10.5860/CHOICE.51-3236.
- Syslo JM, Guy CS, Koel TM. 2016. Feeding ecology of native and nonnative salmonids during the expansion of a nonnative apex predator in Yellowstone Lake, Yellowstone National Park. Trans Am Fish Soc. 145(3):476–492.
- Tronstad LM, Hall RO, Koel TM, Gerow KG. 2010. Introduced Lake Trout produced a four-level trophic cascade in Yellowstone Lake. Trans Am Fish Soc. 139(5):1536–1550.
- Varley JD, Schullery P. 1998. Yellowstone fishes: ecology, history, and angling in the Park. Mechanicsburg (PA): Stackpole Books.
- Wilcove DS, Rothstein D, Dubow J, Phillips A, Losos E. 1998. Quantifying threats to imperiled species in the United States: assessing the relative importance of habitat destruction, alien species, pollution, overexploitation, and disease. BioScience. 48(8):607–615.
- WWF. 2016. Living Planet Report 2016: risk and resilience in a new era. Gland, Switzerland: WWF International.