
 ?Mathematical formulae have been encoded as MathML and are displayed in this HTML version using MathJax in order to improve their display. Uncheck the box to turn MathJax off. This feature requires Javascript. Click on a formula to zoom.
Abstract
Understanding the relationship between benthic macroinvertebrates and environmental variables is the first step toward establishing sustainable freshwater ecosystems in terms of biodiversity, and this knowledge can be applied in river management. We analyzed major environmental variables that affect biotic communities on the national scale in the Republic of Korea. To achieve this goal, 2647 sampling stream sites were surveyed from 2016 to 2018 to collect benthic macroinvertebrates and measure 14 environmental variables. We identified a total of 359 taxa, belonging to 32 orders in 9 classes of 5 phyla, most of which were aquatic insects including Ephemeroptera, Odonata, Plecoptera, Coleoptera, Diptera and Trichoptera. Two-way indicator species analysis (TWINSPAN) based on biotic communities divided the sampling sites into six groups. Discriminant analysis identified gradient, streambed substrates, velocity, biological oxygen demand (BOD) and altitude as the major environmental variables that distinguished each TWINSPAN group. In addition, stream order and stream width also influenced aquatic macroinvertebrate communities, but the influence was low. The indicator taxa in each group were gradually changed from sensitive organisms preferring high altitudes, fast velocities and coarse substrates to tolerant organisms preferring low altitudes, slow velocities and fine substrates in each group from one to six. Canonical correspondence analysis confirmed that the composition of benthic macroinvertebrate communities in the Republic of Korea was dependent on stream gradient, microhabitat, organic pollution and geographical feature rather than on stream size or other water quality variables. Our study identified variables affecting the overall distribution patterns of biotic communities on a national scale and provides useful information for conservation and management of stream ecosystems in the Asian monsoon region.
Introduction
Freshwater ecosystems are rich in biodiversity relative to their size as they harbor about 10% of the world’s known species, while covering only about 0.8% of the Earth’s surface (Dudgeon et al. Citation2006; Strayer and Dudgeon Citation2010). Among the various freshwater ecosystems (e.g. rivers, lakes and wetlands), stream ecosystems change their natural structure and function continuously as water flows from source to mouth according to the river continuum concept (Vannote et al. Citation1980; Allan and Castillo Citation2007). These continuously changing environments accompanied by changes in biotic communities, are inhabited by a variety of organisms and consequently act as major factors in increasing biodiversity.
Rapid industrialization and urbanization in relation to economic growth in Asia have increased the use and development of land in river basins, which in turn has destroyed habitats and worsened ecological integrity reducing the biodiversity of stream ecosystems (De Silva et al. Citation2007; Bazinet et al. Citation2010; Cuffney et al. Citation2010; Vörösmarty et al. Citation2010). Efforts were made to establish various conservation and management strategies to maintain a sustainable stream ecosystem and biodiversity (Bucher et al. Citation1997), but they have been constrained because of our limited knowledge about restoration ecology (Dudgeon Citation2000; Strayer Citation2006). In particular, the stream ecosystems in the East Asian monsoon region are taxonomically diverse and home to many endangered and endemic species (Dudgeon et al. Citation2006; Strayer Citation2006; Jiang et al. Citation2010). Nevertheless, research on biodiversity and ecology of these ecosystems has been lagging compared with that in Europe or the United States (Dudgeon et al. Citation2006; Jiang et al. Citation2010; Li, Cai, et al. Citation2012; Li, Chung, et al. Citation2012; Jun et al. Citation2016).
Understanding the relationship between biotic communities and environmental variables can help to predict the community’s response to artificial disturbances (Jun et al. Citation2016). In addition, identifying the environmental variables affecting the distribution of biotic communities will reveal: (1) the priorities in the selection of a reference stream for its biodiversity, (2) major variables needed to assess the integrity of stream ecosystems and (3) variables to be considered first in stream biodiversity restoration. Because biotic communities may differ between stream types (Johnson et al. Citation2007), the priority of scientific and practical approaches to conservation and restoration of stream ecosystems is to establish ecological information between biological distribution and environmental variables based on research conducted on a national scale (Dudgeon Citation2000; Strayer Citation2006; Jun et al. Citation2016). This information will then help to identify the detailed characteristics of biotic communities in relation to stream type. To that end, research has been conducted on environmental variables that have a major influence on biological distribution of aquatic macroinvertebrates, with a primary focus on the restoration of biodiversity (Sandin Citation2003; Merz and Ochikubo Chan Citation2005; Jiang et al. Citation2010; Li, Cai, et al. Citation2012; Li, Chung, et al. Citation2012; Jun et al. Citation2016; Kim et al. Citation2016).
Benthic macroinvertebrates are influenced by various environmental variables based on species diversity (Rabeni and Minshall Citation1977; Rosenberg and Resh Citation1993) and have shown distinct differences in the preferred habitat as each taxon adapts to a given environment (Shearer et al. Citation2015). Because of these characteristics, benthic macroinvertebrates have long been used as indicator organisms for biological assessment of streams (Rosenberg et al. Citation1986; Karr Citation1999; Smith et al. Citation1999) and are useful for short- and long-term monitoring of water quality (Hynes Citation1970; Rosenberg and Resh Citation1993).
Therefore, we analyzed the relationship between benthic macroinvertebrates and environmental variables surveyed on the national scale of the Republic of Korea. Previous studies in the Republic of Korea examined environmental variables with a major influence on the distribution of benthic macroinvertebrates on the national scale (Li, Cai, et al. Citation2012; Li, Chung, et al. Citation2012; Jun et al. Citation2016), but those were mostly based on data collected during a single season (usually spring) or only one year, or they used only four environmental variables (Park et al. Citation2007). Therefore, we (1) included more sampling sites, (2) collected long-term survey data over a period of 3 years and (3) inspected 14 environmental variables, more than in previous studies, to identify the main environmental variables leading to changes in biotic communities. The specific goals of this study were to select and characterize the environmental variables that influence the distribution of biotic communities. We expect that these findings will provide useful information in terms of the distribution of freshwater benthic macroinvertebrates in the Asian monsoon region, biodiversity conservation and management measures of stream ecosystems and predictions of human disturbances on lotic ecosystems.
Materials and methods
Study area
This study was conducted on the mainstreams, tributaries and other independent streams of five major river watersheds (Han, Nakdong, Geum, Yeongsan and Seomjin rivers) in the Republic of Korea, using a total of 2647 sampling sites (6025 sampling units; ). A detailed description of the characteristics of each watershed is given in Hwang et al. (Citation2011).
Figure 1. Location of the 2647 sampling sites (gray circles) in the Republic of Korea. Black thick lines indicate the four major river (Han, Nakdong, Geum and Yeongsan-Seomjin) watersheds. Thin blue lines in each black line indicate the main, tributary and other independent streams of each watershed.
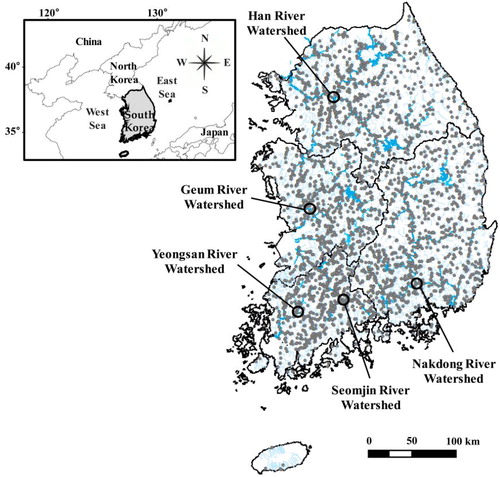
The Republic of Korea is located between 37°00′ N latitude and 127°30′ E longitude and has four distinct seasons influenced by the continent in the north and the surrounding oceans (Lee et al. Citation2005). Precipitation in the summer monsoon period resulting from geographic location and accounts for about 60% to 70% of annual precipitation; severe flooding is frequent and depends on the intensity and frequency of precipitation (Lee et al. Citation2011; Jun et al. Citation2016).
The total area of the Republic of Korea is approximately 1,00,339 km2, and the topography consists mostly of mountainous areas (about 60% of the total land area; Kim et al. Citation2017). High mountains with steep gradients are located in the eastern region, and lowland plains are concentrated in the western region of the country (Lee et al. Citation2011; Li, Cai, et al. Citation2012; Li, Chung, et al. Citation2012). Owing to these topographical characteristics, mountain streams at high or low altitudes are spread over a wider area compared with lowland plain streams (Bae et al. Citation2003).
Data collection
Data were collected from 2016 to 2018 through the Nationwide Aquatic Ecological Monitoring Program conducted by the Ministry of Environment and the National Institute of Environmental Research. The sampling of benthic macroinvertebrates and measurements of environmental variables followed the guideline of the Ministry of Environment and National Institute of Environmental Research (Citation2013). At each sampling site, the benthic macroinvertebrates were collected by quantitative sampling mainly from fast-flowing riffle or glide-run habitats (when suitable riffles were unavailable) within 100 m using a Surber sampler (30 cm × 30 cm, 1 mm mesh). Quantitative sampling was conducted by collecting three replicates (0.27 m2 of habitat for each sampling unit) in spring and autumn at each site (some locations were sampled only once either in spring or autumn). The collected samples of three replicates were placed in one collection bottle and fixed in 95% ethanol, and then transferred to the laboratory, where they were sorted from detritus and inorganic materials and stored in 80% ethanol. All specimens were identified at the species level if possible, but taxa with limited taxonomic information (e.g. Oligochaeta, Hemiptera, Coleoptera and Diptera) were identified at the genus or family level (Yoon Citation1995; Kwon et al. Citation2001). Functional feeding groups (FFGs) were assigned for each taxon following Merritt and Cummins (Citation1996) and Ro and Chun (Citation2004). The number of collected individuals for each taxon was recorded and converted to individual abundance per square meter.
Environmental variables were measured at each sampling site before sampling of benthic macroinvertebrates. A total of 14 environmental variables were measured and classified into five categories: stream size, gradient, microhabitat, water chemistry and geographical feature. The stream order (Strahler Citation1957) corresponding to the stream size was assessed using a 1:120,000-scale map. Stream width was measured as the distance from bank to bank by a laser range finder (Bushnell Inc., Overland Park, KS, USA) at three sampling points per sampling site, and then averaged. Altitude was measured for each stream gradient using a GPS unit (Triton 500; Magellen Inc., San Dimas, CA, USA) at representative sampling point per sampling site, and gradient was obtained by applying the method described by Min et al. (Citation2019) using ArcGIS (version 10.2; ESRI, Redlands, CA, USA). All microhabitat variables were measured at three sampling points per sampling site, and then averaged. Velocity was measured by using a flow meter (Flow-Mate Model 2000 or 3000-LX; Swoffer Instruments, Inc., Tukwila, WA, USA) or calculated by applying the Craig method (Craig Citation1987). Water depth was defined as the vertical distance from the water surface to streambed substratum. Substratum was initially classified into five types (boulder, cobble, pebble, gravel, sand) according to the criteria proposed by Cummins (Citation1962), and it was estimated with the naked eye and the ratio of streambed area to each sampling point area was measured. Subsequently, the sand or fewer particles (2 mm or less) were regarded as fine particles and others were coarse particles and only fraction of fine particles were obtained at each sampling point. Thus, it was tested whether the substratum itself, rather than the type of substratum, influences the biological distribution. Water chemistry variables were also measured at each sampling point. All water chemistry variables were measured once at a representative point per sampling site. Water temperature, dissolved oxygen (DO), pH and turbidity were measured using a multi-probe portable meter (e.g. YSI 6920; YSI, Inc., Yellow Springs, OH, USA) or U-22XD (Horiba, Kyoto, Japan). Biochemical oxygen demand 5-day test [biological oxygen demand (BOD)], total nitrogen (TN) and total phosphorus (TP) were obtained from stream water collected at the sampling points and using standard methods (APHA Citation2001). The degree of organic pollution by BOD and nutritional status by TN and TP were classified according to the criteria of Sládeček (Citation1969) and Dodds et al. (Citation1998), respectively.
Data analysis
First, benthic macroinvertebrates were analyzed by hierarchical cluster analysis using two-way indicator species analysis (TWINSPAN; Hill Citation1979). The results of clustering analysis may vary depending not only on the algorithm but also on its interpretation of the appearance characteristics (e.g. frequency or individual abundance) of organisms. We aimed to identify environmental variables that have a major influence on biological distribution, as well as the range of organisms preferring specific environmental factors. Therefore, sampling sites were grouped by clustering analysis based on individual abundance that could reflect the appearance features of organisms that appeared intensively are abundant in a specific habitat. Then, statistically significant differences in biotic communities and environmental variables were identified by one-way ANOVA for each TWINSPAN group.
The 14 environmental variables were subjected to discriminant analysis to reveal those that affected the distribution of biotic communities within each TWINSPAN group. Discriminant analysis uses a discriminant function that separates each group by means of information about existing groups to find a linear combination that maximizes the variance-covariance matrix between groups, while minimizing the variance-covariance matrix within groups. In this process, the relative influence of environmental variables that distinguish TWINSPAN groups is identified. Environmental variables that were not significant according to one-way ANOVA were excluded from the analysis.
Indicator species analysis (Dufrêne and Legendre Citation1997) was used to examine the potential indicator species according to distribution weights for each TWINSPAN group. Indicator values expressed in the range of 0 to 100 for each species were calculated by multiplying the relative individual abundance and relative frequency of occurrence in each group. The sum of relative individual abundance is 100, but the sum of relative frequency of occurrence is not 100; therefore, the indicator value can never reach 100 (Kim et al. Citation2017). Therefore, species that did not appear in other groups or had higher indicator values were selected as indicator species within each TWINSPAN group. To minimize the bias in the selection of indicator species caused by low indicator value due to low individual abundance or low frequency (or both), taxa above the minimum genus level were included in the indicator species analysis. In addition, a Monte Carlo test was used to examine whether the indicator value was statistically significant, and non-significant species were excluded from the indicator species even if the former condition was satisfied.
Canonical correspondence analysis (CCA; Ter Braak Citation1986) was used to analyze relationships between the distribution of indicator species in each TWINSPAN group and environmental variables as well as to identify environmental variables that best distinguish the indicator species from each group. Pearson correlation analysis was conducted to identify environmental variables highly correlated with each axis of the CCA, and the Monte Carlo test was used to examine the correlation between the distribution of indicator species and CCA results.
Individual abundance used for statistical analysis was ln(x + 1)-transformed to downweigh the effect of dominant taxa by a particular taxon (e.g. Oligochaeta, Chironomidae and Baetidae; Jun et al. Citation2016). Similarly, among the environmental variables, stream width, altitude, turbidity, BOD, TN and TP were ln(x + 1)-transformed, whereas the remaining variables were used as raw data. TWINSPAN, indicator species analysis and CCA were conducted using PC-ORD version 6.19 (MjM Software, Gleneden Beach, OR, USA), and one-way ANOVA, Pearson correlation analysis and discriminant analysis were run in PASW for Windows 8 version 6.3 (SPSS, Inc., Chicago, IL, USA).
Results
Overview of environmental characteristics and benthic macroinvertebrates diversity at sampling sites
Given that this study was conducted on streams distributed nationwide, the sampling sites were located in streams that ranged from small to large, high and steep to low and gentle and clean to polluting (). The mean and median of environmental variables were closer to the minimum values than to the maximum values of each variable, indicating that in the Republic of Korea streams were mostly lowland wadeable streams (Kim et al. Citation2017) with gentle gradients. In addition, most of stream’s water depth of the microhabitat was shallow and substratum was coarse, but velocity was low due to low gradient. Most of the Republic of Korea’s geology consists of granite, and limestone is found only in some upstream areas of the Namhan River (Yun and Moon Citation2009); hence, the pH, which is mainly affected by geology, was mostly less than 8. Based on the overall average the water was classified as oligosaprobic (Sládeček Citation1969) based on BOD, mesotrophic (Dodds et al. Citation1998) based on TP, and eutrophic based on TN; therefore, the level of contamination was low, but the trophic state was high.
Table 1. Summary of environmental variables representing physical and chemical property of all sampling sites.
A total of 359 taxa (22 families, 30 genera, 307 species), belonging to 32 orders in 9 classes of 5 phyla, were collected in all sampling sites (). Most of the taxa belonged to aquatic insects (79.9%), including Ephemeroptera, Plecoptera and Trichoptera (EPT) taxa (Lenat Citation1988), Odonata, Coleoptera and Diptera. Among other groups of aquatic organisms outside Insecta, Mollusca (10.0%), Malacostraca (5.5%) and Annelida (3.1%) showed the greatest taxa richness and individual abundance. Mollusca, Ephemeroptera, Diptera and Trichoptera were the dominant taxa. Individual abundance and frequency of occurrence of Pleuroceridae, Baetidae, Heptageniidae, Chironomidae and Hydropsychidae were especially high. Among them, Baetidae (89.3%) and Chironomidae (98.6%) were the most prevalent taxa in the Republic of Korea because of their very high frequency of occurrence. Taxa richness of Platyhelminthes, Annelida and Malacostraca was low, but individual abundance, and frequency of occurrence were high because of Planariidae, Tubificidae, Asellidae and Atyidae. Plecoptera and Megaloptera showed low taxa richness, individual abundance, and frequency of occurrence, indicating that their preference for certain habitats or microhabitats is more pronounced compared with that of other taxa.
Table 2. Taxa richness, individual abundance and frequency of occurrence of benthic macroinvertebrates in 2647 sampling sites.
Classification of sampling sites based on benthic macroinvertebrate communities
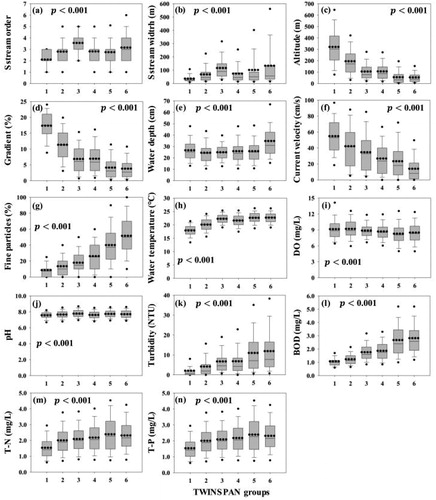
Based on the benthic macroinvertebrate communities, the 2647 sampling sites were classified into two groups (groups 1 to 4 and 5 to 6) at division level 1, and these two groups were further subdivided into six groups at division levels 2 and 3 (). Each TWINSPAN group was classified according to the geographic location of the streams and their corresponding physical and chemical properties. At division level 1, sampling sites were mainly divided into natural and urban streams; at division levels 2 and 3, they were subdivided based on stream size, gradient, certain microhabitat variables, water chemistry and geographical feature. Although all environmental variables showed statistically significant differences (p < 0.001) according to the one-way ANOVA for each TWINSPAN group, there were no distinct changes in stream order, stream width, water depth, water temperature, DO or pH (). In contrast, altitude, gradient and velocity were clearly decreasing and substratum, turbidity, BOD, TN and TP were increasing for each TWINSPAN group.
Figure 2. Two-way indicator species analysis (TWINSPAN) of the 2647 sampling sites based on benthic macroinvertebrate communities. The level represents division level of TWINSPAN and the numbers in parentheses indicate the number of sampling sites.
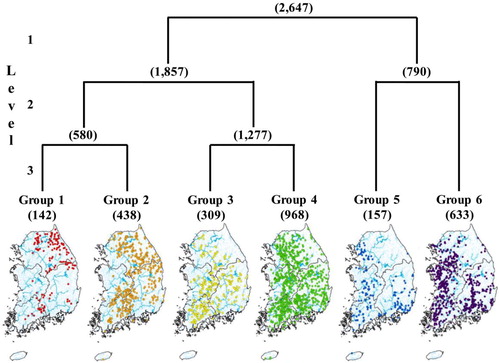
Figure 3. Distribution of each environmental variable for two-way indicator species analysis (TWINSPAN) clustering groups. (a) Stream order, (b) stream width, (c) altitude, (d) gradient, (e) water depth, (f) velocity, (g) fraction of fine particles in substrates, (h) water temperature, (i) dissolved oxygen (DO), (j) pH, (k) turbidity, (l) biological oxygen demand 5-day test (BOD), (m) total nitrogen (TN), (n) total phosphorus (TP). The boxes represent the 25th and 75th percentiles, and the whiskers indicate the 5th and 95th percentiles with standard deviations (error bar). The horizontal dotted lines and solid lines in each box represent the mean and median, respectively. All environmental variables showed statistically significant differences (p < 0.001) in each group according to one-way analysis of variance.
Groups 1 to 4 were characterized by faster velocity, coarser substratum and lower water temperature because of higher altitude and steep gradients; they were also less contaminated owing to lower turbidity, BOD, TN and TP compared with groups 5 and 6 (). Groups 1 to 4 included either highland (group 1) or lowland (groups 2 to 4) wadeable streams, but some lowland non-wadeable streams (part of group 3) were also present. Organic pollution and trophic state of the streams were classified into oligosaprobic, eutrophic and mesotrophic based on the mean BOD, TN and TP. Most of the streams in groups 5 and 6 were lowland wadeable streams, but some were lowland non-wadeable streams. Based on their organic pollution and trophic state, they were classified into oligosaprobic, β-mesosaprobic and eutrophic as inferred from the mean BOD, TN and TP values.
Most of the sampling sites in group 1 were concentrated on the east side of the Han River watershed, with many upstream sources located in high mountains. Accordingly, the streams were of the smallest size, altitude and gradient were the highest, velocity was the fastest, substratum was coarse and pollution and trophic state were the lowest; at the absolute level, the trophic states were high. Subsequently, as the size of the group increased (from group 1 to 4), the altitude, gradient and velocity decreased, whereas, the fine particles in substrates, turbidity, BOD, TN and TP increased. Other variables also differed from group to group, but there were no distinct changes in the increase or decrease, and group 3 had the highest proportion of relatively larger streams with groups 1 to 4. Group 4 comprised the largest number of sampling sites across all TWINSPAN groups, and the sampling sites were evenly distributed for each watershed. In addition, the mean and median of environmental variables in group 4 were approximations to the mean and median presented in compared with other groups, which can be considered that the most common sites in Korea streams were clustered into group 4. Groups 5 and 6 included many small streams flowing through cities in each watershed. Group 6 had the highest proportion of large-scale streams, such as 6th and 7th orders of streams, among all TWINSPAN groups, and it included many large rivers and streams interrupted by dams as well as estuaries. Thus, the stream size in this group was the largest, but the altitude and gradient were the lowest, velocity the slowest, and the proportion of fine particles in substrates as well as the degree of contamination were the highest. TWINSPAN groups and the distribution of associated environmental variables suggested that even if the stream size is small, their biotic communities may be similar to those of large-scale streams if both stream types share similar physical and chemical characteristics of microhabitats.
The distribution patterns of benthic macroinvertebrate communities were analyzed for each TWINSPAN group (). Insecta was analyzed by integrating taxa with similar distribution patterns because of the variety of taxa. The mean taxa richness and individual abundance of each group showed a decreasing tendency in EPT taxa, with Megaloptera, and an increasing tendency in Odonata-Hemiptera-Coleopter (OHC) taxa, which prefer a lentic environment such as slow velocities and well-developed riparian vegetation with Diptera (). The mean taxa richness and individual abundance of Mollusca, Annelida and Malacostraca tended to increase; the groups that were aggregated into others because taxa richness or individual abundance (or both) was low showed no distinct distribution. Although there were statistically significant differences between taxa in each TWINSPAN group according to one-way ANOVA, the community composition for each taxon changed gradually rather than discretely. Taxa with distinct distribution tended to depend on the overall increase or decrease in specific dominant taxa with higher taxa richness or individual abundance. Pleuroceridae, Viviparidae, Lymnaeidae, Physidae, Planorbidae, Tubificidae, Glossiphoniidae, Asellidae, Gammaridae, Atyidae, Coenagrionidae, Libellulidae, Corixidae, Haliplidae and Chironomidae were increasing gradually in order from group one to six, but Baetidae, Heptageniidae, Leptophlebiidae, Ephemerellidae, Nemouridae, Perlidae, Corydalidae, Rhyacophilidae, Glossosomatidae, Philopotamidae, Stenopsychidae and Hydropsychidae were decreasing. Especially, the individual abundance of Tubificidae and Chironomidae tended to increase steadily.
Figure 4. Distribution patterns of relative composition of benthic macroinvertebrates according to two-way indicator species analysis (TWINSPAN) groups. (a) Mean of taxa richness, (b) mean of individual abundance, (c) mean of taxa richness of functional feeding groups (FFGs), (d) mean of individual abundance of FFGs. All taxa showed statistically significant differences (p < 0.001) in each group according to one-way analysis of variance. EPMT = Ephemeroptera, Plecoptera, Megaloptera, Trichoptera. OHCD = Odonata; Hemiptera; Coleoptera; Diptera. Sh, shredders; Sc, scrapers; CF, collector-filterers; CG, collector-gatherers; Pe, predators; Pi, plant-piercers.
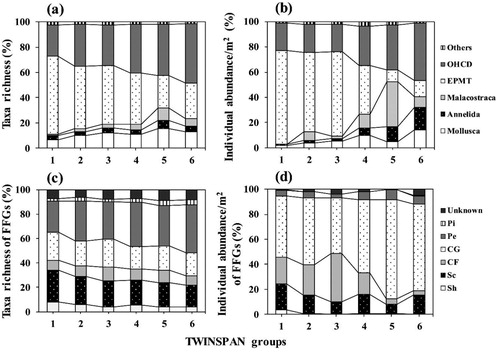
The mean taxa richness and individual abundance of the FFGs in each TWINSPAN group depended on the distribution patterns of taxa. Shredders and scrapers decreased as the Plecoptera and some upstream Trichoptera decreased in the order of group 1 to group 6, whereas collector-filterers, collector-gatherers and predators increased as Tubificidae, some Ephemeroptera, Odonata, Chironomidae and Hydropsychidae increased; plant-piercers and unknowns were not apparent ().
Environmental variables affecting the distributions patterns of benthic macroinvertebrate communities
The major environmental variables that distinguish each TWINSPAN group were selected by discriminant analysis (; ). Thirteen environmental variables were estimated to clearly distinguish each TWINSPAN group, and discriminant variables were statistically significant (). Among the estimated 13 environmental variables, gradient had the highest discriminant power, as indicated by the smallest in the Wilks’ lambda value, followed by variables such as fine particles in substrates, velocity, BOD and altitude. In addition, the results of the discriminant analysis indicated that stream gradient, microhabitat, organic pollution and geographical feature were the major variables involved in the change of benthic macroinvertebrate communities, rather than variables such as stream size, trophic states and inorganic pollution.
Figure 5. Discriminant analysis of six two-way indicator species analysis (TWINSPAN) groups and environmental variables explain the differences between the groups. Gray circles indicate each group (centroid) and gray arrows (structure matrix) represent relative contributions of environmental variables.
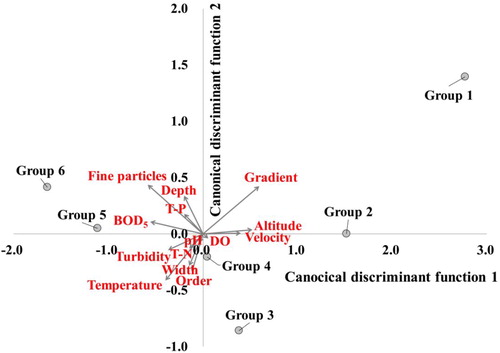
Table 3. Selection of environmental variables that distinguish each two-way indicator species analysis (TWINSPAN) group by discriminant analysis. Each step represents a priority based on the influence of environmental variables that distinguish TWINSPAN groups.
The centroids of canonical discriminant functions 1 and 2 were used to confirm the distribution of each TWINSPAN group and the relative importance of environmental variables (). Canonical discriminant functions 1 and 2 accounted for 81.4% and 13.1% of variance explained, respectively; these were mostly explained by function 1, but the results of the function test were statistically significant. The relative importance of environmental variables may be shown by a standardized canonical discriminant function coefficient, but it was confirmed by means of the structure matrix considering multicollinearity between environmental variables used in this study. The canonical discriminant function 1 classified the groups mainly by the gradient, fine particles in substrates, BOD, altitude and velocity; hence, Groups 1 to 4 were associated with high altitude, steep gradient, fast velocity, coarse substrate and low water pollution, whereas groups 5 and 6 were associated with low altitude, gentle gradient, slow velocity, fine substrate and high water pollution (). The canonical discriminant function 2 classified the groups mainly by stream order and width; hence, Groups 1 and 2, 5 and 6 were associated with small-scale streams, whereas groups 3 and 4 were associated with large-scale streams. Although group 6 had more large streams compared with other groups, of the 633 sampling sites included in group 6, only 62 were from large-scale streams, with most of them being located in small streams corresponding to first- or second-order streams. Therefore, group 6 was associated with small stream order and stream width based on canonical discriminant function 2.
All taxa of benthic macroinvertebrates collected in this study were integrated into the genus or family level, and indicator species analyzed for each TWINSPAN group (). When selecting the indicator taxa, we gave priority to taxa that appeared only in a particular group and those with predominant distribution (indicator values were high only in a specific group) were considered first. Taxa with wide or irregular distribution patterns across several groups and those with very low indicator values (frequency was mostly very low) were excluded, because they could not reasonably represent each group despite the statistically significant differences. According to the analysis, a total of 52 taxa (Mollusca, 3; Malacostraca, 2; Ephemeroptera, 13; Odonata, 8; Plecopterta, 7; Hemiptera, 1; Megaloptera, 2; Coleoptera, 4; Diptera, 3; Trichoptera, 9) of 257 taxa (235 genera, 22 families) were selected as the indicator taxa representing each group. Indicator taxa in groups 1 to 4 were generally susceptible to water pollution and preferred fast velocity and coarse substratum, whereas indicator taxa in groups 5 and 6 were tolerant of the pollution and preferred slow velocity and fine substratum.
Table 4. A total of 52 indicator taxa (49 genera and 3 families) selected for each clustering group by indicator species analysis. Less important taxa are not shown.
Compared with other groups, group 1 had the largest number of indicator taxa, which was especially attributed to the greater number of EPT taxa (Kamimuria, Rhithrogena, Cincticostella, Rhopalopsole, Amphinemura, Sweltsa and Pteronarcys appeared only in group 1, and habitats preferred by sensitive or cold-water (mainly preferring higher altitudes) taxa. The indicator taxa in group 3 were Rhoenanthus, Potamanthus, Elmidae, Psephenidae and Hydropsyche, which, unlike the indicator taxa in groups 1 and 2, appeared mainly in larger streams and preferred riffles. Indicator values for group 4 were lower compared with those in the other groups because of their low individual abundance and frequency. The indicator taxa in group 6 preferred lentic habitats with slow velocity and fine substrate particles, and they appeared mostly in the riparian vegetation zone.
The relationship between the 52 indicator taxa selected by the indicator species analysis and the 13 environmental variables derived from the discriminant analysis was evaluated using CCA (; ). Axis 1 was correlated with substratum (r = 0.642), BOD (r = 0.614), altitude (r = –0.595), gradient (r = –0.591) and velocity (r = –0.484), and axis 2 was correlated with distribution of indicator taxa for each plot based on stream order (r = –0.367) and stream width (r = –0.355). Accordingly, sensitive taxa (certain Baetidae, Heptageniidae, Ephemerellidae, Plecoptera and Hydropsychidae) preferring high altitudes, steep gradients, fast velocities and coarse substratum were generally located on the negative side along axis 1, whereas tolerant taxa (some Mollusca, Malacostraca, Odonata, Haliplidae, Chironomidae and Culicidae) preferring low altitudes, gentle gradient slopes, slow velocities and fine substratum were located on the positive side along axis 1. The indicator taxa of group 3, which had the largest streams among groups 1 to 4, were located on the negative, but indicator taxa of group 6 were located on the positive side along the axis 2, despite having the greater number of larger streams. Such clustering of group 6 was contributed to the greater impact of heavily polluted small streams in urban areas. The CCA thus confirmed that benthic macroinvertebrate communities were largely dependent on stream gradient, microhabitat, organic pollution and geographical feature.
Figure 6. Canonical correspondence analysis (CCA) relating 52 indicator taxa to 13 environmental variables. The plots present the ordination of (a) indicator taxa and (b) arrow length is proportional to the relative importance of each environmental variable.
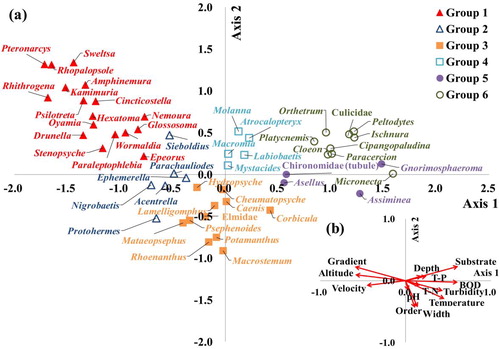
Table 5. Result of ordinations by canonical correspondence analysis (CCA) for 52 indicator taxa.
Discussion
Clustering and classification of sampling sites
There are various methods that can be used to analyze the relationship between biotic communities and environmental variables. Here, we implemented cluster analysis of sampling sites and multivariate statistical analysis (CCA or discriminant analysis) based on the site clustering groups (Quinn and Hickey Citation1990; Sandin Citation2003; Hwang et al. Citation2011). These methods may reveal the environmental conditions preferred by organisms with high frequency of occurrence or individual abundance, such as dominant taxa or indicator taxa in each clustering group, but they may fail to identify the environmental conditions preferred by all organisms. The latter can be achieved by directly clustering the detected taxa, rather than the sampling sites, to identify the relationships between grouped biotic communities and environmental variables. The obtained biotic groups are then classified based on major environmental variables that affect the distribution of biotic communities. However, since such an analysis involves clustering of organisms and conducting multivariate statistical analyses based on biotic cluster groups, it is necessary to separately calculate and apply the environmental variables corresponding to each taxon. Therefore, such a process involving clustering analysis of detected taxa may be tenuous and time-consuming in transforming the environment values based on sampling sites to corresponding to each taxon. However, clustering analysis of sampling sites has the advantage that only the form required by statistical analysis can be used without transformation to values corresponding to each taxon because the environment values based on the sites are used. For this reason, representatively, in the United Kingdom, assessment of freshwater ecosystem was developed through sampling site clustering based on benthic macroinvertebrate communities, furthermore, there have been attempts to classify stream types by clustering groups. In addition, there have been many attempts to classify streams by clustering sampling sites based on biotic communities. Holmes et al. (Citation1998) and Cowx et al. (Citation2004) classified United Kingdom stream types by clustering sampling sites based on aquatic plant and fish communities. Tison et al. (Citation2005) used diatoms to classify the hydro-ecoregions in France. Sandin (Citation2003) and Smith et al. (Citation1999) classified streams in Sweden and Australia, respectively, based on benthic macroinvertebrate communities. Thus, clustering sampling sites based on biotic communities and classifying streams by using derived results can be regarded as a process of identifying the relationship between biotic communities and environmental variables. In this respect, previous research proved that the clustering of sampling sites based on biotic communities can explain the overall distribution pattern of biotic communities according to environmental variables, which is why such analysis methods are commonly used.
Relationships between distribution patterns of biotic communities and environmental variables
We classified the streams distributed nationwide in the Republic of Korea into six groups based on benthic macroinvertebrate communities. Each group was classified mainly by variables corresponding to stream gradient, microhabitat, organic pollution and geographical feature rather than by stream size and types of water chemistry. Given that this study was conducted on a national scale, the distribution patterns of benthic macroinvertebrate communities were simultaneously affected by both regional (altitude and gradient) and local (velocity, substratum and BOD) variables rather than depending solely on specific spatial scale variables. The influence of environmental variables, as inferred by the discriminant analysis, increased in the order of gradient, substratum, velocity, BOD and altitude. Altitude and gradient are variables that have different characteristics, but generally, the gradients are steep at higher altitudes, and gentle at lower altitudes. However, water temperature is closely related to altitude; changes in altitude may change water temperature and thereby have a major impact on the distribution of cold or warm water organisms (Jacobsen et al. Citation1997). The gradient determines velocity, which in turn affects the substrate composition, and both variables modify the biotic communities by affecting the type of microhabitat (e.g. riffle, run and pool) (Olivero and Anderson Citation2008). Therefore, the two variables may exert different types of effects on organisms, even if they share common characteristics.
Most researchers on benthic macroinvertebrates and environmental variables have reported that some physical variables have a greater effect than do chemical variables (Nelson and Lieberman Citation2002; Li, Cai, et al. Citation2012; Li, Chung, et al. Citation2012; Jun et al. Citation2016). Typically, Sandin (Citation2003)’s study analyzed the relationship between benthic macroinvertebrates and various environmental variables based on stream survey data across Sweden, as in this study, and velocity and composition of substratum have been shown to have a great influence on distribution of biotic communities. Nelson and Lieberman (Citation2002) conducted a study on a smaller scale on the Sacramento River, regulated by three dams. In this study, the researchers speculated that changes in habitat, sediment composition, and discharge were major variables that change the biotic communities due to characteristics of regulated stream, and the result showed that velocity (habitat) was the major variable. In addition, studies by Jiang et al. (Citation2010) and Wright et al. (Citation1984) were similar to the results of this study, and Merritt and Cummins (Citation1996) used riffle and fool as the major habitat classifiers of benthic macroinvertebrate communities. In other studies, velocity and substratum composition are also considered to be the best predictors of benthic macroinvertebrate communities in streams because of their direct impact on microhabitats (Wright et al. Citation1984; Malmqvist and Mäki Citation1994; Cater and Fend Citation2001). Hence, research have been conducted on the velocity or substratum composition, which are mainly determined by gradient, and the biotic communities (Gore et al. Citation2001; Merz and Ochikubo Chan Citation2005). Typically, Shearer et al. (Citation2015) studied the habitat suitability for benthic macroinvertebrates according to velocity, substratum composition and water depth in small stream in New Zealand, and confirmed that there were differences in preferred range for each organism at the genus level. Velocity affects variables such as substrate composition, food availability and amount of DO. When the velocity is fast, the substrate composition is generally coarse, and more DO and organic matter are provided in a short time so, it influences on availability of food (Oliveira and Nessimian Citation2010). The stability and heterogeneity by coarse substratum are the primary local scale variables that determine biotic diversity and individual abundance of benthic macroinvertebrates in streams by providing shelter and spawning places as well as a growing environment for periphyton as food (Sandin Citation2003; Jiang et al. Citation2010). In addition, the composition of the substratum can affect the composition of benthic macroinvertebrate communities independently of water quality. For example, Merz and Ochikubo Chan (Citation2005) artificially increased the ratio of pebbles and cobbles (Cummins Citation1962) for spawning of salmon in the Mokelumne River; as the ratio of pebbles and cobbles were increased, the overall individual abundance of benthic macroinvertebrates increased. Jun et al. (Citation2016) pointed out the importance of substrate composition in terms of biodiversity and individual abundance; taxa richness and individual abundance decreased with increasing proportion of the fine substratum fraction even in streams with optimal water quality.
In some studies (Jiang et al. Citation2010; Li, Cai, et al. Citation2012; Li, Chung, et al. Citation2012; Jun et al. Citation2016), found that when the velocity was fast or streambed was coarse, the individual abundance of Ephemeroptera and Trichoptera was generally high, and this increase or decrease in certain taxa affected the distribution of FFGs (). In this study, the FFGs whose individual abundance depended on velocity and substratum composition were mainly collector-filterers and collector-gatherers, due to the changes of Oligochaeta (CG), Baetidae (CG), Chironomidae (CG) and Hydropsychidae (CF) were clear compared to other taxa. At this time, as the velocity became slower and substratum composition became finer, Baetidae decreased, but the rate of increase of Oligochaeta and Chironomidae was higher than the decrease rate of Baetidae, so collector-gatherers showing a tendency to increase overall. The individual abundance of Hydropsyche tended to increase and decrease from group 1 to 3, preferring fast velocity and coarse substratum. Oliveira and Nessimian (Citation2010) confirmed the distribution of FFGs in the Serra da Bocaina stream in Brazil, mainly according to the velocity and substratum composition, collector-gatherers and collector-filterers appeared as indicator organisms for fine and coarse substratum, respectively. In addition, the results of Merz and Ochikubo Chan (Citation2005), Nelson and Lieberman (Citation2002), Shearer et al. (Citation2015), implied that Hydropsychidae preferred fast velocity and coarse substratum, so collector-filterers would show a high individual abundance in that environment. These results suggest that regardless of the stream size, the velocity and composition of streambed are the major variables affecting the benthic macroinvertebrate communities in terms of taxa composition and functional groups.
Buss et al. (Citation2002) analyzed the relationship between benthic macroinvertebrates and changes in environmental variables due to urbanization and land use in the watershed of the Guapimirim River in Brazil. With the increase of pollutant sources in the watershed, BOD was a variable influencing the change of biotic communities, mainly in the EPT taxa, which is less resistant to pollution. Bazinet et al. (Citation2010) also analyzed the effect of water pollution in Ontario and Simcoe Lakes caused by urbanization of the watershed on benthic macroinvertebrates. Among the various chemical variables related to water quality, BOD tended to be higher at the point where urbanization was high, which consequently affected the diversity of EPT taxa. In addition, in both studies, the individual abundance of Chironomidae was high in the highly polluted stream and constituted most of the biotic communities. In this study, as BOD increased, the EPT taxa decreased, and the individual abundance of Chironomidae continued to increase. As such, BOD is a representative variable of organic pollution in streams and directly affects the sensitivity or tolerance of organisms. Consequently, even if a stream meets the physical requirements for certain benthic macroinvertebrates, high water pollution may restrict the influx of highly sensitive taxa and facilitate the spread and dominance of highly tolerant taxa (Boon Citation1988). In addition, organic pollution can transform the coarse streambed into a fine substratum due to the deposition of organic matter (Jun et al. Citation2016). Hence, chemical variables in addition to physical variables can have a large impact on biological distribution (Sandin Citation2003). Owing to these characteristics, tolerance values based on benthic macroinvertebrates have been used as a tool in the assessment of biological water quality of streams (Lenat Citation1988; Resh and Jackson Citation1993; Karr Citation1999; Smith et al. Citation1999). Typically, Germany had classified stream types based on physical variables and then used them for stream environment assessment by combining multimetric indices and a saprobic index based on BOD by stream types (Arle et al. Citation2014).
Mountainous areas cover most of the Republic of Korea (Bae et al. Citation2003), rendering altitude he major variable affecting the distribution of benthic macroinvertebrates. Altitude has previously been proposed as a potential determining variable for a variety of environmental variables, such as water temperature, hydrology, channel type and water quality, as well as for habitats (Beauchard et al. Citation2003), indirectly affecting the distribution of benthic macroinvertebrates (Jowett and Richardson Citation1990). Our study has associated altitude with changes in gradient, velocity, substrate composition, water temperature, turbidity, BOD, T-N and T-P (). This suggests that changes in altitude may be an important variable affecting the distribution of biotic communities by reflecting the structural and functional changes of streams in accordance with the river continuum concept defined in Vannote et al. (Citation1980). In addition, altitude is a factor closely related to water temperature as mentioned earlier. Water temperature is a variable that determines the growth, metabolism and life cycle of benthic macroinvertebrates, and can also affect energy flow in stream ecosystems (Chadwick and Feminella Citation2001; Daufresne et al. Citation2004; Harper and Peckarsky Citation2006). In this respect, Li, Cai, et al. (Citation2012) and Li, Chung, et al. (Citation2012) analyzed the relationship between biotic communities and water temperature in Xiangxi River where there was less artificial disturbances, considering water temperature as a representative variable to study of influence of climate change on benthic macroinvertebrates. As a result of the study, the taxa richness and individual abundance tended to gradually decrease as the annual average water temperature of the watershed increased, and the decreased taxa were mainly cold-water organisms sensitive to change in water temperature. This result implied that biodiversity decreases and taxa composition becomes simpler in specific regions by extinction of cold-water organisms due to increase in water temperature in the future (Daufresne et al. Citation2004; Li, Cai, et al. Citation2012; Li, Chung, et al. Citation2012). In this regard, water temperature is an important variable in determining the presence of cold-water organisms. However, in this study, water temperature differed by clustering groups, but it was not the major variable influence the distribution of biotic communities. This is believed to be due to the fact that the water temperature is not only seasonally affected, but also the daily difference in severe cases, which is a variable that changes greatly depending on the sampling period and time. Therefore, in order to accurately identify the distribution of biotic communities according to water temperature, sampling should be conducted on the same day, at the same time, but this is practically impossible. On the other hand, since the altitude is a variable with little change in the short and long term (Min et al. Citation2019), it is believed that is had a greater influence on the distribution of biotic communities than water temperature. In light of these results, altitude, along with latitude, is likely to be used as an indicator environment for cold-water organisms instead of water temperature.
Min et al. (Citation2019) and Vannote et al. (Citation1980) roughly classified stream types according to the stream size, and then confirmed the distribution of FFGs. Based on the individual abundance, shredders decreased and collectors increased from the upstream to the downstream, showing opposite results. In this study, similar to the previous two studies, stream size increased, overall shredders decreased and collectors increased (). In addition, in Min et al. (Citation2019), when the stream size became very large, collectors decreased, and in this study, the results were the same in groups 5 and 6, which included many larger sites compared to other groups. In this study, variables corresponding to the stream size, such as stream order and stream width, affected biological distribution, although their influence was low as indicated by high correlation with canonical discriminant function 2 in the discriminant analysis and axis 2 in the CCA. However, these results suggest that the stream size is also a potential determining variable for various environmental variables and may influence the distribution of biotic functional groups (Vannote et al. Citation1980; Jiang et al. Citation2010; Kim et al. Citation2017).
Land-use type and landscape in the watershed environment may also influence the biotic communities (Pan et al. Citation2004; Wang et al. Citation2006), but the effects on these variables were not considered in this study because water chemistry could consequently represent them (Buss et al. Citation2002; Booth et al. Citation2004; Bazinet et al. Citation2010; Cuffney et al. Citation2010; Kim et al. Citation2016). Most of the Republic of Korea’s geology is granite zone, and limestone zone appears only in some areas. Limestone zones were known to be more suitable for mollusks because they have higher concentrations of magnesium and calcium ions than granite zones, besides they have buffer action (Carrie et al. Citation2015). But in the Republic of Korea, geology has little influence on benthic macroinvertebrate communities (Min et al. Citation2019), so it was not considered in this study.
Considerations for establishing a sustainable freshwater ecosystem
Maintaining ecological integrity and sustainability are important steps in the conservation and enrichment of biodiversity in freshwater ecosystems (Jun et al. Citation2016). Understanding the complex interactions between biological communities and environmental factors at different spatial scales contributes to (1) the selection of reference streams to maintain ecological integrity and develop biological assessment techniques, (2) the prediction of effects artificial disturbances will have on biotic communities and (3) the implementation of freshwater ecosystem management in various ways.
In developed countries, reference streams are selected by applying various reference condition approaches specific to each country for the conservation and restoration of stream ecosystems (Bailey et al. Citation2004; Stoddard et al. Citation2008). For example, in the United States, national streams are into nine ecoregions, and then criteria for eight environmental variables are set for each ecoregion to select the reference streams for the corresponding ecoregions if the criteria are satisfied (USEPA Citation2013). In Europe, the whole region of the European Union is similarly divided into several ecoregions, criteria are set for reference conditions, and finally, reference streams are selected for each ecoregion (WFD Citation2000). Since then, the European Union not only selected and maintained the integrity of the reference streams but also assessed the integrity of stream ecosystems by developing biological indices based on the values of biotic communities and environmental variables in the reference streams (Wright et al. Citation1997; USEPA Citation2013; Arle et al. Citation2014). Representatively, the United Kingdom clustered sampling sites on benthic macroinvertebrate communities, and then selected the major environmental variables that distinguish each clustering group using multiple discriminant analysis (Wright et al. Citation1984). Finally, the environmental variables selected in the discriminant analysis were the major variables affecting the biotic communities, and these variables were used to predict and assessment of biotic communities in the streams (Cox et al. Citation1997; Wright et al. Citation2000). In addition, reference streams can provide specific forms and characteristics of integrity for management of the same type of streams or for restoration of artificially disturbed streams.
Knowledge about the relationships between biotic communities and environmental variables can be applied to classify streams or habitat types. Walsh et al. (Citation2007) established a stream-classification system used in biodiversity conservation of streams throughout Pennsylvania. Their system is based on benthic macroinvertebrate and fish communities as biological variables and geology, gradient and catchment area as environmental variables. Based on this system, the streams in Pennsylvania are classified into 23 types. The research method of Olivero and Anderson (Citation2008) was similar to that of Walsh et al. (Citation2007), except that they included the distribution of cold-water taxa by adding water temperature as a variable. These authors classified the streams in 13 states in the northeastern United States for the purpose of their conservation and restoration into 259 stream (or habitat) types (Olivero and Anderson Citation2008). In addition, Wright et al. (Citation1997) classified the stream types according to the distribution of benthic macroinvertebrate communities, and Kim et al. (Citation2017) and Min et al. (Citation2019) categorized stream types based on the classification of environmental variables by considering the functional aspects of streams and using benthic macroinvertebrate FFGs. Classification of stream types based on biotic communities may allow diverse approaches in stream management, such as by selecting reference streams, developing biological assessment indices or estimating habitat suitability of organisms, that reflect the characteristics (environments or organisms) that appear in each stream type. Given this usability, acquiring and accumulating knowledge about the relationship between biotic communities and environmental variables are the prerequisite for establishing a sustainable freshwater ecosystem.
However, at the time when research on ecological integrity was actively carried out in developed countries, Asian regions were undergoing industrialization and urbanization based on economic growth and are therefore lacking information on ecological integrity of the streams. In particular, the integrity is extremely rarely preserved downstream from dams and weirs. Thus, the least disturbed streams can be used as reference streams in Asia, but it may be difficult to prepare a new reference system approach for selecting reference streams. Therefore, information on major environmental variables affecting biotic communities can be used as a basis for selecting environmental variables to be considered in establishing the criteria for the reference condition approach. For this reason, our study analyzed the influence of environmental variables on the distribution of benthic macroinvertebrate communities at the national scale in the Republic of Korea, and identified gradient, substratum, velocity, BOD and altitude as the major variables. Future research should be focused on estimating the range of environmental variables favored by certain organisms by gradually minimizing the scale to regional level. For example, studies on habitat suitability of stream organisms have been conducted worldwide (Jowett and Richardson Citation1990; Gore et al. Citation2001; Li et al. Citation2009; Shearer et al. Citation2015). In addition, the variables used in these studies were mainly physical factors such as velocity and water depth, and substratum composition. In the Republic of Korea, such studies have been conducted mainly on fishes (Woo et al. Citation1998; Kim Citation1999; Sung et al. Citation2005), but studies on benthic macroinvertebrates were conducted by Kong and Kim (Citation2017), and Kim and Kong (Citation2016) were the only ones. Accordingly, more studies on benthic macroinvertebrates are needed, and the result of this study is considered to be used a reference data in the process of selecting environmental variables for such habitat suitability. Various studies referenced in this paper, including ours, generally targeted lotic ecosystems, whereas the contrast between lentic ecosystems and biotic communities remains to be elucidated.
Disclosure statement
No potential conflict of interest was reported by the author(s).
Additional information
Funding
Notes on contributors
Jeong-Ki Min
Jeong-ki Min is currently a PhD student at Kyonggi University, Republic of Korea. He is majoring in aquatic ecology, especially benthic macroinvertebrates.
Dong-Soo Kong
Dong-soo Kong was the chief of the Han River Environment Research Center at the National Institute of Environmental Research. He is currently a professor at Kyonggi University, Republic of Korea, and studies water-quality management, freshwater ecology and benthic macroinvertebrates.
References
- Allan JD, Castillo MM. 2007. Stream ecology: structure and function of running waters. Dordrecht, Netherlands: Springer.
- APHA. 2001. Standard methods for the examination of water and wastewater. 21st ed. Washington (DC): American Public Health Association.
- Arle J, Blondzik K, Claussen U, Duffek A, Grimm S, Hilliges F, Hoffmann A, Leujak W, Mohaupt V, Naumann S, et al. 2014. Environmental policy water resources management in Germany. Part 2. Water quality. Bonn: Federal Ministry for the Environment, Nature Conservation, Construction and Nuclear Safety.
- Bae YJ, Won DH, Lee WJ, Seung HW. 2003. Development of environment assessment technique and biodiversity management system and their application to stream ecosystems in Korea. Korean J Environ Biol. 21(3):223–233.
- Bailey RC, Norris RH, Reynoldson TB. 2004. Bioassessment of freshwater ecosystems: using the reference condition approach. Boston, Dordrecht, New York, London: Kluwer Academic Publishers.
- Bazinet NL, Gilbert BM, Wallace AM. 2010. A comparison of urbanization effects on stream benthic macroinvertebrates and water chemistry in an urban and an urbanizing basin in Southern Ontario, Canada. Water Qual Res J. 45(3):327–341.
- Beauchard O, Gagneur J, Brosse S. 2003. Macroinvertebrate richness patterns in North African streams. J Biogeogr. 30(12):1821–1833.
- Boon PJ. 1988. The impact of river regulation on invertebrate communities in the UK. Regul Rivers: Res Mgmt. 2(3):389–409.
- Booth DB, Karr JR, Schauman S, Konrad CP, Morley SA, Larson MG, Burges SJ. 2004. reviving urban streams: land use, hydrology, biology, and human behavior1. J Am Water Resources Assoc. 40(5):1351–1364.
- Bucher EH, Castro G, Floris V. 1997. Freshwater ecosystem conservation: toward a comprehensive water resources management strategy. Washington (DC): Inter-American Development Bank, Sustainable Development Department, Environment Division.
- Buss DF, Baptista DF, Silveira MP, Nessimian JL, Dorvillé LFM. 2002. Influence of water chemistry and environmental degradation on macroinvertebrate assemblages in a river basin in south-east Brazil. Hydrobiologia. 481(1/3):125–136.
- Carrie R, Dobson M, Barlow J. 2015. The influence of geology and season on macroinvertebrates in Belizean streams: implications for tropical bioassessment. Freshw Sci. 34(2):648–662.
- Cater JL, Fend SV. 2001. Inter-annual changes in the benthic community structure of riffles and pools in reaches of contrasting gradient. Hydrobiologia. 459(1–3):187–200.
- Chadwick MA, Feminella JW. 2001. Influence of salinity and temperature on the growth and production of a freshwater mayfly in the Lower Mobile River, Alabama. Limnol Oceanogr. 46(3):532–542.
- Cowx IG, Noble RA, Nunn AD, Harvey JP, Welcomme RL, Halls A. 2004. Flow and level criteria for coarse fish and conservation species. England and Wales: Environment Agency. Science Report SC020112/SR.
- Cox R, Wright JF, Furse Mt, Moss D. 1997. RIVPACS III - Great Britain (Beta release version) user manual. England and Wales: Institute of Freshwater Ecology, National Rivers Authority.
- Craig DA. 1987. Some of what you should know about water or, K.I.S.S.* for hydrodynamics (*Keeping It Stupidly Simple). J North Am Benthol Soc. 4:178–182.
- Cuffney TF, Brightbill RA, May JT, Waite IR. 2010. Responses of benthic macroinvertebrates to environmental changes associated with urbanization in nine metropolitan areas. Ecol Appl. 20(5):1384–1401.
- Cummins KW. 1962. An evaluation of some techniques for the collection and analysis of benthic samples with special emphasis on lotic waters. Am Midl Nat. 67(2):477–504.
- Daufresne M, Roger MC, Capra H, Lamouroux N. 2004. Long‐term changes within the invertebrate and fish communities of the Upper Rhône River: effects of climatic factors. Global Change Biol. 10(1):124–140.
- De Silva SS, Abery NW, Nguyen TT. 2007. Endemic freshwater finfish of Asia: distribution and conservation status. Divers. Distrib. 13(2):172–184.
- Dodds WK, Jones JR, Welch EB. 1998. Suggested classification of stream trophic state: distributions of temperate stream types by chlorophyll, total nitrogen, and phosphorus. Water Res. 32(5):1455–1462.
- Dudgeon D, Arthington AH, Gessner MO, Kawabata Z-I, Knowler DJ, Lévêque C, Naiman RJ, Prieur-Richard A-H, Soto D, Stiassny MLJ, et al. 2006. Freshwater biodiversity: importance, threats, status and conservation challenges. Biol Rev Camb Philos Soc. 81(2):163–182.
- Dudgeon D. 2000. The ecology of tropical Asian rivers and streams in relation to biodiversity conservation. Annu Rev Ecol Syst. 31(1):239–263.
- Dufrêne M, Legendre P. 1997. Species assemblages and indicator species: the need for a flexible asymmetrical approach. Ecol Monogr. 67(3):345–366.2.0.CO;2]
- Gore JA, Layzer JB, Mead AJ. 2001. Macroinvertebrate instream flow studies after 20 years: a role in stream management and restoration. Regul Rivers: Res Mgmt. 17(4–5):527–542.
- Harper MP, Peckarsky BL. 2006. Emergence cues of a mayfly in a high‐altitude stream ecosystem: potential response to climate change. Ecol Appl. 16(2):612–621.2.0.CO;2]
- Hill MO. 1979. TWINSPAN: a FORTRAN program of arranging multivariate data in an ordered two way table by classification of individual and attributes. In: Section of ecology and systematics. Ithaca (NY): Cornell University.
- Holmes NTH, Boon PJ, Rowell TA. 1998. A revised classification system for British rivers based on their aquatic plant communities. Aquat Conserv Mar Freshw Ecosyst. 8(4):555–578.
- Hwang S-J, Kim N-Y, Yoon SA, Kim B-H, Park MH, You K-A, Lee HY, Kim HS, Kim YJ, Lee J, Lee OM, et al. 2011. Distribution of benthic diatoms in Korean rivers and streams in relation to environmental variables. Ann Limnol - Int J Lim. 47(S1):S15–S33.
- Hynes HBN. 1970. The ecology of running waters. Liverpool: Liverpool University Press.
- Jacobsen D, Schultz R, Encalada A. 1997. Structure and diversity of stream invertebrate assemblages: the influence of temperature with altitude and latitude. Freshw Biol. 38(2):247–261.
- Jiang X-M, Xiong J, Qiu J-W, Wu J-M, Wang J-W, Xie Z-C. 2010. Structure of macroinvertebrate communities in relation to environmental variables in a subtropical Asian river system. Internat Rev Hydrobiol. 95(1):42––57.
- Johnson RK, Furse MT, Hering D, Sandin L. 2007. Ecological relationships between stream communities and spatial scale: implications for designing catchment-level monitoring programmes. Freshw Biol. 52(5):939–958.
- Jowett IG, Richardson J. 1990. Microhabitat preferences of benthic invertebrates in a New Zealand river and the development of in‐stream flow‐habitat models for Deleatidium spp. N Z J Mar Freshw Res. 24(1):19–30.
- Jun Y-C, Kim N-Y, Kim S-H, Park Y-S, Kong D-S, Hwang S-J. 2016. Spatial distribution of benthic macroinvertebrate assemblages in relation to environmental variables in Korean nationwide streams. Water. 8(1):27.
- Karr JR. 1999. Defining and measuring river health. Freshw Biol. 41(2):221–234.
- Kim DH, Chon TS, Kwak GS, Lee SB, Park YS. 2016. Effects of land use types on community structure patterns of benthic macroinvertebrates in streams of urban areas in the south of the Korea Peninsula. Water. 8(5):187.
- Kim J-Y, Kim P-J, Hwang S-J, Lee J-K, Lee S-W, Park C-H, Moon J-S, Kong D-S. 2017. Korean stream types based on benthic macroinvertebrate communities according to stream size and altitude. J Freshw Ecol. 32(1):741–759.
- Kim KH. 1999. Evaluation of habitat conditions and estimation of optimum flow for the freshwater fish [Ph. D. Dissertation]. Seoul, Korea: The Graduate School of Yonsei University.
- Kim YJ, Kong D. 2016. Estimation on Physical Habitat Suitability of Benthic Macroinvertebrates in the Hwayang Stream. J Korean Soc Water Environ. 32(1):1–25.
- Kong D, Kim AR. 2017. Estimation on the physical habitat suitability of benthic macroinvertebrates in the Gapyeong stream. J Korean Soc Water Environ. 33(3):311–325.
- Kwon OK, Min DK, Lee JR, Lee JS, Je JG, Choe BL. 2001. Korean mollusks with color illustration. Seoul, Korea: Hanguel Publishing Company.
- Lee SH, Heo IH, Lee KM, Kwon WT. 2005. Classification of local climatic regions in Korea. J Korean Meteorol Soc. 41(6):983–995.
- Lee S-W, Hwang S-J, Lee J-K, Jung D-I, Park Y-J, Kim J-T. 2011. Overview and application of the National Aquatic Ecological Monitoring Program (NAEMP) in Korea. Ann Limnol - Int J Lim. 47(S1):S3–S14.
- Lenat DR. 1988. Water quality assessment of streams using a qualitative collection method for benthic macroinvertebrates. J North Am Benthol Soc. 7(3):222–233.
- Li F, Cai Q, Fu X, Liu J. 2009. Construction of habitat suitability models (HSMs) for benthic macroinvertebrate and their applications to instream environmental flows: a case study in Xiangxi River of Three Gorges Reservior region. China Prog Nat Sci. 19(3):359–367.
- Li F, Cai Q, Jiang W, Qu X. 2012. The response of benthic macroinvertebrate communities to climate change: evidence from subtropical mountain streams in Central China. Int Rev Hydrobiol. 97(3):200–214.
- Li F, Chung N, Bae M-J, Kwon Y-S, Park Y-S. 2012. Relationships between stream macroinvertebrates and environmental variables at multiple spatial scales. Freshw Biol. 57(10):2107–2124.
- Malmqvist B, Mäki M. 1994. Benthic macroinvertebrate assemblages in north Swedish streams: environmental relationships. Ecography. 17(1):9–16.
- Merritt RW, Cummins KW. 1996. An introduction to the aquatic insects of North America. 3rd ed. Iowa: Kendall/Hunt Publishing Company.
- Merz JE, Ochikubo Chan LK. 2005. Effects of gravel augmentation on macroinvertebrate assemblages in a regulated California River. River Res Appl. 21(1):61–74.
- Min J-K, Kim Y-J, Kong D-S. 2019. Spatial distribution patterns of benthic macroinvertebrate functional feeding groups by stream size and gradient in Republic of Korea. J Freshw Ecol. 34(1):715–738.
- Ministry of Environment and National Institute of Environmental Research. 2013. Survey and evaluation of aquatic ecosystem health in Korea (V). Korea: Ministry of Environment and National Institute of Environmental Research.
- Nelson SM, Lieberman DM. 2002. The influence of flow and other environmental factors on benthic invertebrates in the Sacramento River, USA. Hydrobiologia. 489(1/3):117–129.
- Oliveira ALHD, Nessimian JL. 2010. Spatial distribution and functional feeding groups of aquatic insect communities in Serra da Bocaina streams, southeastern Brazil. Acta Limnol Bras. 22(4):424–441.
- Olivero AP, Anderson MG. 2008. Northeast aquatic habitat classification system. Virginia: The Nature Conservancy, Eastern Regional Office.
- Pan Y, Herlihy A, Kaufmann P, Wigington J, Van Sickle J, Moser T. 2004. Linkages among land-use, water quality, physical habitat conditions and lotic diatom assemblages: a multi-spatial scale assessment. Hydrobiologia. 515(1–3):59–73.
- Park YS, Song MY, Park YC, Oh KH, Cho E, Chon TS. 2007. Community patterns of benthic macroinvertebrates collected on the national scale in Korea. Ecol Model. 203(1–2):26–33.
- Quinn JM, Hickey CW. 1990. Characterisation and classification of benthic invertebrate communities in 88 New Zealand rivers in relation to environmental factors. N Z J Mar Freshw Res. 24(3):387–409.
- Rabeni CF, Minshall GW. 1977. Factors affecting microdistribution of stream benthic insects. Oikos. 29(1):33–43.
- Resh VH, Jackson JK. 1993. Rapid assessment approaches to biomonitoring using benthic macroinvertebrates. Freshwater biomonitoring and benthic macroinvertebrates. In: Rosenberg DM, Resh VH, editors. Freshwater biomonitoring and benthic macroinvertebrates. New York: Chapman and Hall; p. 195–223.
- Ro TH, Chun DJ. 2004. Functional feeding group catergorization of Korean immature aquatic insects and community stability analysis. Korean J Limnol. 37(2):137–148.
- Rosenberg DM, Danks HV, Lehmkuhl DM. 1986. Importance of insects in environmental impact assessment. Environ Manag. 10(6):773–783.
- Rosenberg DM, Resh VH. 1993. Freshwater biomonitoring and benthic macroinvertebrates. New York (NY): Chapman and Hall.
- Sandin L. 2003. Benthic macroinvertebrates in Swedish streams: community structure, taxon richness, and environmental relations. Ecography. 26(3):269–282.
- Shearer KA, Hayes JW, Jowett IG, Olsen DA. 2015. Habitat suitability curves for benthic macroinvertebrates from a small New Zealand river. N Z J Mar Freshw Res. 49(2):178–191.
- Sládeček V. 1969. The measures of saprobity. Verh Internat Verein Limnol. 17(1):546–559.
- Smith MJ, Kay WR, Edward DHD, Papas PJ, Richardson KSJ, Simpson JC, Pinder AM, Cale DJ, Horwitz PH, Davis A, et al. 1999. AusRivAS: using macroinvertebrates to assess ecological condition of rivers in Western Australia. Freshw Biol. 41(2):269–282.
- Stoddard JL, Herlihy AT, Peck DV, Hughes RM, Whittier TR, Tarquinio E. 2008. A process for creating multimetric indices for large-scale aquatic surveys. J North Am Benthol Soc. 27(4):878–891.
- Strahler AN. 1957. Quantitative analysis of watershed geomorphology. Trans AGU. 38(6):913–920.
- Strayer DL, Dudgeon D. 2010. Freshwater biodiversity conservation: recent progress and future challenges. J North Am Benthol Soc. 29(1):344–358.
- Strayer DL. 2006. Challenges for freshwater invertebrate conservation. J North Am Benthol Soc. 25(2):271–287.2.0.CO;2]
- Sung YD, Park BJ, Joo GJ, Jung KS. 2005. The estimation of ecological flow recommendations for fish habitat. J Korea Water Resour Assoc. 38(7):545–554.
- Ter Braak CJF. 1986. Canonical correspondence analysis: a new eigenvector technique for multivariate direct gradient analysis. Ecology. 67(5):1167–1179.
- Tison J, Park YS, Coste M, Wasson JG, Ector L, Rimet F, Delmas F. 2005. Typology of diatom communities and the influence of hydro-ecoregions: a study on the French hydrosystem scale. Water Res. 39(14):3177–3188.
- USEPA. 2013. National rivers and streams assessment 2008–2009. Washington (DC): United States Environmental Protection Agency, Office of Research and Development.
- Vannote RL, Minshall GW, Cummins KW, Sedell JR, Cushing CE. 1980. The river continuum concept. Can J Fish Aquat Sci. 37(1):130–137.
- Vörösmarty CJ, McIntyre PB, Gessner MO, Dudgeon D, Prusevich A, Green P, Glidden E, Bunn SE, Sullivan CA, Liermann CR, et al. 2010. Global threats to human water security and river biodiversity. Nature. 467(7315):555–561.
- Walsh MC, Deeds J, Nightingale B. 2007. Classifying lotic systems for conservation: methods and results of the Pennsylvania aquatic community classification. Pittsburgh (PA): Pennsylvania Natural Heritage Program, Western Pennsylvania Conservancy.
- Wang L, Seelbach PW, Hughes RM. 2006. Introduction to landscape influences on stream habitats and biological assemblages. Proceedings of the American Fisheries Society Symposium. Chapter 48. Bethesda, MD: American Fisheries Society, p. 1–23.
- WFD. 2000. E.U. Directive 2000/60/EC of the European parliament and of the council establishing a framework for the community action in the field of water policy. Brussels: The European Parliament and the Council of the European Union.
- Woo HS, Lee JW, Kim KH. 1998. Development of a method for determination of instream flow needs required for fish habitat conservation-application to the Keum river. J Korean Soc Civ Eng. 18(2_4):339–339.
- Wright JF, Moss D, Armitage PD, Furse MT. 1984. A preliminary classification of running‐water sites in Great Britain based on macro‐invertebrate species and the prediction of community type using environmental data. Freshw Biol. 14(3):221–256.
- Wright JF, Sutcliffe DW, Furse MT. 2000. Assessing the biological quality of fresh waters: RIVPACS and other techniques. Ambleside, England: Freshwater Biological Association.
- Wright JF. 1994. Development of RIVPACS in the UK and the value of the underlying data-base. Limnética. 10(1):15–31. The reference “Wright 1994” is listed in the references list but is not cited in the text. Please either cite the reference or remove it from the references list.
- Wright JF, Sutcliffe DW, Furse MT. 1997. Assessing the biological quality of fresh waters: RIVPACS and other techniques. Proceedings of the Invited Contributions from an International Workshop Held in Oxford; Sep 16–18. Ambleside: Freshwater Biological Association.
- Yoon IB. 1995. In an illustrative guidebook of aquatic insects in Korea. Seoul, Korea: Jeonghaengsa Publishing Company.
- Yun CW, Moon HS. 2009. Classification of forest vegetation type and environmental properties in limestone area of Korea. J Agric Life Sci. 43(2):1–8.