
 ?Mathematical formulae have been encoded as MathML and are displayed in this HTML version using MathJax in order to improve their display. Uncheck the box to turn MathJax off. This feature requires Javascript. Click on a formula to zoom.
Abstract
The carnivorous largemouth bass Micropterus salmoides has been introduced to many regions and poses a threat to native aquatic organisms due to predation, resulting in a significant decrease in biodiversity. Under conditions of prey scarcity, the largemouth bass is thought to consume smaller conspecifics. However, little is known about this species’ dietary reliance on intraspecific predation and its impact on the population structure. We investigated the length–frequency distribution of largemouth bass and estimated their reliance on intraspecific predation using stable carbon and nitrogen isotopes in an agricultural pond with no available prey fish. Almost all individual largemouth bass were collected via the pond drainage system. Within the largemouth bass population, the dominant length class was composed of fish measuring 100–160 mm standard length (SL), whereas few individuals measuring < 100 mm SL (first-year juveniles) were collected. The results from a Stable Isotope Analysis in R mixing model indicated that all four length classes (105–146, 165–180, 216–246, and 300–337 mm SL) of largemouth bass fed mainly on juvenile conspecifics and on red swamp crayfish (Procambarus clarkii). First-year juveniles could have been predated by other individuals of various sizes. The dominant 100–160 mm SL length class may have experienced a weak predation pressure when they were in the first-year juvenile class. Consequently, the largemouth bass population was unbalanced, with few first-year juveniles (< 100 mm SL) and dominance of a 100–160 mm SL length class.
Introduction
The introduction of exotic organisms can cause disruption to aquatic ecosystems (Whitter and Kincaid 1999; Clavero and García-Berthou Citation2005). The largemouth bass, Micropterus salmoides, is a carnivorous fish native to North America that has been introduced to many regions around the world for angling (Hickley et al. Citation1994; Maezono et al. Citation2005; Jang et al. Citation2006). Introduced largemouth bass can adversely affect native fish and invertebrate communities due to their predation pressure, causing a loss of biodiversity (Whitter and Kincaid 1999; Maezono and Miyashita Citation2003; Weyl et al. Citation2010).
In Japan, artificial farm ponds are one of the most common lentic systems, with around 210,000 ponds (Ministry of Agriculture and Forestry and Fisheries of Japan Citation2011), which function as habitats for various aquatic organisms (Kadono and Yuma Citation1995; Usio et al. Citation2013). Largemouth bass have been frequently introduced to farm ponds for fishing, leading to a loss of species richness and abundance of native aquatic organisms as a result of predation (Maezono and Miyashita Citation2003; Yonekura et al. Citation2004; Fujimoto et al. Citation2009). Farm ponds are often located upstream of irrigation channels and have dams to store water used to irrigate rice fields. Consequently, largemouth bass populations in farm ponds may act as potential sources of dispersal to downstream water bodies (Fujimoto et al. Citation2012).
In small farm ponds, largemouth bass can drastically alter the fish community through predation, sometimes resulting in local extinction of their prey species (Maezono and Miyashita Citation2003; Tsunoda and Mitsuo Citation2012; Natsumeda et al. Citation2015). Predation on fish typically increases the growth and survival rates of largemouth bass due to the high energy content of fish (Keast and Eadie Citation1985; Olson Citation1996; Ludsin and DeVries Citation1997). Largemouth bass are also found in small farm ponds that lack prey fish (e.g., Maezono and Miyashita Citation2003; Natsumeda et al. Citation2015), indicating that largemouth bass may sustain their populations under conditions of scarcity of prey fish. Largemouth bass are known to feed on conspecifics (e.g., Timmons et al. Citation1980; Keast Citation1985; Johnson and Post Citation1996). When prey with high energy content, such as fish, are rarely available, intraspecific predation may increase growth and survival rates and as a result may improve population recruitment (Frankiewicz et al. Citation1999), but it can also be a self-regulating factor of the population (Polis Citation1981). When largemouth bass prey on first-year juveniles, the predation pressure can significantly decrease the number of first-year juveniles and result in an unbalanced population structure. However, whether largemouth bass can sustain their populations over long periods under conditions of prey scarcity remains unknown. Furthermore, the dietary importance of intraspecific predation has not been fully examined in small ponds with a scarcity of small prey fish. Previous reports were based on observation of gut contents, which provide a snapshot of an individual’s diet (e.g., Timmons et al. Citation1980; Keast Citation1985). On the other hand, stable C and N isotope ratios of an animal provide an integration of its feeding history dependent on its turnover rate (Post Citation2003; Schumann et al. Citation2018). Stable isotope ratios are acquired by measuring tissue from an individual animal and serve as a tool for studying intrapopulation variation in diet (Post Citation2003; Yasuno et al. Citation2012).
In this study, we measured the length–frequency distribution of largemouth bass, as well as their stable C and N isotope ratios, in a farm pond under conditions of prey scarcity. The study aimed to reveal the length–frequency distribution of the largemouth bass population in the pond under such conditions and to quantify the dietary importance of intraspecific predation for largemouth bass.
Materials and methods
Study site
The study was conducted in a farm irrigation pond (38°43′ N, 141°06′ E) located in the Lake Izunuma–Uchinuma Basin in Miyagi Prefecture, northern Japan. The farm pond is surrounded by rice fields and forests and is connected to agricultural drainage ditches. The pond covers an area of 7914 m2 (length 128 m, dam width 67 m, perimeter 380 m) and has a maximum depth of ca. 5 m. Submerged or floating-leaved macrophytes were rarely observed, although Phragmites australis inhabited the area surrounding the pond. In 2006, we obtained the information that largemouth bass already inhabited the pond, although it is unclear when they were introduced into the pond. Largemouth bass dominated the fish fauna and were found alongside crucian carps (Carassius sp.) measuring > 200 mm, as well as red swamp crayfish (Procambarus clarkii) and the American bullfrog (Lithobates catesbeianus), both of which were introduced from North America.
Sampling of fish and their potential prey
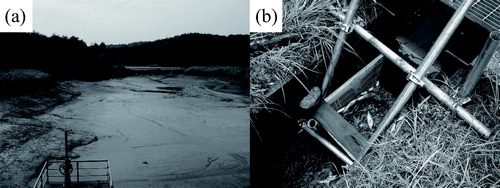
All the pond water was discharged via the drainage ditch, and then the pond bottom was drained over a week to exterminate the largemouth bass in the pond (). These procedures were finished on 13 September 2008. We set a mesh container (650 × 450 × 400 mm, mesh size 5 × 35 mm) in the drainage ditch (). Because the water was discharged through the mesh container into the downstream ditch, all drifting largemouth bass and prey organisms (American bullfrog tadpole, dragonfly larvae Epophthalmia elegans, and red swamp crayfish) were trapped in the container and were collected as samples. After discharging the pond water, we repeatedly captured largemouth bass using dip nets to collect all remaining largemouth bass in the pond.
Figure 1. (a) Drained agricultural pond and (b) trap container set in the drainage ditch to capture drifting largemouth bass and prey organisms, respectively.
Cohort analyses
The standard length (SL) of all collected specimens was measured to the nearest millimeter using Vernier calipers. Cohorts were identified from all collected individuals using length–frequency data, following Bhattacharya’s (Citation1967) method, which assumes that all cohorts are normally distributed. The distribution obtained from these data can be identified as a series of two or more points defining a regression line with a negative slope when the logarithms of the ratios of successive frequencies are plotted against the corresponding midpoints. The analysis was conducted using FiSAT II software (Gayanilo et al. Citation2005).
Stable isotope analyses
Sample largemouth bass for stable isotope analyses were selected to cover the entire size range of all individuals collected. Largemouth bass, American bullfrog tadpole, and red swamp crayfish individuals were dissected, and a sample of muscle tissue was removed from each for the stable isotope analysis. For the dragonfly larvae, the entire body was used for the analysis. All samples were freeze-dried (24 h), then ground and homogenized using a predried (500 °C for 2 h) agate mortar and pestle. Lipids were removed using a chloroform–2-methanol mixture (2:1 v:v). The samples were concentrated using glass fiber filters (GF/C, Whatman Co., Florham Park, NJ, USA) that had been predried at 500 °C for 2 h and were then freeze-dried. Stable isotope ratios were measured using a mass spectrometer (DELTA-plus, Finnigan MAT, Bremen, Germany) connected to an elemental analyzer (NA2500, Fisons Instruments, Beverly, MA, USA). Ratios are represented using the standard delta notation:
where R = 13C/12C or 15N/14N. We used the following standards: Pee Dee belemnite for δ13C and atmospheric nitrogen gas for δ15N. The analytical error was within ± 0.1‰ and ± 0.2‰ for carbon and nitrogen, respectively.
Bayesian mixing model
We estimated the relative contribution of potential prey items to the diets of the four largemouth bass length classes (105–146, 165–180, 216–246, and 300–337 mm SL) using SIAR (Stable Isotope Analysis in R; R Development Core Team Citation2015). The SIAR mixing model uses Bayesian inference and allows variations and uncertainties to propagate throughout the model; the outputs reflect the natural variability within a system. The SIAR model was fit using Markov chain Monte Carlo methods, which used a Dirichlet prior distribution to simulate dietary proportions of food sources that were consistent with the data (Parnell et al. Citation2010). The SIAR mixing model ran 500,000 iterations, discarding the first 50,000 samples. We assumed that the isotopic fractionation factors for N and C were 3.23‰ ± 0.41‰ and 0.94‰ ± 1.13‰, respectively (Vander Zanden and Rasmussen Citation2001). We assumed that the potential prey of largemouth bass consisted of terrestrial insects, American bullfrog, dragonfly larvae, red swamp crayfish, and small-sized largemouth bass. The body size of prey that largemouth bass can consume is limited by the size of their gape (Johnson and Post Citation1996). Lundgren et al. (Citation2014) reported that the maximum predator:prey ratio for largemouth bass was 0.47; therefore, we assumed that first-year juveniles (63–71 mm SL) were potential prey for the 105–146 and 165–180 mm SL length classes. The length range of potential prey was 63–110 mm SL for fish of the 216–246 mm SL length class and 63–146 mm SL for fish of the 300–337 mm SL length class. We used isotopic data for terrestrial insects collected in 2009 from around other farm ponds that were also located in the Lake Izunuma–Uchinuma Basin (S. Shikano, unpublished data), as we did not collect terrestrial insects during this study.
Results
Length–frequency distribution of largemouth bass
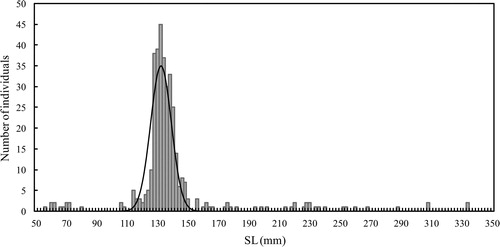
We captured 369 largemouth bass individuals from the pond. The peak SL of the dominant length class was approximately 130 mm (). The mean SL of the identified cohort was 133.6 mm, ranging from 100 to 160 mm SL. Although there was a wide range of body lengths in all individuals collected (i.e., 56–334 mm SL), other cohorts could not be identified due to the small number of individuals collected. There were only 12 individuals that were smaller than the identified cohort (100–160 mm SL), with body lengths ranging from 55 to 79 mm SL, and 33 individuals longer than 160 mm SL.
Figure 2. Length–frequency distribution of largemouth bass collected from the farm pond in 2008. The mode of the dominant size class was obtained by Bhattacharya’s (Citation1967) method.
Isotopic signatures of potential largemouth bass prey
American bullfrog tadpole had the lowest δ13C signatures (–33.8‰, n = 1) and δ15N signatures (2.6‰) among the potential prey items ( and ). Red swamp crayfish had the highest δ13C signatures (–25.8 ± 0.7‰ [mean ± SD], n = 6) and the second-highest δ15N signatures (5.4 ± 0.8‰). First-year juvenile largemouth bass (63–71 mm SL) had the highest δ15N signatures (7.5 ± 0.4‰, n = 5), with δ13C signatures of −26.6 ± 0.5‰. The δ13C and δ15N signatures of potential prey conspecifics (63–110 mm SL) for the 216–246 mm SL length class were −26.6 ± 0.4‰ (n = 8) and 8.1 ± 0.9‰, respectively, whereas those (63–146 mm SL) for the 300–337 mm SL length class were −26.6 ± 0.4‰ (n = 15) and 8.6 ± 0.9‰, respectively. The δ13C and δ15N signatures of dragonfly larvae were −28.4‰ (n = 2) and 4.0‰, respectively, whereas those of terrestrial insects were −27.9 ± 3.1‰ (n = 3) and 2.7 ± 2.5‰, respectively.
Figure 3. δ13C and δ15N values of largemouth bass and their potential food items collected from the farm pond.
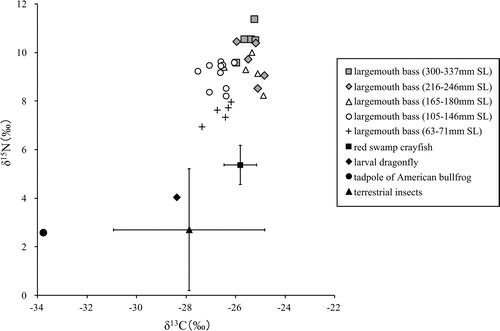
Table 1. Stable isotope ratios of C and N in potential food sources and largemouth bass collected from the farm pond in 2008.
Isotopic signatures of largemouth bass
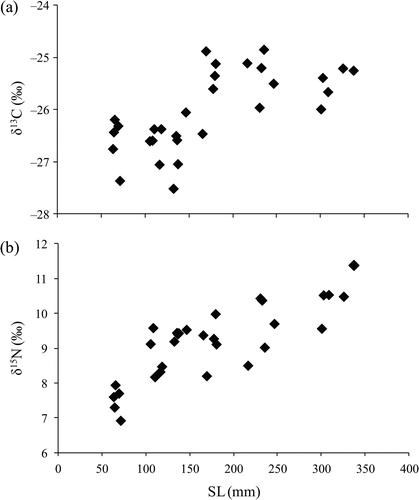
The δ13C and δ15N values of largemouth bass ranged from −27.5‰ to −24.9‰ and from 6.9‰ to 11.4‰, respectively (). The SL of largemouth bass and values of δ13C showed a significant positive correlation (r = 0.675, p < 0.001, n = 30) (). The δ13C values were significantly higher at approximately 165 mm SL. The SL and δ15N signatures were also significantly positively correlated (r = 0.811, p < 0.001, n = 30) (). Furthermore, the δ15N signatures of individuals longer than 100 mm SL (8.2‰–11.4‰) were significantly higher than those of the smallest individuals (63–71 mm SL, 6.9‰–8.0‰). The δ13C values of largemouth bass were between those of terrestrial insects and red swamp crayfish, although some individuals exhibited values that were slightly higher than those of red swamp crayfish (). All largemouth bass individuals exhibited higher δ15N signatures than their potential prey animals ().
Figure 4. Relationships between standard length (SL) and (a) δ13C and (b) δ15N of largemouth bass.
Dietary contributions of prey organisms
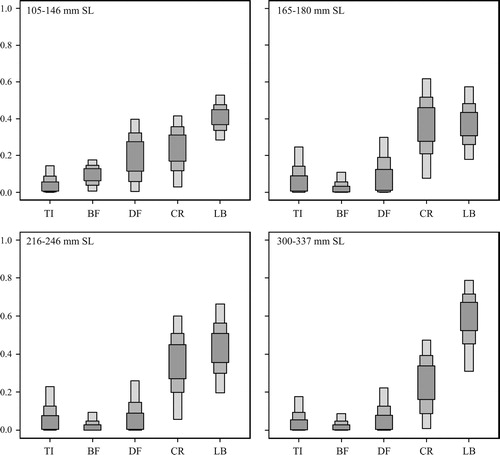
The SIAR mixing model showed that the four length classes of largemouth bass (105–146, 165–180, 216–246, and 300–337 mm SL) fed more on juvenile conspecifics and red swamp crayfish than on other prey organisms, although the contribution of larval dragonflies to the diet of the 105–146 mm SL length class was as high as that of red swamp crayfish (). The dietary contributions of juvenile largemouth bass to each length class were 28.4%–52.8% (95% confidence interval), 18.0%–57.3%, 19.7%–66.4%, and 18.2%–91.5% for the 105–146, 165–180, 216–246, and 300–337 mm SL length classes, respectively. Red swamp crayfish also contributed to the diet of all the length classes (105–146 mm SL: 2.9%–41.6%, 165–180 mm SL: 7.6%–61.6%, 216–246 mm SL: 5.8%–60.0%, 300–337 mm SL: 0.9%–47.2%). The dietary contributions of dragonfly larvae were 0.5%–39.7%, 0.0%–30.0%, 0.0%–25.9%, and 0.0%–22.4% for the 105–146, 165–180, 216–246, and 300–337 mm SL length classes, respectively. American bullfrog tadpole represented a limited contribution: 0.6%–17.7%, 0.0%–10.9%, 0.0%–9.3%, and 0.0%–8.8% for the 105–146, 165–180, 216–246, and 300–337 mm SL length classes, respectively. The dietary contributions of terrestrial insects were 0.0%–14.5%, 0.0%–24.7%, 0.0%–22.9%, and 0.0%–17.8% for the 105–146, 165–180, 216–246, and 300–337 mm SL length classes, respectively.
Figure 5. Box plots derived from the Bayesian stable isotope mixing model showing the contributions of different potential food sources to the diet of various largemouth bass length classes (105–146, 165–180, 216–246, and 300–337 mm SL), using δ13C and δ15N values. The proportions show confidence intervals at 95%, 75%, and 50%. Abbreviations used for potential prey were as follows: small juvenile largemouth bass (LB), red swamp crayfish (CR), American bullfrog tadpole (BF), dragonfly larvae (DF), and terrestrial insects (TR).
Discussion
Our study examined an unbalanced population structure of largemouth bass collected from a farm pond lacking other available prey fish species, with a few individual juveniles measuring less than 100 mm SL and dominated by a 100–160 mm SL length class (). Although the smallest length class (63–71 mm SL) was considered to be first-year juveniles, which are typically dominant in largemouth bass populations, we observed few first-year juveniles. Largemouth bass show interannual variability in year class strength, because environmental factors such as water temperature and wind affect egg survival and nest success (Kramer and Smith Citation1962). However, our SIAR mixing model results indicate that juveniles significantly contributed to the diet of all four length classes (105–146, 165–180, 216–246, and 300–337 mm SL) (). Thus, the first-year juveniles could have been under predation pressure by their larger conspecifics. Because the maximum predator:prey ratio for largemouth bass was reported to be 0.47, the first-year juveniles could be available for a large portion of the dominant length class (100–160 mm SL) and even for larger individuals. In contrast, fish of the dominant length class were too large for fish of the 165–180 mm SL length class to capture, and a limited number of individuals of the dominant class was available in the 216–246 mm SL length class. The dominance of the 100–160 mm SL length class indicates that the individuals might have experienced a weak predation pressure when they were in the first-year class, and, as a result, a relatively high proportion of the individuals could have survived.
Predation success by largemouth bass is influenced by the presence of refuges for prey fish (e.g., macrophyte vegetation; Savino and Stein Citation1982). As stem density increases, visual contact of prey fish by largemouth bass decreases, and predation by largemouth bass may be disrupted by habitat complexity. Previous studies reported that the frequency of prey fish in stomach contents of largemouth bass decreased as the coverage or density of macrophytes increased (Ferrari et al. Citation2014; Tsunoda and Mitsuo Citation2018). Because our study pond lacked macrophyte vegetation, the first-year juveniles could be under strong predation pressure by their larger conspecifics, resulting in small numbers of individuals (). If there had been aquatic vegetation in the farm pond, the vegetation could have buffered the impact of predation by largemouth bass, and a larger number of first-year juveniles might have survived than in the results of this study.
Red swamp crayfish were also a major contributor to the diet of each length class (). Crayfish are known to be preferred by adult largemouth bass (e.g., Hickley et al. Citation1994; Yasuno et al. Citation2016), probably due to their large bodies and slow movement. Crayfish could have been under strong predation pressure from largemouth bass in the farm pond under conditions of prey fish scarcity. However, crayfish may be supplied to the pond from the surroundings, because overland dispersal is a frequent phenomenon among crayfish (Cruz and Rebelo 2007). In fact, crayfish have been observed to move overland from surrounding rice fields and ditches to the farm pond (Y. Fujimoto, unpublished data). Consequently, largemouth bass may be able to continuously consume red swamp crayfish in the farm pond, even though most individuals of red swamp crayfish are predated by largemouth bass. As with the increase in δ15N values with body size, the δ13C also increased as largemouth bass became larger (). In particular, the δ13C values were elevated in individuals of around 150 mm SL, indicating that individuals of this size started to consume 13C-enriched prey. For individuals measuring < 150 mm SL, red swamp crayfish may be too large to capture; thus, the δ13C elevation may be due to larger individuals starting to consume red swamp crayfish.
The results of the SIAR mixing model indicate a limited contribution by L. catesbeianus tadpole and E. elegans larvae to the diet of largemouth bass (). We collected a limited number of individuals of these prey items (tadpole, n = 1; E. elegans larvae, n = 2), indicating a low abundance of these organisms in the farm pond. American bullfrogs reproduce during May and September in Japan, and their tadpoles typically overwinter and metamorphose into adults during May and October (Maeda and Matsui 1999). E. elegans larvae take 2 or 3 years to metamorphose into adults. Thus, the low abundance of the tadpoles and E. elegans larvae was not due to their life cycles. In shallow Lake Izunuma near the current study site, largemouth bass rarely relied on E. elegans larvae. Because largemouth bass find prey visually, they may rarely find E. elegans larvae, which hide in the surface mud of the lake bottom (Yasuno et al. Citation2016). Lundgren et al. (Citation2012) reported that terrestrial and semiaquatic vertebrates, including larval Lithobates spp., accounted for less than 1% of all prey items by both volume and number in the stomach contents of largemouth bass. Largemouth bass may prefer fish and crayfish to tadpoles and E. elegans larvae if prey fish and crayfish are available.
In this study, we did not collect chironomid larvae, another potential prey item for largemouth bass (Hickley et al. Citation1994; Torigoe and Shiraiwa Citation2010). However, the four length classes of largemouth bass had levels of δ15N between 8.2‰ and 11.4‰, which were higher than those seen in E. elegans (4.0‰), which typically consume chironomid larvae. Therefore, uncollected chironomid larvae could occupy a lower trophic position than E. elegans larvae and would not explain the high δ15N values seen in largemouth bass.
The limited number of first-year juveniles could be due to the strong predation pressure by larger individuals. We did not monitor the population dynamics of largemouth bass after our survey because most individuals were eradicated by drainage of the farm pond. Further studies focusing on the diet and population dynamics of largemouth bass may enable researchers to clarify if and how largemouth bass populations can be sustained in small bodies of water under conditions of food scarcity.
Acknowledgments
We thank Dr K. Itoh, Graduate School of Agricultural Science, Tohoku University, for her assistance with the stable isotope analytical facilities. We thank the Izunuma Fisherman’s Association for their assistance in the field.
Disclosure statement
No potential conflict of interest was reported by the author(s).
Additional information
Funding
Notes on contributors
Natsuru Yasuno
Natsuru Yasuno is a researcher at Center for Environmental Science in Saitama.
Yasufumi Fujimoto
Yasufumi Fujimoto is a senior researcher at the Miyagi Prefectural Izunuma-Uchinuma Environmental Foundation.
Tetsuo Shimada
Tetsuo Shimada is a research section head at the Miyagi Prefectural Izunuma-Uchinuma Environmental Foundation.
Shuichi Shikano
Shuichi Shikano was an Associate Professor at Center for Northeast Asian Studies, Tohoku University.
Eisuke Kikuchi
Eisuke Kikuchi is a researcher at Research Institute for Teacher Training and Development, Miyagi University of Education.
References
- Bhattacharya CG. 1967. A simple method of a distribution into Gaussian components. Biometrics. 23(1):115–135.
- Clavero M, García-Berthou E. 2005. Invasive species are a leading cause of animal extinctions. Trends Ecol Evol. 20(3):110.
- Cruz MJ, Rebelo R. 2007. Colonization of freshwater habitats by an introduced crayfish, Procambarus clarkii, in Southwest Iberian Peninsula. Hydrobiologia. 575(1):191–201.
- Ferrari MC, Ranåker L, Weinersmith KL, Young MJ, Sih A, Conrad JL. 2014. Effects of turbidity and an invasive waterweed on predation by introduced largemouth bass. Environ Biol Fish. 97(1):79–90.
- Frankiewicz P, Dabrowski K, Martyniak A, Zalewski M. 1999. Cannibalism as a regulatory force of pikeperch, Stizostedion lucioperca (L.), population dynamics in the lowland Sulejow reservoir (Central Poland). In: Walz N, Nixdorf B, editors. Shallow Lakes’ 98. Netherlands: Springer.
- Fujimoto Y, Kubota R, Shindo K, Takahashi K. 2012. Downstream dispersal of largemouth bass and bluegill from an irrigation pond (In Japanese with English abstract). ECE. 15(2):213–219.
- Fujimoto Y, Hoshi M, Jinguji H. 2009. Initial impact on a pond community by a short term invasion of Micropterus salmoides (In Japanese with English abstract). Izunuma-Uchinuma Wetland Res. 3: 81–90 https://www.jstage.jst.go.jp/browse/izu/-char/ja/.
- Gayanilo FC, Sparre P, Pauly D. 2005. FAO-ICLARM stock assessment tools II (FiSAT II) users guide, FAO computerized information series, fisheries. No. 8. Rome: FAO. www.fao.org/fi/statist/fisoft/fisat.
- Hickley P, North R, Muchiri SM, Harper DM. 1994. The diet of largemouth bass, Micropterus salmoides, in Lake Naivasha, Kenya. J Fish Biol. 44(4):607–619.
- Jang MH, Joo GJ, Lucas MC. 2006. Diet of introduced largemouth bass in Korean rivers and potential interactions with native fishes. Ecol Freshwater Fish. 15(3):315–320.
- Johnson JM, Post DM. 1996. Morphological constraints on intracohort cannibalism in age‐0 largemouth bass. Trans Am Fish Soc. 125(5):809–812.
- Kadono Y, Yuma M. 1995. The nature of wetlands in Japan. Osaka: Hoikusha. (in Japanese)
- Keast A. 1985. The piscivore feeding guild of fishes in small freshwater ecosystems. Environ Biol Fish. 12(2):119–129.
- Keast A, Eadie JM. 1985. Growth depensation in year‐0 largemouth bass: the influence of diet. Trans Am Fish Soc. 114(2):204–213.
- Kramer RH, Smith LL. Jr 1962. Formation of year classes in largemouth bass. Trans Am Fish Soc. 91(1):29–41.
- Ludsin SA, DeVries DR. 1997. First-year recruitment of largemouth bass: the interdependency of early life stages. Ecol Appl. 7(3):1024–1038.
- Lundgren SA, Geluso K, Schoenebeck CW. 2012. Terrestrial and semi-aquatic vertebrates in the diets of largemouth bass (Micropterus salmoides) in central Nebraska. The Prairie Naturalist. 44:105–108.
- Lundgren SA, Schoenebeck CW, Koupal KD, Lorensen JA, Huber CG. 2014. Quantification and evaluation of factors influencing largemouth bass predation of stocked advanced fingerling yellow perch. N Am J Fish Manage. 34(3):595–601.
- Maeda N, Matsui M. 1999. Frogs and toads of Japan. Tokyo: Bun-ichi Sogo Shuppan. in Japanese.
- Maezono Y, Kobayashi R, Kusahara M, Miyashita T. 2005. Direct and indirect effects of exotic bass and bluegill on exotic and native organisms in farm ponds. Ecol Appl. 15(2):638–650.
- Maezono Y, Miyashita T. 2003. Community-level impacts induced by introduced largemouth bass and bluegill in farm ponds in Japan. Biol Conserv. 109(1):111–121.
- Ministry of Agriculture, Forestry and Fisheries of Japan. 2011. Tameike 100-sen (hundred selections of farm ponds) (in Japanese). https://www.maff.go.jp/j/nousin/bousai/tameike/.
- Natsumeda T, Takamura N, Nakagawa M, Kadono Y, Tanaka T, Mitsuhashi H. 2015. Environmental and biotic characteristics to discriminate farm ponds with and without exotic largemouth bass and bluegill in western Japan. Limnology. 16(3):139–148.
- Olson MH. 1996. Ontogenetic niche shift in largemouth bass: variability and consequence for first-year growth. Ecology. 77(1):179–190.
- Parnell AC, Inger R, Bearhop S, Jackson AL. 2010. Source partitioning using stable isotopes: coping with too much variation. PLoS One. 5(3):e9672.
- Polis GA. 1981. The evolution and dynamics of intraspecific predation. Annu Rev Ecol Syst. 12(1):225–251.
- Post DM. 2003. Individual variation in the timing of ontogenetic niche shifts in largemouth bass. Ecology. 84(5):1298–1310.
- R Development Core Team. 2015. R: a language and environment for statistical computing. Vienna, Austria: R Foundation for Statistical Computing.
- Savino JF, Stein RA. 1982. Predator–prey interaction between largemouth bass and bluegills as influenced by simulated, submersed vegetation. Trans Am Fish Soc. 111(3):255–266.
- Schumann DA, Uphoff CS, Schoenebeck CW, Graeb K. 2018. Turnover rates of carbon and nitrogen isotopes in age-0 walleye (Sander vitreus) tissues following a laboratory diet switch experiment. Can J Fish Aquat Sci. 75(4):497–505.
- Timmons TJ, Shelton WL, Davies WD. 1980. Differential growth of largemouth bass in West Point Reservoir, Alabama-Georgia. Trans Am Fish Soc. 109(2):176–186.
- Torigoe K, Shiraiwa T. 2010. Ecological studies of Largemouth bass (Micropterus salmoides) in Nakadoorijima, Goto islands, Nagasaki Pref. Bull Grad Sch Educ Hiroshima Univ. 2(59):1–7.
- Tsunoda H, Mitsuo Y. 2012. Multiple effects of exotic largemouth bass (Micropterus salmoides) and environmental factors on species richness and composition of pond-dwelling fishes. Aquat Living Resour. 25(2):163–171.
- Tsunoda H, Mitsuo Y. 2018. Variations in piscivory of invasive largemouth bass Micropterus salmoides associated with pond environments. Limnology. 19(3):271–276.
- Usio N, Imada M, Nakagawa M, Akasaka M, Noriko T. 2013. Effects of pond draining on biodiversity and water quality of farm ponds. Conserv Biol. 27(6):1429–1438.
- Vander Zanden MJ, Rasmussen JB. 2001. Variation in δ15N and δ13C trophic fractionation: implications for aquatic food web studies. Limnol Oceanogr. 46(8):2061–2066.
- Weyl PSR, de Moor IJ, Hill M, Weyl OLF. 2010. The effect of largemouth bass Micropterus salmoides on aquatic macro-invertebrate communities in the Wit River, Eastern Cape, South Africa. Afr J Aquat Sci. 35(3):273–281.
- Whittier TR, Kincaid TM. 1999. Introduced fish in northeastern USA lakes: regional extent, dominance, and effect on native species richness. Trans Am Fish Soc. 128(5):769–783.
- Yasuno N, Chiba Y, Shindo K, Fujimoto Y, Shimada T, Shikano S, Kikuchi E. 2012. Size-dependent ontogenetic diet shifts to piscivory documented from stable isotope analyses in an introduced population of largemouth bass. Environ Biol Fish. 93(2):255–266.
- Yasuno N, Fujimoto Y, Shimada T, Shikano S, Kikuchi E. 2016. Ontogenetic dietary shifts of largemouth bass do not increase trophic position in a shallow eutrophic lake in Japan. Ann Limnol - Int J Lim. 52:355–364.
- Yonekura R, Kita M, Yuma M. 2004. Species diversity in native fish community in Japan: comparison between non-invaded and invaded ponds by exotic fish. Ichthyol Res. 51(2):176–179.