
 ?Mathematical formulae have been encoded as MathML and are displayed in this HTML version using MathJax in order to improve their display. Uncheck the box to turn MathJax off. This feature requires Javascript. Click on a formula to zoom.
Abstract
Typha orientalis is an important aquatic plant and is sensitive to the water level. Here, the ecological amplitude of T. orientalis under different water levels was determined by measuring its growth and physiological indices. Results showed that: (1) The growth characteristics of T. orientalis showed quadratic relationships with water level, plant height, withered leaf rate, base diameter, leaf length, leaf width, leaf area, and biomass. Each of these growth characteristics showed an increasing then decreasing trend as water level was increased. (2) Most physiological characteristics of T. orientalis (Chla, Chlb, Car, SOD activity, CAT activity, soluble protein content, and root activity) also showed quadratic relationships (increasing then decreasing) with an increase in water level. Conversely, POD activity and MDA content showed an inverted quadratic relationship, as they decreased then increased as water level increased. (3) We determined an optimum water level for T. orientalis growth of 14.43 cm, a range of limiting water levels for T. orientalis growth of −52 cm to 74.93 cm, with the range of −19.75 to 42.55 cm being the most suitable for growth. Water levels in excess of 74.93 cm and below −52 cm cannot facilitate the normal growth and development of T. orientalis.
Introduction
Ecological amplitude refers to the tolerance range of a certain organism to environmental factors, expressed as the range between its ecological highest point and lowest point (Han et al. Citation2019). In 1913, American ecologist Shelford V E proposed the concept of the law of tolerance which can be represented by a bell-shaped tolerance curve which limits organisms by the minimum and maximum amount of multiple ecological factors (Shelford Citation1913). Ecological amplitude reflects the relationship between plants and the environment and the adaptability of plants to the adverse environments, meaning that the ecological amplitude also has an important influence on the distribution of plants (Wu et al. Citation2004). The prediction and evaluation of species distribution works by linking the existence or abundance of species with environmental factors. Using the potential habitats of species under current wetland hydrological change scenario is essential to understand the response of species to different water environmental conditions (Francesco et al. Citation2014). The use of ecological thresholds to improve the efficiency of biodiversity conservation and natural resource management can help to determine the sensitivity of species to environmental stress (Li et al. Citation2020). The use of ecological amplitudes is common. Gaussian Models can be used to determine the ecological amplitude of Ahernanthera philoxeroides in order to provide a reference for invasive techniques and prevention (Liao et al. Citation2015). Ecological amplitudes can explain the abundance-distribution relationship of plant species with niche breadth and position (Yuan et al. Citation2011), and to find different suitability factors for different plants (Wen et al. Citation2018).
Water level is a key factor in the distribution and characteristics of T. orientalis (Chow-Fraser Citation2005). Plants growing at different water levels may grow at different rates and have different sizes and developmental stages at specific ages (Pan et al. Citation2012). Different water level gradients affect soil moisture, air diffusion, physical, biological, and chemical properties of soil, change the growth environment of vegetation, and affect the spatial distribution and ecological characteristics of vegetation (Cao Citation2007). The water demand of wetland vegetation typically falls under one of three categories: highest, lowest, and appropriate. Logically, if the water level is in a suitable range, the plant grows well. If the water level is lower or higher than the appropriate range, it will lead to the disorder of plant metabolism, stagnation of plant growth, and may even wither (Han et al. Citation2019).
T. orientalis is a common aquatic plant, found in Asia, Europe and North America. It has characteristics of strong adaptability, wide distribution, fast growth, and abundant biomass, which all make it suitable for periods of sustained flooding and exposed mudflats. T. orientalis also have a strong capability for sewage treatment (Muller et al. Citation2001; Kong Citation2011; Klink et al. Citation2016) and adsorption and removal of heavy metals (Xin and Huang Citation2017; Sasmaz et al. Citation2008).
In this work, we analyzed the influence of water level changes to the physiological and morphological characteristics of T. orientalis growth by taking water level as the main environmental gradient parameter, using the soil surface as a unified reference point. We explore the dependence of ecological amplitude on water level and determine optimal growth levels. Our results are conducive to understand the natural distribution of T. orientalis and its adaptability to water level change, and also reveals important insights about the seedlings ability to adapt to various water level changes.
Materials and methods
Test materials
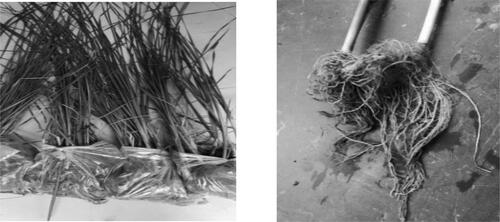
During March 2018, T. orientalis seedlings () were collected from the Aixi Lake wetland (28°41 ′52 ″ N, 115°59 ′26 ″E) in Nanchang City, Jiangxi province, China. T. orientalis seedlings were then placed in a sunlight cultivation room in the Key Laboratory of Poyang Lake Wetland and Watershed Research and Education (greenhouse). Polyethylene culture basins (length: 35 cm, width: 26 cm, height: 13 cm) with 10 plants in each basin were tested for three repetitions. Seedings with a height of about 50 cm were selected and planted in the culture basin (using a soil matrix of sandy loam). The seedlings were precultured in a glass chamber for 10 days to ensure a sufficient water supply every day. The main experiment began once the seedlings survived.
Figure 1. Seedlings of T. orientalis.
Test design
Before the experiment was carried out, the average water quality index of the tested water was showed in the .
Table 1. Average water quality index of test water (mg/L).
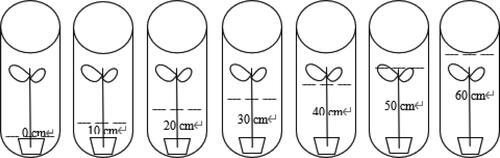
Seven different experimental groups for the groundwater depth of the T. orientalis seedlings were set. The depth values in each group were: C1 (groundwater depth 55.29 cm), C2 (groundwater depth 49.77 cm), C3 (groundwater depth 43.03 cm), C4 (groundwater depth 39.28 cm), C5 (groundwater depth 25.23 cm), C6 (groundwater depth 20.99 cm), and C7 (groundwater depth 18.78 cm), with three repetitions carried out for each group. Groundwater depth was observed each day, and the required water quality was supplemented according to the water content of the soil mass. Another seven groups were tested with submergence depths of: C0 (0 cm, CK group), C10 (10 cm), C20 (20 cm), C30 (30 cm), C40 (40 cm), C50 (50 cm), and C60 (60 cm) with three repetitions carried out for each group. At the same time, the soil water of all groups in the experiment was supplemented. As in the previous groups, the soil water of all groups in the experiment was supplemented daily. During high summer temperatures, the soil water was supplemented twice at an interval of 12 h. The growth of the 14 groups was measured every 6 days and the fresh leaves were cut every 30 days to perform physiological tests ().
Figure 2. Schematic diagram of testing setup design.
Index determination
Morphological index determination
Plant height increase was measured by tape and base diameter increase was measured by vernier caliper. Five plants were measured every six days, and the average was taken each.
Leaf length (from the leaf base to the tip) and width (the widest part of the leaf perpendicular to the main vein) were measured every 30 days with a ruler to calculate the leaf area. Leaf area = k*l*m, where l is leaf length, w is leaf width and k is 5/6 (Hu Citation2015).
The number of withered leaves were counted to the determine the withering rate. The rate of withered leaves is equal to the ratio of the number of withered leaves to the total number of leaves.
The water content of the leaves was measured by first taking its fresh weight by electronic balance, selecting healthy samples with uniform growth for each treatment, at an accuracy of 0.01 g. Dry weight measurement were then made by placing the sample into a constant temperature oven adjusted to 70 °C and baking it to a constant weight, after which it was immediately weighed. of the water content of each leaf (in %) is determined according to:
Where Wd is the dry weight of leaves and W is the fresh weight of leaves.
Finally, we determine leaf dry matter content (LDMC): defined as the ratio of leaf dry weight to leaf fresh weight in in units of mg/g, determined after the samples are dried continuously at (95 ± 5) °C for 35 h, according to:
Where Wi is the dry weight of the sample and W is the fresh weight of the sample.
Biomass determination
We next employ a biomass estimation model which uses a relative growth method to calculate plant biomass. We use tape to measure the vertical distance from the tip of the highest leaf to the soil surface to estimate plant height. The biomass measurement involves completely harvesting the above ground and underground parts after the test. The fresh weight is measured by electronic balance (accuracy of 0.1 g), then, it is dried in an oven at 120 °C for 45 min, dried at 70 °C to constant weight and cooled to room temperature, and its mass is measured as the dry weight.
Evaluation method of ecological range related to different water levels
We introduce the parameters u (Optimum) and t (Limit), which can be calculated by a polynomial (y = Ax2 + Bx + C). When the value of the environmental factor is equal to u, the growth state of plants is ideal, though this is very rare in the natural environment and has little ecological practicality. The environmental gradient can therefore be divided into most suitable, suitable, and limited regions. When the value of environmental factors is in the interval (u-t, u + t), the plant growth and development conditions are ideal, defined as the optimal ecological threshold range. When the value of environmental factors is within the interval of (u-2t, u + 2t), the plant growth and development conditions are good, defined as the appropriate threshold interval. When the environmental factor values are in the interval of (< u-2t, > u + 2t), the plant growth and development conditions are poor, defined as the limited interval.
Physiological index measurement
The fresh leaves of the plants were cut every 30 days to test for physiological measurements. The content of photosynthetic pigments (Chla, Chlb and Car) was determined by ethanol extraction colorimetry, the guaiacol method was used to measure peroxidase (POD). catalase (CAT) was determined by potassium permanganate titration, and the activity of superoxide dismutase (SOD) was determined by Nitroblue tetrazolium (NBT). Coomassie brilliant blue G-250 (Bradford method) was used to determine the content of soluble protein. Determination of malondialdehyde (MDA) content by thiobarbituric acid method, and root activity determinated by TTC (Wang Citation2015). All results were analyzed then statistically as mean values ± standard deviation using OriginPro 9.0.
Results
Growth characteristics changes of T. orientalis under different water level gradients
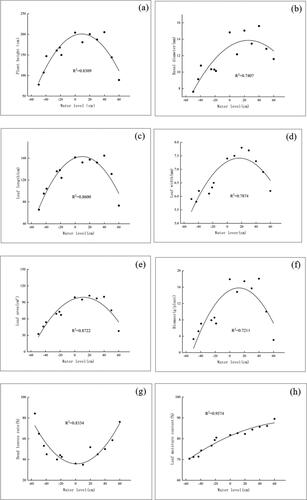
The growth characteristics of T. orientalis show a quadratic relationship to water level. The plant height, basal diameter, leaf length, leaf width, leaf area, and biomass all showed an increasing then decreasing trend as water level was increased. The dry leaf rate decreased then increased as water level was increased. This behavior was observed due to the fact that water level was either too high or too low (in the case of dry leaf rate) to allow efficient growth. The growth characteristics showed clear peaks at a water level of 14.43 cm and decreased in either direction from this value. The plant height was largest (200.80 cm) at a water level of 8.85 cm is the highest; the base diameter was largest (13.86 mm) at a water level of 25.27 cm; the leaf length was largest (162.98 cm) at a water level of 9.65 cm; the leaf width was largest (7.56 cm) at a water level of 18.75 cm; the leaf area was largest (99.28 cm2) at a water level of 11.53 cm; the biomass was largest (15.81 g/plant) at a water level of 12.5 cm. The dry biomass was largest at a water level of 1.33 cm, and the water content of the leaves increased linearly with increasing water level ().
Figure 3. Effect of water level on growth characteristics of T. orientalis seedlings.
Physiological changes of T. orientalis growth under different water levels
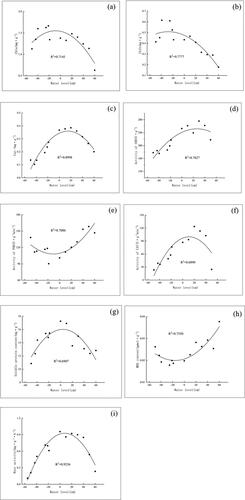
The physiological characteristics of T. orientalis also exhibit quadratic relationships to water level. The Chl a, Chl b, Car, SOD, CAT, soluble protein, and root activates increased then decreased with an increase of water level, while the activities of POD and MDA decreased then increased with an increase of water level. The physiological characteristics showed clear peaks at a water level of 14.429 cm and decreased away from this maximum. The content of Chl had a maximum value of 1.55 mg·g−1 at a water level of 6.75 cm; the content of Chlb had a maximum of 0.51 mg·g−1 at a water level of 30 cm; the content of Car had a maximum value of 0.36 mg · g−1 at a water level of 15 cm; the SOD activity had a maximum of 251.53 u·g−1 at a water level of 14.79 cm; and the CAT activity had a maximum of 101.80 U·g−1·min−1 at a water level of 11.29 cm. The content of soluble protein was maximum 16.02 mg·g−1) at a water level of 3.67 cm; the root system activity was at a maximum (0.93 m·g−1·h−1) at a water level of 8.50 cm; the POD activity was at a minimum (107.72 U·g−1·min−1) at a water level of −10.65 cm; the MDA content was at a minimum (0.02 μmol·g−1) at a water level of −13.33 cm ().
Figure 4. Effect of water level on physiological characteristics of T. orientalis seedlings.
The above indices are fitted to the water level changes, using a quadratic fitting equation of the form: y = Ax2 + Bx + C (where x represents water level, in units of cm) ().
Table 2. Quadratic fitting equations of physiological characteristics of T. orientalis seedling growth under different environmental water levels.
Evaluation of the sensitivity of ecological amplitude and growth physiology of T. orientalis seedlings to water level
Based on the quadratic fits, the optimal water level and limit interval of each measurement index are obtained (). The optimal water level for T. orientalis growth is about 14.43 cm, the maximum value of each measurement index is taken as the lowest growth limit interval, and the minimum value of each measurement index is taken as the highest growth limit interval.
Table 3. Evaluation of ecological threshold value of T. orientalis seedlings.
Discussion
The above-ground part of wetland plants experiences the most direct response to flooding depth. Plants adapt to this flooding stress by changing plant height and leaf area. The plant height, base diameter, and leaf characteristics of T. orientalis showed a decrease after they were subjected to different degrees of waterlogging stress. The flooding test lasted for 120 days, and the differences in the environment caused T. orientalis to adopt different growth and development strategies through selection. T. orientalis is a submergence-tolerant plant and can sustain 50-60 cm of flooding for 60 days. Flooding below 40 cm will cause almost no damage.
Plants which grow in a flooded environment can have a reduced ability to acquire essential resources if the flooding depth exceeds critical levels. In our experiments, we observed that the length, width and area of T. orientalis leaves generally decrease with an increase of flooding depth; the decrease of leaf area is the clearest change. Under flooding stress, the formation of new leaves of T. orientalis is blocked, the leaves turn yellow and fall off, and the plant grows slowly. The leaf water content increases with an increase of the flooding depth, and the leaf water content increases significantly with prolonged the flooding time. The rate of dead leaves in the experimental group decreased with an increase of flooding depth. The specific leaf area (SLA) of T. orientalis showed an overall increasing trend with an increase of flooding depth, while the leaf dry matter content (LDMC) showed an overall decreasing trend with the increase of flooding depth. The C0-C40 group has a relatively low waterlogging depth, its oxygen content is conducive to root growth, and the root cap is relatively high. The root-to-shoot ratio decreases with an increase of the flooding depth, as well as an extension of flooding time and interactions. The roots, stems, leaves and total biomass of each experimental group showed noticeable growth in the early stages and slower growth in the later stages. In general, the difference in plant biomass between the C0-C40 group and the C50-C60 group increased. These results demonstrate how plants can adjust their survival strategies according to the depth of submergence and give priority to nutrient distribution to extend the length of the stalk.
The content of chla, chlb and Car generally decreased with an increase of flooding depth. As the flooding time was extended, the photosynthetic pigment content of T. orientalis decreased significantly, and the photosynthesis of the plants rapidly weakened. The SOD activity of each experimental group increases under flooding and hypoxic conditions. T. orientalis can adapt to the anaerobic environment in a short time, and SOD activity decreases significantly over time. The waterlogging stress of the C20-C50 group makes T. orientalis more resilient to adversity, which improves POD activity. The CAT activity of T. orientalis was higher at 20-40 cm of flooding. When the flooding time (and the depth) was increased, CAT activity first increased and then decreased. The protein content of each test group was significantly different. Under suitable flooding conditions, the protein content in the plant increased during the growth and development of the plant. The content of MDA in the test group increased with an increase of the depth of waterlogging. Deeper waterlogging induced an increase in the content of MDA in the plants, resulting in a higher degree of peroxidation of plant cell membranes. A flooded environment profoundly affects the root vitality of plants; showing an overall decrease as flooding depth increases.
The content of Chl and Car increased first and then decreased as flooding time increased. During our experiment, T. orientalis plants were almost entirely covered by water (depth of 50-60 cm), which impaired photosynthesis. The photosynthetic rate of T. orientalis was significantly reduced in this flooded environment, and its leaves were seriously damaged. In other experiments, the growth characteristics of T. orientalis (including leaf number, stem thickness, plant height and density) were measured to determine that T. orientalis can be in a slightly deeper position (20-60 cm depth) (Li et al. Citation2015). The ratio of Car/Chl in 60 cm of flooding is greater than 1:3, indicating that the relative content of Chl in photosynthetic pigments is reduced and the photosynthetic capacity is reduced, as it cannot ensure sufficient reaction center pigments. The photosynthetic pigments of T. orientalis reached a higher value in 10-20 cm of flooding, which demonstrates that moderate flooding can be beneficial to photosynthesis. When there are undesirable changes in the habitat, plants often adapt in a way that is conducive to the maximization of photosynthesis (He et al. Citation2018). Plants can reduce oxygen consumption under low oxygen concentration and avoid hypoxia. Increasing O2 and CO2 to the leaves can minimize hypoxia and improve underwater photosynthesis.
The growth-related physiological indicators of T. orientalis can explain the response of plants to water depth. T. orientalis seedlings have a strong adaptability to flooding and can be used as a pioneer species in the restoration and reconstruction of wetland plants. However, long-term flooding will destroy the T. orientalis community. Studying the growth of T. orientalis in the optimal flooded area plays an important role in the sustainability of the ecological environment system.
We find here that the limiting water levels of T. orientalis growth are -52cm and 74.93 cm; water levels higher than 74.93 cm and lower than -52cm cannot allow normal growth and development. Physiological and ecological characteristics of T. orientalis, such as invasion, competition, and settlement, determines the size of the distribution area of the species. In general, the wider the ecological range, the greater the ability of plants to overcome environmental barriers. Our results suggest that there is an ecological threshold in the growth and development of T. orientalis, represented by the sensitivity of multiple indices to the test environment. The biomass, CAT, and root activity had a significant sensitivity to the water level environment. The quadratic fitting curves used here reflects the ‘threshold’ characteristics of wetland vegetation and their ideal water level requirements. In appropriate aquatic environments, vegetation has the ability of self-regulation, allowing them to withstand significant external pressure and stress. However, when the water supply exceeds the upper and lower limits of the appropriate range, it will have a limiting effect on plant growth, and the self-regulation ability of vegetation will be inhibited or may even cease.
Conclusion
We evaluated the sensitivity of the ecological amplitude of T. orientalis seedlings on different water levels and found the following: (1) The growth characteristics of T. orientalis exhibit a quadratic relationship to water level increases. Most growth indicators (plant height, basal diameter, leaf length, leaf width, leaf area and biomass) increased and then decreased with an increase of water level, while the dry leaf rate of T. orientalis decreased first and then increased with the increase of water level. The physiological characteristics of T. orientalis also exhibit quadratic relationships. Chl a, Chl b, Car, SOD, CAT, soluble protein content, and root activity all increased then decreased as water level increased, while POD and MDA content decreased then increased as water level increased. (2) The optimum water level for T. orientalis growth was found to be 14.43 cm, and the limiting interval of water level that allows T. orientalis growth is −52 cm to 74.93 cm. (3) The water level environment has a great impact on biomass, CAT, and root activity, and the quadratic curve reveals the ‘threshold’ feature of wetland vegetation which depends on water level. (4) T. orientalis showed a moderate tolerance to flooding. It is sensitive to soil water conditions and can withstand mild drought but does not have high tolerance under severe drought conditions. Morphological plasticity and biomass allocation enable T. orientalis to survive a combination of flood level and duration. This may explain the species' widespread presence in habitats which experience significant and sustained flooding. The results of our study will help to understand the effects of flooding on plants and the ways in which they adapt and respond to long-term flooding, as well as strengthening the control and management of T. orientalis species in constructed wetlands.
Disclosure statement
No potential conflict of interest was reported by the author(s).
Additional information
Funding
Notes on contributors
Yiting Chen
Chen Yi-Ting is a graduate student at Jiangxi Normal University. Her research interest is in submerged vegetation restoration.
Yun Cao
Cao Yun received his PhD from Nanjing Normal University in 2007. His research interests are in plant ecology and ecological restoration in wetlands. He is currently working on a research project about the ecological amplitude of beach-typical vegetation in Poyang Lake under a water level gradient.
Siwen Tang
Tang Si-Wen received his PhD from Jiangxi Normal University in 2019. His research interest is in submerged vegetation restoration.
Huixiong Huang
Huang Hui-Xiong is a graduate student at Jiangxi Normal University. His research interest is in submerged vegetation restoration.
Jiajun Qi
Qi Jia-Jun is a graduate student at Jiangxi Normal University. His research interest is in submerged vegetation restoration.
References
- Cao Y. 2007. Study on influencing factors and techniques of plant restoration in marshland. China: Nanjing Normal University.
- Chow-Fraser P. 2005. Ecosystem response to changes in water level of Lake Ontario marshes: lessons from the restoration of Cootes Paradise Marsh. Hydrobiologia. 539(1):189–204.
- Francesco T, FD, Giovanna JL, Hartwig HH, Rudolf HS. 2014. Predicting the geographical distribution of two invasive termite species from occurrence data. Environ Entomol. 43(5):1135–1144.
- Han Z, Wang SY, Liu XB, Peng WY, Ge G. 2019. Ecological threshold of dominant wetland vegetation in Poyang Lake based on flood duration gradient. J Hydraul Eng. 50(2):252–262.
- He YY, Wang CY, Yuan ZX, Li XX, Yang WH. 2018. Photosynthetic and physiological characteristics of Taxodium ascendens and Taxodium ascendens under different flooding intensities in the hydro-fluctuating zone of the Three Gorges Reservoir. Acta Ecol Sin. 38(8):121–130.
- Hu L. 2015. Study on the improvement of plant leaf area coefficient method. Chin Agric Sci Bull. 31(5):228–233.
- Klink A, Polechońska L, Cegłowska A, Stankiewicz A. 2016. Typha latifolia (broadleaf cattail) as bioindicator of different types of pollution in aquatic ecosystems-application of self-organizing feature map (neural network) ). Environ Sci Pollut Res Int. 23(14):14078–14086.
- Kong Y. 2011. The research on ecological function of aquatic plants in urban waterscape. Proceedings of 2011 International Symposium on Water Resource and Environmental Protection (ISWREP 2011) VOL.04.
- Li DK, He P, Xu J, Hou LP. 2020. Basic research on ecological threshold of ecosystems in my country. Chin J Appl Ecol. 31(6):2015–2028.
- Li CM, Ye XQ, Wu M, Shao XX. 2015. The influence of water depth and coexistence on the growth characteristics of reeds and Typha orientalis. Wetland Sci. 13(5):609–615.
- Liao XF, Long XQ, Li AD, Xie YG. 2015. Study on the ecological breadth of water depth based on plant height and coverage of Alternanthera philoxeroides in Caohai Wetland. J Zhejiang A F Univ. 32(4):643–647.
- Muller SL, Huggett DB, Rodgers JH. 2001. Effects of copper sulfate on Typha latifolia seed germination and early seedling growth in aqueous and sediment exposures. Arch Environ Contam Toxicol. 40(2):192–197.
- Pan Y, Xie YH, Chen XS, Li F. 2012. Effects of flooding and sedimentation on the growth and physiology of two emergent macrophytes from Dongting Lake wetlands. Aquat Bot. 100:35–40.
- Sasmaz A, Obek E, Hasar H. 2008. The accumulation of heavy metals in Typha latifolia L. grown in a stream carrying secondary effluent. Ecol Eng. 33(3-4):278–284.
- Shelford VE. 1913. Animal Communities in Temperate America: As Illustrated in the Chicago Region; a Study in Animal Ecology. Chicago (IL): Geographic Society of Chicago.
- Wang XK. 2015. Principles and techniques of plant physiological and biochemical experiments. China: Higher Education Press.
- Wen SY, Liu XZ, Wang ZZ, Yu J, Zhang FS, Liu YJ, Song LL. 2018. The temperature ecological range of Karenia mikimotoi and Prorocentrum donghaiensis under different light conditions. Acta Ecol Sin. 38(14):5187–5194.
- Wu JH, Zhang S, Jiang Y, Kang MY, Qiu Y. 2004. Phytogeography. 4th ed. China: Higher Education Press.
- Xin J, Huang B. 2017. Effects of pH on boron accumulation in cattail (Typha latifolia) shoots, and evaluation of floating islands and upward flow mesocosms for the removal of boron from wastewater. Plant Soil. 412(1-2):163–176.
- Yuan X, Ma K, De W. 2011. Explanation of the relationship between species distribution and abundance by plant niche and ecological range in the Yellow River Delta. Acta Ecol Sin. 31(7):1955–1961.