
Abstract
Changhu Lake, a large, shallow, eutrophic lake in central China, experienced an extremely low water level event from November 2015 to January 2016 followed by an extremely high water level event in July 2016. In this study, we examined the effects of two extreme water levels on the nutrient dynamics of Changhu Lake over five years. The nutrient parameters in Changhu Lake showed significant interannual variations, and the nutrient concentrations at the sites in the western part of Changhu Lake were 2–41% higher than those at the outlet of the lake. In late 2015, the effects of low water levels led to a 17–74% increase in nutrient concentrations. After July 2016, however, a high water level event occurred, leading to a 34–48% decrease in nutrient concentrations. These changes in nutrient parameters were strongly related to water level fluctuations (p < 0.05). As extreme water levels are likely to become more frequent during the twenty-first century, this work may provide some insights into the conservation and management of lake ecosystems in the face of climate change and human activity.
Introduction
Hydro-morphological stress is becoming one of the key ecological processes influencing the ecological integrity of global aquatic ecosystems (Wantzen et al. Citation2008; Zohary and Ostrovsky Citation2011; Evtimova and Donohue Citation2016). Hydrological regimes can affect aquatic communities, nutrient dynamics, seston composition, and other attributes of aquatic ecosystems in direct and indirect ways (Yang et al. Citation2016; Liu et al. Citation2018a; Kenney and Waters Citation2019). For example, water level fluctuations (WLFs) can indirectly affect seasonal variation in bacterial communities by controlling optimum levels of nutrient availability in lake ecosystems (Ren et al. Citation2019). As significant elements of hydrological regimes and natural phenomena that emerge in most aquatic ecosystems, WLFs have attracted much attention, yet their influence is still not fully understood (Evtimova and Donohue Citation2016; Gownaris et al. Citation2018; Liu et al. Citation2020).
Most lake ecosystems are subject to natural changes in water level at short and long time scales (García-Molinos and Donohue Citation2014). Natural variations in water level are essential for the survival of some aquatic communities and can generate more diverse and productive habitats (Coops and Hosper Citation2002; Leira and Cantonati Citation2008; Gownaris et al. Citation2018). However, humans have altered the natural patterns of WLFs through dam construction, water abstraction, and climate change (Haddeland et al. Citation2014). Extreme water levels could potentially affect the limnological characteristics of the entire lake system, such as nutrient dynamics (James and Havens Citation2005; Li et al. Citation2016), community structure and interactions (Wantzen et al. Citation2008; Gownaris et al. Citation2018), and water residence times (Brauns et al. Citation2007). WLFs can influence internal nutrient mixing and convert monomictic lakes into polymictic lakes (Zohary and Ostrovsky Citation2011). At lower water levels, increases in nutrient availability have been observed in previous studies (Coops and Hosper Citation2002; James and Havens Citation2005; Chen et al. Citation2011; Li et al. Citation2016). Thus, water level management can be considered a potential tool to improve water quality in freshwater ecosystems (Coops and Hosper Citation2002; Li et al. Citation2016). Previous studies have shown that shallow lakes are especially sensitive to WLFs and relatively minor changes in water level can translate into large variations in the lake surface area and water volume (Gownaris et al. Citation2017; Ren et al. Citation2019). Furthermore, shallow lake ecosystems may be dramatically impacted when the water level changes between 1 and 2 m (James and Havens Citation2005).
Given that changes in water level are predicted to occur more frequently in lake ecosystems worldwide, we aimed to (1) investigate the spatial and temporal variations in nutrient parameters related to extreme water levels and (2) examine the relationships between lake nutrients and water levels. Based on our results, we sought to predict the impacts of extreme water regimes on like nutrient dynamics and provide a potential tool for future lake management.
Materials and methods
Study area
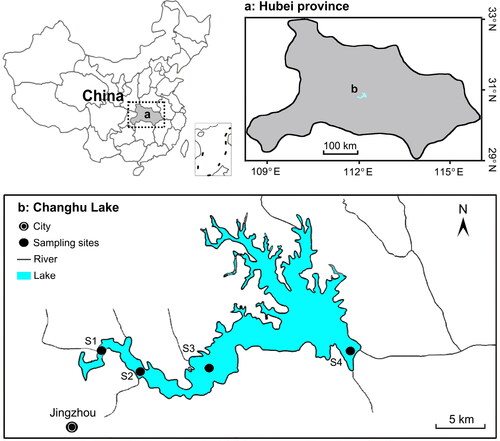
Changhu Lake is the third largest freshwater lake in the Hubei Province in central China, located in the Jianghan Plain of the middle region of the Yangtze River basin (30°22′–30°31′ N, 112°12′–112°30′ E, ). The lake connects to the Yangtze River through the Sihu Main Channel. The surface area is approximately 140 km2 and approximately 18 km wide at its widest zone, with a mean depth of 2.1 m and an elevation of 30–31 m above sea level. The area is subject to a typical subtropical monsoon climate, with a mean annual temperature of 15.9–16.6 °C and a mean annual total precipitation of 1100–1300 mm which is largely concentrated in mid-spring to mid-autumn.
Figure 1. Location of Changhu Lake and four sampling sites in Hubei province, central China.
Changhu Lake plays an important role in flood control, freshwater supply, fisheries and aquaculture, and biodiversity protection in the area. The lake is home to approximately 95 species of macrophytes, 77 species of fish, 29 species of birds (mostly migratory), 15 species of invertebrates, 12 species of reptiles, and 6 species of amphibians (Changhu Ecological Management Bureau, Jingzhou, China). However, Changhu Lake was classified as meso-eutrophic due to human activities (i.e. overexploitation, pollution, and habitat destruction) and climate change (Liu et al. Citation2018b), which causes strong degradation of water quality and biodiversity (Hao et al. Citation2015; Guo et al. Citation2017).
Sampling and sample analysis
Sampling campaigns were implemented at bimonthly intervals from 2014 to 2018 at four sites (). Site 1 (S1) was situated at the western part of Changhu Lake, and site 2 (S2) and site 3 (S3) were located in the central region of Changhu Lake. Site 4 (S4) was adjacent to the outlet of Changhu Lake, upstream of the Sihu Main Canal. Two liters of surface water samples were collected at each site with precleaned 5 L plastic buckets and preserved in a portable refrigerator before they were sent to the laboratory for further analysis. A total of 120 (4 sites × 6 months × 5 years) water samples were collected. The nutrient parameters, including total nitrogen (TN), ammonia nitrogen (NH4-N), total phosphorus (TP), and chemical oxygen demand (CODMn), were measured following standard methods described by Greenberg et al. (Citation1992). Data on daily water levels were taken from the Water Resources Bureau of the Hubei Province.
Statistical analysis
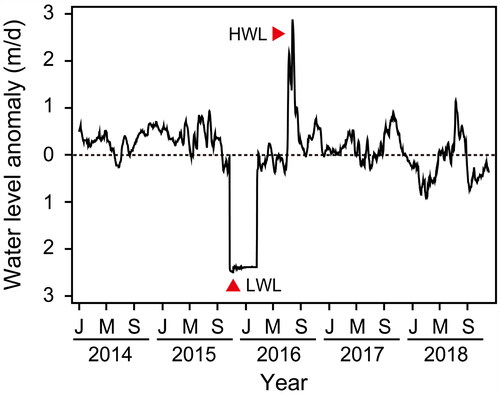
Extreme water levels are defined as monthly water level anomalies over 1 m in relation to the mean of historical data (James and Havens Citation2005). Across the whole 5-year time series, we identified one extremely low water level (LWL) event (November 2015 to January 2016) and one extremely high water level (HWL) event (July 2016) in Changhu Lake (). With this approach, the collected data were aggregated into three different phases: Before (samples before the 2015 LWL), After (samples from the 2015 LWL to the 2016 HWL), and Present (samples from the 2016 HWL to the end of the series).
Figure 2. Extreme water level events recorded over the full time series in Changhu Lake. LWL, extremely low water level event; HWL, extremely high water level event.
A multivariate technique, ANOSIM, was applied to examine the significant differences in nutrient parameters (TN, NH4-N, TP, and CODMn) among individual years, months, sites, and different phases related to the extreme water levels. Euclidean distance was calculated after the similarity matrix of the dataset was log(x + 1) transformed. Nonmetric multidimensional scaling (MDS) plots were built to explore the patterns of variations in nutrient parameters. Differences in nutrient parameters among years, months, sites, and water level phases were tested using one-way analysis of variance (ANOVA) for normally distributed data. Data normality was assessed using a Kolmogorov–Smirnov test. Principal component analysis (PCA) was performed to identify the overall trends in nutrient dynamics under different water level phases. Pearson correlation coefficients were used to explore the relationships among water levels, wind speed, and nutrients. All statistical analyses were performed using the software packages PRIMER 7.0 (Clarke and Gorley Citation2015), SPSS 19.0 (SPSS Inc., Chicago, IL, USA), Statistica 10.0 (Statsoft Inc., Tulsa, OK, USA), and CANOCO for Windows 4.5 (ter Braak and Smilauer Citation2002).
Results
Spatial and temporal variations in nutrient concentrations
The nutrient parameters of Changhu Lake showed significant interannual variations (p < 0.05; ; ). The highest annual mean concentrations of TN (3.11 ± 0.59 mg/L) and NH4-N (0.94 ± 0.29 mg/L) and the lowest annual mean concentration of CODMn (3.62 ± 0.82 mg/L) were recorded in 2016, while the highest annual mean concentrations of TP (0.19 ± 0.06 mg/L) and CODMn (4.85 ± 0.53 mg/L) were observed in 2014. The annual mean concentrations of TN (2.12 ± 0.50 mg/L), NH4-N (0.71 ± 0.20 mg/L), and TP (0.15 ± 0.04 mg/L) were significantly lower (p < 0.05) in 2017. The annual mean concentration of CODMn did not vary significantly between 2016 and 2017 (3.72 ± 0.58 mg/L). Thus, the nutrient concentrations of TN, NH4-N, TP, and CODMn in 2017 were the lowest of those measured throughout the whole study period.
Figure 3. Spatial and annual variations of (a) total nitrogen (TN), (b) ammonia nitrogen (NH4-N), (c) total phosphorus (TP), and (d) chemical oxygen demand (CODMn) in Changhu Lake.
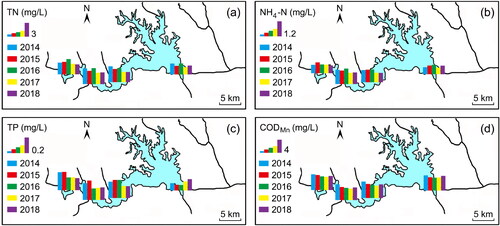
Table 1. Mean and standard deviation (SD) for several nutrient parameters investigated in Changhu Lake, and significance results of ANOVA test between 5 years (2014–2018).
Monthly variations in nutrient concentrations showed the opposite trend to spatial patterns (; ). TN, NH4-N, and TP had similar monthly variations during the study period. The monthly average minimum and maximum concentrations of TN (2.30 ± 0.66 and 2.66 ± 0.82 mg/L), NH4-N (0.73 ± 0.23 and 0.87 ± 0.29 mg/L), and TP (0.15 ± 0.05 and 0.17 ± 0.06 mg/L) occurred in March and July, respectively. No significant differences in the concentrations of TN, NH4-N, and TP were found between the different months, while the CODMn concentration showed the opposite trend. The highest monthly average CODMn concentration was detected in January (4.55 ± 0.65 mg/L) and the lowest was measured in September (3.61 ± 0.96 mg/L).
Figure 4. Spatial and monthly variations of (a) total nitrogen (TN), (b) ammonia nitrogen (NH4-N), (c) total phosphorus (TP), and (d) chemical oxygen demand (CODMn) in Changhu Lake.
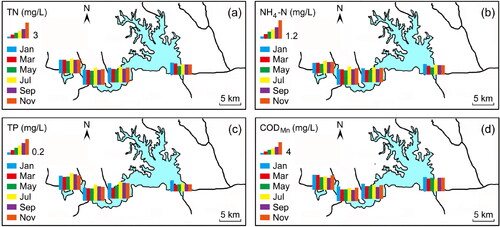
Table 2. Mean and standard deviation (SD) for several nutrient parameters investigated in Changhu Lake, and significance results of ANOVA test between 6 months (2014–2018).
The spatial patterns of the nutrient parameters varied across the sampling sites ( and ; ). The concentrations of TN, NH4-N, and TP were significantly different (p < 0.001) between the different sampling sites. At S4, the TN, NH4-N, and TP concentrations were significantly lower than those at other sampling sites, with mean values of 2.02 ± 0.51, 0.61 ± 0.19, and 0.11 ± 0.04 mg/L, respectively. The CODMn concentration in Changhu Lake varied between 1.77 and 6.87 mg/L throughout the sampling period, with a mean value of 4.16 ± 0.90 mg/L. No significant differences in CODMn concentrations were found between the four different sampling sites.
Table 3. Mean and standard deviation (SD) for several nutrient parameters investigated in Changhu Lake, and significance results of ANOVA test between the four sites (2014–2018).
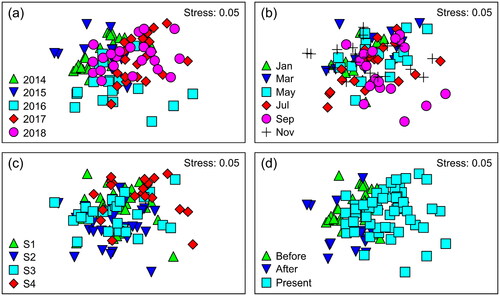
Overall, the nutrient status in Changhu Lake showed a distinct pattern of variation over the study period (). The nonmetric multidimensional scaling (MDS) had stress values lower than 0.15, indicating that the ordination patterns of nutrient parameters in Changhu Lake were acceptable. The results of the ANOSIM revealed that the distribution of nutrient parameters was significantly different among years (Global R = 0.206, p = 0.001), sampling sites (Global R = 0.116, p = 0.001), and phases (Global R = 0.191, p = 0.001) related to extreme water levels (). Months (global R = 0.006, p = 0.327) presented an R-value close to 0, indicating a high degree of monthly similarity ().
Figure 5. Non-metric multidimensional scaling (MDS) plots of nutrient parameters in Changhu Lake for different (a) years, (b) months, (c) sampling sites, and (d) phases related to the extreme water levels. Before, samples from January 2014 to September 2015; After, samples from November 2015 to July 2016; Present, samples from September 2016 to November 2018.
Relationships between nutrient concentrations and water levels
Extreme water levels had different impacts on nutrient concentrations in Changhu Lake (). Significant increases in nutrient concentrations were observed during the LWL event. In contrast, the nutrient concentrations exhibited abrupt and significant declines following the HWL event. The concentration of TN was significantly different (p < 0.001) between the three phases related to the extreme water levels (; ). The highest TN was recorded after the LWL event from November 2015 to January 2016 (After), with a mean value of 3.29 ± 0.55 mg/L. During the pre-LWL period (Before) and at the end of the time period (Present), the TN was significantly lower than that after the LWL period, with mean values of 2.62 ± 0.48 and 2.28 ± 0.52 mg/L, respectively. The variability in NH4-N exhibited a trend similar to that of the TN (; ). The concentration of NH4-N in the After phase (1.06 ± 0.24 mg/L) was significantly (p < 0.001) higher than that in the Before (0.79 ± 0.20 mg/L) and Present (0.74 ± 0.21 mg/L) phases. No significant differences in NH4-N were found between the Before and Present phases. The concentration of TP in the Present (0.15 ± 0.05 mg/L) phase was significantly (p < 0.001) lower than that in the Before (0.18 ± 0.05 mg/L) and After (0.19 ± 0.06 mg/L) phases (; ). However, TP did not vary significantly between the different phases related to the LWL event. The concentration of CODMn showed the same pattern as TP, with the lowest value in the Present (3.85 ± 0.80 mg/L) phase (; ). Despite this, the CODMn in the After phase (4.31 ± 1.10 mg/L) was significantly (p < 0.05) lower than that before the LWL event (4.62 ± 0.69 mg/L).
Figure 6. Time series of (a) total nitrogen (TN), (b) ammonia nitrogen (NH4-N), (c) total phosphorus (TP), and (d) chemical oxygen demand (CODMn) in Changhu Lake. LWL, extremely low water level event; HWL, extremely high water level event.
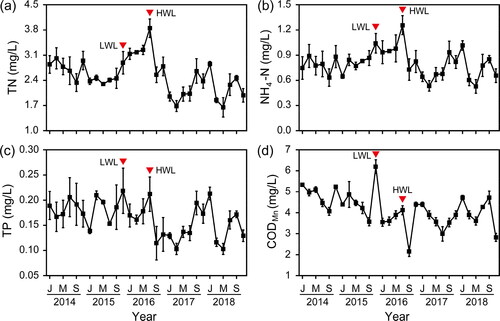
Figure 7. (a) total nitrogen (TN), (b) ammonia nitrogen (NH4-N), (c) total phosphorus (TP), and (d) chemical oxygen demand (CODMn) in Changhu Lake during different phases related to the extreme water levels. Before, samples from January 2014 to September 2015; After, samples from November 2015 to July 2016; After, samples from September 2016 to November 2018.
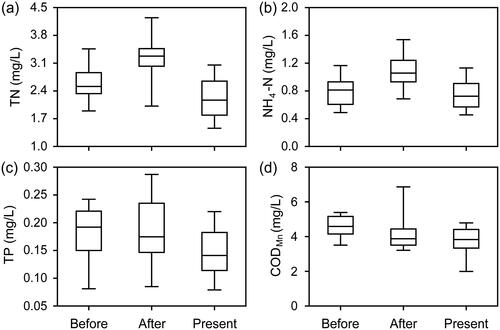
Table 4. Minimum, maximum, median, mean, standard deviation (SD), and number of values (n) for several nutrient parameters during the three periods related to extreme water levels in Changhu Lake from 2014 to 2018.
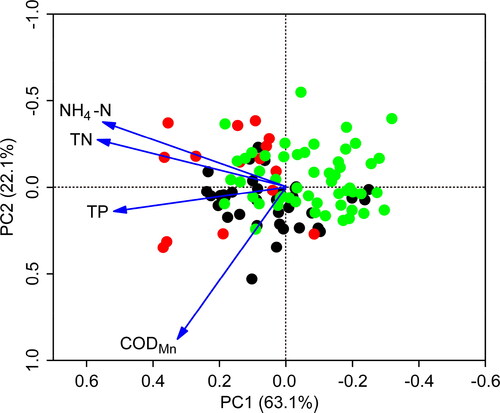
Our correlation-based principal component analysis (PCA) clearly showed the loading of nutrient parameters during the period before and in the aftermath of extreme water levels (). The first component (PC1) was strongly and negatively correlated with TN, NH4-N, and TP, suggesting a high nutrient load in the Before and After phases. The second component (PC2) was largely contributed by CODMn and represented a decline in organic matter after the HWL event (Present).
Figure 8. Principal component analysis of nutrient parameters (solid lines with arrowhead) in Changhu Lake. The samples from January 2014 to September 2015 are shown as black (Before), the samples from November 2015 to July 2016 as red (After), and the samples from September 2016 to November 2018 as green (Present). TN, total nitrogen; NH4-N, ammonia nitrogen; TP, total phosphorus; CODMn, chemical oxygen demand.
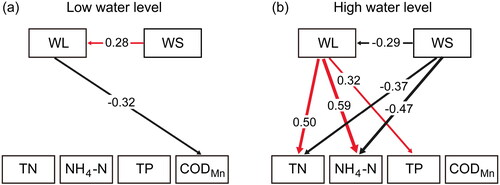
The relationships between water level and nutrient concentrations were complex. The concentration of CODMn was high at the low water level stage, whereas TN, NH4-N, and TP concentrations increased with rising water level (). Furthermore, the wind speed had direct and indirect effects on nutrient concentrations in Changhu Lake (). At the high water level stage, the wind speed was significantly negatively correlated with TN and NH4-N.
Figure 9. Path diagrams showing how water levels affect nutrient parameters in Changhu Lake. Results derive from Pearson correlation coefficient analysis. The values along the pathways represent Pearson correlation coefficients, and arrow thickness is proportional to the correlation coefficients. Pathways were selected only if p < 0.05. Red arrows represent positive relationships, and black arrows represent negative relationships. TN, total nitrogen; NH4-N, ammonia nitrogen; TP, total phosphorus; CODMn, chemical oxygen demand; WL, water level; WS, wind speed.
Discussion
Fluctuations in water level have been described as one of the main disturbances of aquatic ecosystems due to the combined effects of climate change and human activity (Wantzen et al. Citation2008; Yang et al. Citation2017; Gownaris et al. Citation2018). In fact, WLFs can affect nutrient dynamics by altering water residence times (Brauns et al. Citation2007), vertical mixing regimes (Liu et al. Citation2012), and water-sediment interface (Rørslett, Citation1985). Here, we examined the impacts of extreme water levels on nutrient parameters in Changhu Lake in central China. Nutrient concentrations increased and decreased following a marked decline and rise in water levels, respectively. This result is consistent with a previous study in Poyang Lake (Liu et al. Citation2019), suggesting that the water level was an important driver of nutrient variations. This is important because WLFs are likely to be more frequent under predicted future conditions of global warming and freshwater demands (Evtimova and Donohue Citation2014; Yang et al. Citation2016; Gownaris et al. Citation2018).
The nutrient parameters considered in this study showed significant interannual variations. The lake had high nutrient concentrations during 2014–2016 and low nutrient concentrations during 2017–2018. Lake restoration projects, such as the removal of closed aquaculture areas, artificial breeding and release of fish and benthos, cultivation of aquatic macrophytes, and ecological revetment for lake banks, may result in reduced nutrient concentrations and improve lake water quality (Yang et al. Citation2020). Meanwhile, an extremely high water level event was identified during the second half of 2016, followed by an abrupt decline in nutrient concentrations due to strong dilution effects (). This observation suggested that the interannual variations in nutrient concentrations can be affected by both restoration efforts and hydrological changes.
Changhu Lake also showed monthly variations in its nutrient concentrations during the study period, with significant changes in nutrient concentrations observed in November 2015 and September 2016. The present work demonstrated that the monthly changes in nutrient concentrations varied with water level fluctuations. In November 2015, an abrupt increase (e.g. 17–74%) in nutrient concentrations was recorded in correlation with low water levels. After July 2016, however, the nutrient concentrations significantly declined (e.g. 34–48%) following the high water levels. This finding was in accordance with previous results from China’s Poyang Lake (Li et al. Citation2016; Wang et al. Citation2021) and some subtropical reservoirs (Yang et al. Citation2017), which indicated that extreme water levels can lead to significant differences in nutrients due to strong concentration and dilution effects.
The nutrient concentrations in Changhu Lake showed significant spatial variations. Spatially, the nutrient concentrations at the outlet of the lake were different from those at sites located in the western part of the lake. The field survey revealed that S1, S2, and S3 have higher concentrations of TN, NH4-N, and TP due to receiving a large amount of pollutants from the Longhuiqiao, Taihugang, and Shiqiao rivers, which accounted for approximately 85% of the nutrient loads in Changhu Lake (Yu et al. Citation2016). Consistent with the previous observations, S4 had the lowest nutrient concentrations and a relatively high CODMn. Such a difference between the two parts of the lake may be attributed to the growth of aquatic plants that could significantly decrease the concentration of nutrients and suspended particles (Tan et al. Citation2021).
The nutrient concentrations in Changhu Lake varied significantly throughout the study period and were related to the extreme water levels. The lake had an increase in all the nutrient parameters during and/or following the decrease in water levels. This increase may be associated with wind-induced bottom sediment resuspension (James and Havens Citation2005) and a combination of high precipitation (with a greater nutrient input) and artificial water transfer (Guo Citation2017), which reduces submerged aquatic vegetation and periphyton that compete for nutrients and boosts the dominance of cyanobacteria. During the After period, the nutrient concentrations remained at high levels due to the stability of the WLFs. However, during the Present period, a declining trend in nutrient concentrations was observed following the extremely high water level (HWL) event. These results agree with those of Yang et al. (Citation2017), who reported that due to the dilution effect, extreme WLFs can significantly reduce nutrient concentrations.
The nutrient concentrations in Changhu Lake showed strong correlations with water levels. The concentration of CODMn increased with declining water level, which indicated that a low water level can increase the concentration of organic pollutants in the water column. Similar results have been obtained in other works where the gradual lowering of water levels also had a negative effect on CODMn (Li et al. Citation2016, Citation2019). A lower water level may dredge up bottom sediments and decrease the lake water quality by lowering the hydrological connectivity and increasing water flow velocities and wind speeds (James and Havens Citation2005; Stefanidis and Papastergiadou Citation2013). However, at the high level stage, nutrients (i.e. TN, NH4-N, and TP) were significantly and positively correlated with water levels (). This result was consistent with field observations from China’s largest freshwater lake (Wang et al. Citation2021), indicating that nutrients are likely to be more frequently exchanged between rivers and lakes under high water levels. Although nutrient concentrations increased with rising water levels, the nutrient concentrations under low water levels were higher than those under high water levels. This phenomenon is consistent with previous works from two large subtropical lakes (Wang et al. Citation2012, Citation2021), which suggested that a higher water level also resulted in the dilution of nutrients within the lake. Moreover, during the two stages, the water level showed significant inverse relationships with wind speed. Due to the relatively weak effects of wind speed on nutrients, this study mainly focused on the water level effect in Changhu Lake.
Based on our study, we demonstrated that fluctuations in the water level can affect nutrient dynamics by influencing hydrological conditions and other environmental variables in Changhu Lake. According to the local lake management agency, Changhu Lake is an important source of drinking and irrigation water for the Sihu Basin. The proposed Changhu Dam will be used to control the water flowing into the basin and result in significant changes in the water regimes. As WLFs are likely to become more frequent during the twenty-first century, local managers can focus on the water levels within Changhu Lake to improve the water quality of the lake in the face of human activity and climate change.
Conclusion
This study highlights the impacts of extreme water levels on nutrient dynamics in a large shallow eutrophic lake in central China. The nutrient parameters in Changhu Lake showed significant temporal variations over the study period, especially interannual variations. Spatially, the nutrient concentrations at the outlet of the lake were significantly different from those at sites in the western part of the lake, which showed a relatively low nutrient status. The nutrient parameters significantly changed between the different phases related to the extreme water levels, with an increase during the After period and a decrease during the Present period. Given that extreme water levels are likely to occur more frequently under future climate change and human activities, our research may be helpful for the conservation and management of Changhu Lake.
Disclosure statement
The authors declare no competing interests.
Data availability statement
The data that support the findings of this study are openly available in figshare at http://doi.org/10.6084/m9.figshare.17213135.
Additional information
Funding
References
- Brauns M, Garcia XF, Pusch MT, Walz N. 2007. Eulittoral macroinvertebrate communities of lowland lakes: discrimination among trophic states. Freshwater Biol. 52(6):1022–1032.
- Chen X, Yang XD, Dong XH, Liu Q. 2011. Nutrient dynamics linked to hydrological condition and anthropogenic nutrient loading in Chaohu Lake (southeast China). Hydrobiologia. 661(1):223–234.
- Clarke KR, Gorley RN. 2015. PRIMER v7: user manual/tutorial. Plymouth: PRIMER-E Ltd.
- Coops H, Hosper SH. 2002. Water-level management as a tool for the restoration of shallow lakes in the Netherlands. Lake Reserv Manage. 18(4):293–298.
- Evtimova VV, Donohue I. 2014. Quantifying ecological responses to amplified water level fluctuations in standing waters: an experimental approach. J Appl Ecol. 51(5):1282–1291.
- Evtimova VV, Donohue I. 2016. Water-level fluctuations regulate the structure and functioning of natural lakes. Freshw Biol. 61(2):251–264.
- García-Molinos J, Donohue I. 2014. Downscaling the non-stationary effect of climate forcing on local-scale dynamics: the importance of environmental filters. Clim Change. 124(1–2):333–346.
- Gownaris NJ, Pikitch EK, Aller JY, Kaufman LS, Kolding J, Lwiza KMM, Obiero KO, Ojwang WO, Malala JO, Rountos KJ. 2017. Fisheries and water level fluctuations in the world's largest desert lake. Ecohydrology. 10(1):e1769.
- Gownaris NJ, Rountos KJ, Kaufman L, Kolding J, Lwiza KMM, Pikitch EK. 2018. Water level fluctuations and the ecosystem functioning of lakes. J Great Lakes Res. 44(6):1154–1163.
- Greenberg AE, Clesceri LS, Eaton AD. 1992. Standard methods for the examination of water and wastewater. Washington: American Public Health Association.
- Guo K, Peng T, Luo JB, Yang DG, He YF, Chai Y. 2017. Community structure of zooplankton and the driving physio-chemical factors in Lake Changhu. Oceanol Limnol Sinica. 48(1):40–49.
- Guo K. 2017. Characteristics of phytoplankton community and water quality assessment in Changhu Lake Dissertation. Jingzhou, China: Yangtze University.
- Haddeland I, Heinke J, Biemans H, Eisner S, Flörke M, Hanasaki N, Konzmann M, Ludwig F, Masaki Y, Schewe J, et al. 2014. Global water resources affected by human interventions and climate change. Proc Natl Acad Sci U S A. 111(9):3251–3256.
- Hao MX, Yang L, Kong XH, Xu X, Lu W, Li ZQ. 2015. Diversity and community succession of macrophytes in Lake Changhu, Hubei province. J Lake Sci. 27(1):94–102.
- James RT, Havens KE. 2005. Outcomes of extreme water levels on water quality of offshore and nearshore regions in large shallow subtropical lake. Arch Hydrobiol. 163(2):225–239.
- Kenney WF, Waters MN. 2019. Exploring the influence of hydrology on the threshold phosphorus-loading rate in shallow lakes. Watershed Ecol Environ. 1:10–14.
- Leira M, Cantonati M. 2008. Effects of water-level fluctuations on lakes: an annotated bibliography. Hydrobiologia. 613(1):171–184.
- Li B, Yang GS, Wan RR, Zhang Y, Dai X, Chen YW. 2016. Spatiotemporal variability in the water quality of Poyang Lake and its associated responses to hydrological conditions. Water. 8(7):296.
- Li YL, Zhang Q, Cai YJ, Tan ZQ, Wu HW, Liu XG, Yao J. 2019. Hydrodynamic investigation of surface hydrological connectivity and its effects on the water quality of seasonal lakes: insights from a complex floodplain setting (Poyang Lake, China). Sci Total Environ. 660:245–259.
- Liu L, Liu DF, Johnson DM, Yi ZQ, Huang YL. 2012. Effects of vertical mixing on phytoplankton blooms in Xiangxi Bay of Three Gorges Reservoir: implications for management. Water Res. 46(7):2121–2130.
- Liu Y, Ren Z, Qu XD, Zhang M, Yu Y, Peng W. 2020. Seasonal water level fluctuation and concomitant change of nutrients shift microeukaryotic communities in a shallow lake. Water. 12(9):2317.
- Liu T, Xia ZH, Zhu L. 2018b. Influence of meteorological factors on temporal and spatial variation of water quality in Changhu Lake, Hubei Province. Adv Meteorol Sci Technol. 8(5):78–80.
- Liu J, Chen Y, Li M, Liu B, Liu X, Wu Z, Cai Y, Xu J, Wang J. 2019. Water-level fluctuations are key for phytoplankton taxonomic communities and functional groups in Poyang Lake. Ecol Indic. 104:470–478.
- Liu L, Guan YT, Qin TJ, Wang YY, Li HL, Zhi YB. 2018a. Effects of water regime on the growth of the submerged macrophyte Ceratophyllum demersum at different densities. J Freshw Ecol. 33(1):45–56.
- Ren Z, Qu XD, Zhang M, Yu Y, Peng W. 2019. Distinct bacterial communities in wet and dry seasons during a seasonal water level fluctuation in the largest freshwater lake. Front Microbiol. 10:1167–1167.
- Rørslett B. 1985. Death of submerged macrophytes – actual field observations and some implications. Aquat Bot. 22(1):7–19.
- Stefanidis K, Papastergiadou E. 2013. Effects of a long term water level reduction on the ecology and water quality in an eastern Mediterranean Lake. Knowl Manag Aquat Ecosyst. 411:5.
- Tan FX, Luo JB, Gong SS, Zhou WB, Xiang MM, Meng JX, Chai Y. 2021. Diversity, niche breadth and niche overlap of aquatic plants in Lake Changhu after removing breeding seines. T Oceanol Limnol. 43(2):111–117.
- ter Braak CJF, Smilauer P. 2002. CANOCO reference manual and CanoDraw for Windows user's guide: software for canonical community ordination (version 4.5). Ithaca: USA Microcomputer Power.
- Wang SY, Gao Y, Jia JJ, Kun S, Lyu S, Li Z, Lu Y, Wen X. 2021. Water level as the key controlling regulator associated with nutrient and gross primary productivity changes in a large floodplain-lake system (Lake Poyang), China. J Hydrol. 599:126414.
- Wang X, Xiao WH, Zhu WY, Shi X. 2012. Effects of water level variation on water quality in Dongting Lake. South-to-North Water Divers. Water Sci Technol. 10(5):59–62.
- Wantzen KM, Rothhaupt KO, Mörtl M, Cantonati M, László G, Fischer P. 2008. Ecological effects of water-level fluctuations in lakes: an urgent issue. Hydrobiologia. 613(1):1–4.
- Yang JR, Lv H, Isabwe A, Liu LM, Yu XQ, Chen HH, Yang J. 2017. Disturbance-induced phytoplankton regime shifts and recovery of cyanobacteria dominance in two subtropical reservoirs. Water Res. 120:52–63.
- Yang J, Lv H, Yang J, Liu LM, Yu XQ, Chen HH. 2016. Decline in water level boosts cyanobacteria dominance in subtropical reservoirs. Sci Total Environ. 557–558:445–452.
- Yang J, Wang HY, Chai Y. 2020. The effect of ecological restoration on spatial and temporal variations of water quality in Changhu Lake. China Rural Water Hydropower. 7:77–81.
- Yu MY, Xu SJ, Xu JH. 2016. Analysis of spatial-temporal distribution and impact factors of water quality in Changhu Lake. Environ Monit China. 32(5):73–79.
- Zohary T, Ostrovsky I. 2011. Ecological impacts of excessive water level fluctuations in stratified freshwater lakes. Inland Waters. 1(1):47–59.