
 ?Mathematical formulae have been encoded as MathML and are displayed in this HTML version using MathJax in order to improve their display. Uncheck the box to turn MathJax off. This feature requires Javascript. Click on a formula to zoom.
Abstract
To study the response of the Vallisneria natans morphological and physiology to water level change, seedlings were placed in a submerged condition at depths ranging from 50 cm to 135 cm and set the rising and declining water levels respectively (0.2 cm/d, 0.5 cm/d, 0.8 cm/d, 1.1 cm/d, 1.4 cm/d, 1.7 cm/d). After 50 days of simulation experiment, we observed the effects on plant height, the number of blades, root activity, biomass, chlorophyll a (Chl a), chlorophyll b (Chl b), chlorophyll (a + b) (Chl a + b), carotenoid (Car), soluble protein (SP) and soluble sugar (SS) of V. natans under different water level change rates. The results showed that (1) plant height and the number of blades showed an overall upward trend under the condition of high-rate water level change, while the low-rate change of water level showed a trend of first rising and then decreasing. (2) the root activity of 0.5–1.7 cm/d groups increased with the test time at rising water level, and the declining water level showed a trend of increasing and then decreasing. The total biomass showed an upward trend with the extension of the test time. (3) Chl a, Chl b, Chl (a + b), and Car showed a multi-peak downward trend with the extension of the test time. (4) the response of SP and SS to the test time showed a trend of first increase and then decrease with water level changes. In conclusion, our study demonstrates that the morphological and physiology of V. natans could adapt to water level changes, but it could be stressed if the water level exceeded the suitable range.
Introduction
In recent years, global climate change and human activities had a direct impact on the hydrological cycle (Jeppesen et al. Citation2015), leading to an increase in the probability of natural disasters such as floods (Arnell and Gosling Citation2016) or droughts (Allen et al. Citation2010), which in turn leads to water level changes and affects the structure and function of wetland ecosystems (Coops et al. Citation2003; Leira and Cantonati Citation2008). Submerged macrophytes are the key components of the wetland ecosystem, which can effectively increase spatial niche and dissolved oxygen in water and have good effects on water eutrophication management and water clarity maintenance (De Backer et al. Citation2012; Zeng et al. Citation2017). The water level changes will cause related changes in many environmental factors, such as water temperature, light attenuation coefficient, suspended matter, dissolved oxygen, and sediment, which will lead to changes in the growth and physiological morphology of submerged vegetation (Voesenek et al. Citation2006; Zhao et al. Citation2021). Studies have shown that moderate disturbance is conducive to maintaining species diversity, plant growth, and community productivity (Lenssen and De Kroon Citation2005; Peintinger et al. Citation2007; Mjelde et al. Citation2013). However, when the intensity of disturbance exceeds a certain threshold, the plant community is frequently harmed (Belote et al. Citation2012). Eventually, it will lead to wetland eutrophication and degradation of structure and function.
Vallisneria natans is a perennial, rooted, submerged plant that is distributed widely in fresh water in China (Wang et al. Citation2008), and it plays an important role in maintaining and stabilizing the balance of freshwater ecosystems. V. natans is a shade plant, which is highly adaptable to low light, and excessive light intensity may inhibit its growth (Li and Xie Citation2013). Previous studies have shown that V. natans grows well at stable water levels below 120 cm. Exceeding this water depth can result in too much or too little sunlight, which can inhibit photosynthesis (Cao et al. Citation2019). V. natans mainly focus on water purification (H. M. Li et al. Citation2020), germination temperature (Ke and Li Citation2006), heavy metal enrichment (Xing et al. Citation2013), and chlorophyll fluorescence (Cao et al. Citation2016), etc. Due to global climate change and human activities, the hydrological conditions in the natural habitat of the submerged plant V. natans have become more complex with dramatic water level changes. However, the effect of water level change rates on the morphological and physiology of V. natans is still unknown.
In this study, the morphological and physiological indicators (such as morphological characteristics, photosynthetic pigment content, osmotic adjustment substance content, root activity, and biomass) of V. natans were studied through the micro-experiment of indoor simulated water level changes, to explore the internal limiting factors affecting the growth and development of submerged plants V. natans under the different change rates of natural water level. To determine the suitable conditions of change rates of water level for the growth of V. natans and reveal the physiological and ecological response and adaptation mechanism under different water level change rates. And it can provide a reference for the recovery of submerged plants and ecological management of eutrophic water. Meanwhile, it can also provide a theoretical basis for the introduction, production and application in different fields.
Materials and methods
Test materials
In September 2020, V. natans was collected from Nanji Wetland Nature Reserve of Poyang Lake (28°55′45″N,116°19′44″E), and the water depth of the sampling site was 1 ∼ 2 m. The V. natans seedlings were placed in a sunlight cultivation room in the Key Laboratory of Poyang Lake Wetland and Watershed Research and Education (greenhouse). We selected V. natans seedlings with well-preserved rhizomes, root activity intact and positive growth as experimental plants. The selected seedlings were planted in cylindrical plastic basins (17 × 16 × 13 cm), each with 10 plants and 60 pots. The test basin is tied with a rope for easy access during the later data acquisition. Then the plastic basins were transferred to the test pool (3.5 × 1.7 × 0.92 m).
Test design
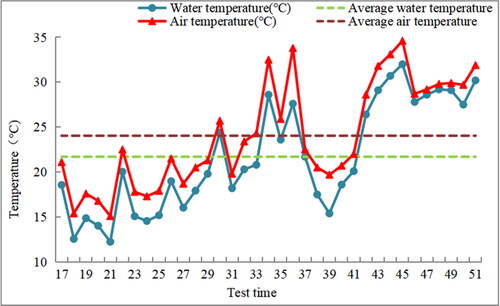
In March 2021, V. natans propagates through winter buds. The seedlings with approximately uniform morphology and good growth were selected for pre-cultured for 2 weeks. The average height of V. natans reached 15.67 cm after pre-culture. The experiment adopted the double pot method, in which the plastic basin was put into a glass barrel (top diameter:57 cm, bottom diameter:45 cm, height:150 cm), and water level was 50 cm. Each glass barrel had a small hole of 4 cm in diameter at 10 cm from the bottom, usually sealed with a rubber plug, which can be used to adjust the height of the water level in the glass barrel. The substrate was meadow marsh soil of Poyang Lake wetland (pH value 5.36, organic matter and total nitrogen content 42 and 1.96 g/kg, respectively). During the experiment, the average water temperature was (21.7 ± 5)°C, the average air temperature was (24.4 ± 5)°C, and the light was natural light (). The duration of light was 12.78 ± 0.39 hours.
Figure 1. Water temperature and air temperature during the experiment.
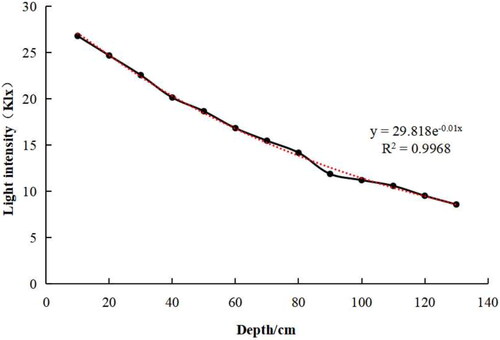
Light intensity is one of the major primary factors affecting the growth of submerged macrophytes in water bodies. The transmission of light in water can be approximated as an exponential decay function:
IZ and I0 are the light intensities at water depth z and the surface, respectively. The attenuation coefficient E in the vertical direction indicates how fast the light decays in the water body. The distribution of light in the test water can be fitted as:
The attenuation coefficient of light in water was E = 0.01, and the light intensity at the water depth of 100 cm was 11.22 klx. The light intensity was significantly negatively correlated with the water depth ().
Figure 2. The changes of underwater light in experiment.
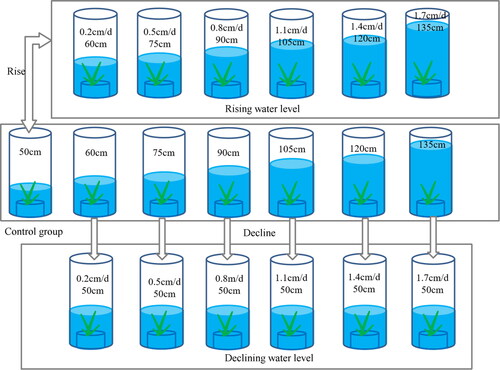
The controlled experiment of water level change was carried out at 19:00 on March 18, 2021. Two treatment cases of rising and declining water level were set. Each treatment had 6 test groups, a total of 12 test groups, and we chose the stable water level as a control. Each treatment was repeated three repetitions. The morphological and physiological indexes of V. natans were measured every 10 days. The water level was controlled at 19:00 every day to reach the set value. The water in the glass barrel was changed every 10 days. The initial rising water level was 50 cm. After 50 days, the water level groups rose to 60 cm, 75 cm, 90 cm, 105 cm, 120 cm, 135 cm, respectively. The rising rates were 0.2 cm/d, 0.5 cm/d, 0.8 cm/d, 1.1 cm/d, 1.4 cm/d, 1.7 cm/d. The initial declining water levels were 60 cm, 75 cm, 90 cm, 105 cm, 120 cm, 135 cm. Each declining water level groups dropped to 50 cm after 50 days ().
Figure 3. Schematic diagram of experiment design.
Index determination
Morphological index determination
Plant height increase was measured by tape and counted the number of leaves. Five plants were measured every ten days, and the average was taken each. Biomass was measured on days 0, 25, and 50 of the experiment. The biomass measurement involves completely harvesting the above-ground biomass (AGB) and below-ground biomass (BGB) after the test. The biomass was measured by electronic balance (accuracy of 0.0001 g). Then, it is dried in an oven at 105 °C for 20 min, dried at 75 °C to constant weight, and cooled to room temperature, and its mass is measured as the dry weight.
where TB refers to total biomass, AGB refers to above-ground biomass, BGB refers to below-ground biomass.
Physiological index measurement
The content of photosynthetic pigments, including chlorophyll a (Chl a), chlorophyll b (Chl b), chlorophyll (a + b) (Chl a + b), and carotenoid (Car), was determined by ethanol extraction colorimetry. Soluble protein (SP) was determined by Coomassie brilliant blue G-250 (Bradford method). Soluble sugar (SS) was determined by Anthrone colorimetric method. And root activity was determined by triphenyl-tetrazolium chloride (TTC). The physiological index determination method is Principles and Techniques of Plant Physiological and Biochemical Experiments prepared by Wang Xuekui (Wang Citation2015).
Statistical analysis
All data analyses were performed with the Excel 2016 and SPSS 22.0 software, and the graphs were drawn using Origin 2022. The data shown are mean ± standard deviation (SD). The results were examined by the two-way analysis of variance (ANOVA) in order to test the effect of water level change rate, test time and their interactions in each of the morphological and physiological index. One-way analysis of variance (ANOVA) was performed to compare differences among different water level change rates and test time, and LSD test was used to test the significance (P < 0.05). Pearson correlation coefficient was used to analyze the correlation between various morphological and physiological indicators. Statistical significance was set at P < 0.05 (significant correlation) or P < 0.01 (extremely significant correlation).
Results and analysis
The influence of water level changes on the morphological characteristics of V. natans
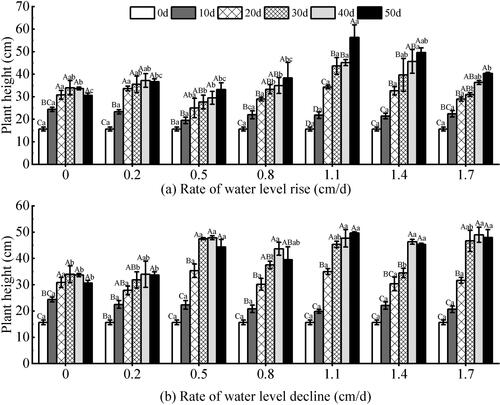
Based on the results of two-way analysis of variance, the water level changes at different rates and test time had extremely significant effects on plant height of V. natans (P < 0.01). The interaction of water level at different rates and test time had significant effect on plant height (P < 0.05) (). Under the rising water level (), the response of 0.5–1.7 cm/d groups to the test time showed an overall increasing trend (P < 0.01), and the rising groups with rates of 1.1–1.4 cm/d grew well during the test period and showed a growth trend. And the growth rate was higher than other groups, the growth of each plant was relatively uniform. At the end of the experiment, the highest value of 56.33 cm was reached in the test group of 1.1 cm/d, which was significantly higher than the other groups (P < 0.01). The 0–0.2 cm/d rising test groups showed a declining trend in plant height at the end of the test. Under the declining water level (), the plant height showed a trend of first increasing and then decreasing with the extension of the test time (P < 0.001). The plant height with high-rate groups was higher than that of low-rate(P < 0.001) under the different rates of declining water levels. At the early stage of the test, each test group of declining water level showed a good growth state, and the plant height showed a large change. However, the growth rate of each group slowed down at the later stage.
Figure 4. Effect of water level change on the plant height of V. natans. Different capital letters indicate the difference between the same change rate and different test times, and different lowercase letters indicate the difference between the same test time and different change rates.
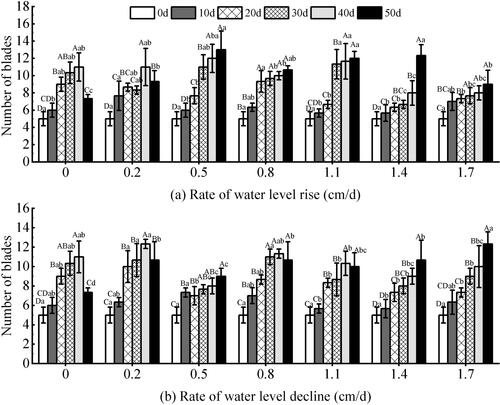
Table 1. Result of two-way analysis of variance (ANOVA) testing for main effects of water level change, time, and their interactions on V. natans (F-value).
The water level changes at different rates and test time had significant effects on the number of blades of V. natans (P < 0.01) (). Under the rising water level (), the number of blades at 0.5–1.4 cm/d rate groups was greater than that of the other groups. During the entire test period, the growth rate of blade number was not consistent. It showed that the number of blades in the 0–1.1 cm/d rate groups showed a substantial increase during the first 30 days of the experiment. At the later stage, the number of blades in the 0–0.2 cm/d groups showed a downward trend, but the other groups grew well. Under the declining water level (), the magnitude of change in each group was large throughout the experiment (P < 0.01). At the same test time, it was found that the difference between the groups at the later stage was greater than that at the early stage. At the later stage of the experiment, the number of blades decreased within the rate of 0–0.2 cm/d groups and 0.8–1.1 cm/d groups. And the decrease was greater in the 0–0.2 cm/d groups (P < 0.05) with a maximum of 33.33%. However, other rate groups continued to grow at the end of the experiment.
Figure 5. Effect of water level change on the number of blades of V. natans. Different capital letters indicate the difference between the same change rate and different test times, and different lowercase letters indicate the difference between the same test time and different change rates.
The influence of water level changes on the root activity and total biomass of V. natans
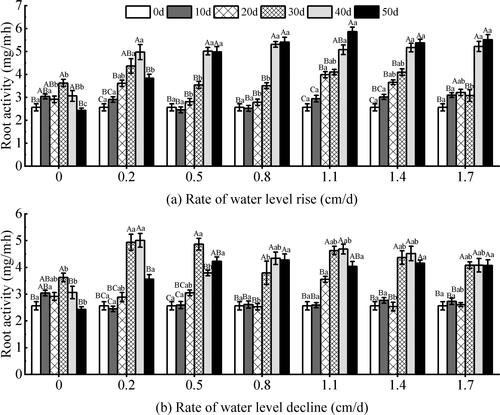
Under the rising water level (), the root activity of V. natans was significantly affected by the rate of water level change and test time (P < 0.05) (). Overall, the root activity of the 0.5–1.7 cm/d test groups showed an upward trend with the test time, and the increase was large at the later stage. On the 50th day of the experiment, the root activity of the 0.5–1.7 cm/d test groups was higher than that of the other groups, and it reached the highest value of 5.87 mg/m·h in the 1.1 cm/d rate group. The 0–0.2 cm/d rate groups showed a downward trend in the later period of the test. The differences between groups were significant during the test period (P < 0.05), and the differences between groups were small on the 10th day of the test(P > 0.05). Under the declining water level (), the root activity was significantly affected by the rate of water level changes, the test time and the interaction between them (P < 0.05) (). During the 20–40 days of the experiment, there were significant differences between the experimental groups (P < 0.05). During the entire experimental period, the differences between the different experimental groups were significant (P < 0.05). The root activity of the 0.5–1.7 cm/d test groups maintained a small change on the 30th to 50th day of the test. On the 30th day of the test, the root activity of the declining experimental group was generally greater than that of the rising groups. During the 40–50 d period, the root activity of the declining experimental groups was generally lower than that of the rising experimental groups.
Figure 6. Effect of water level change on the Root activity of V. natans. Different capital letters indicate the difference between the same change rate and different test times, and different lowercase letters indicate the difference between the same test time and different change rates.
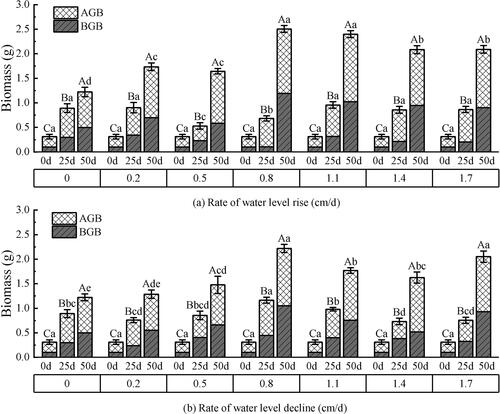
Both the AGB and BGB of V. natans showed significant responses to the rate of water level changes, the test time, and the two factors (P < 0.05) (). It showed an increasing trend with the test time, and the AGB was larger than the BGB during the entire test period. On day 50, biomass reached the maximum value in the experimental groups. Under the condition of rising water level (), the BGB of 0.8–1.7 cm/d groups increased significantly during the test period of 25–50 d. The maximum increase occurred in the 0.8 cm/d rate group with 1.09 g and a growth rate of 91.28%. Overall, the AGB biomass maintained a relatively uniform increase during the test period. Under the declining water level (), AGB and BGB maintained a small increase in the experiment groups of 0–0.5 cm/d. The total biomass started to show a decreasing trend when the rate exceeded 0.8 cm/d, and the biomass of the declining water level was less than that of the rising water level.
Figure 7. Effect of water level change on the biomass of V. natans. AGB: above-ground biomass. BGB: below-ground biomass. Different capital letters indicate the difference between the same change rate and different test times, and different lowercase letters indicate the difference between the same test time and different change rates.
The influence of water level changes on the photosynthetic pigment of V. natans
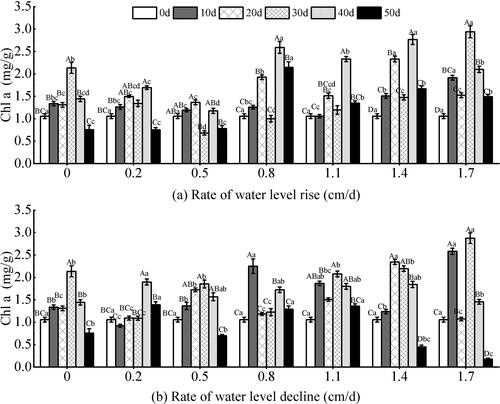
The water level changes at different rates and test time had significant effects on Chl a of V. natans (P < 0.05). The interaction of water level at different rates and test time had extremely significant effect on plant height (P < 0.01) (). Each experimental group showed a trend of first increasing and then decreasing with the test time under different water level change rates (P < 0.01). The greater the change rates of water level, the greater the variation range of the Chl a (P < 0.001). Under the rising water level (), the content of Chl a in the changing rates of 0.8–1.7 cm/d was higher than that of the other groups, indicating that the greater the water level changes, the higher the content of Chl a (P < 0.01). The content of Chl a in the 0.2–1.4 cm/d test groups showed a downward trend during the test period of 20–30 days, and the declining range was large. At 30–50 days, the content of Chl a increased significantly and then started to decrease. On the 50th day of the experiment, the content of Chl a of V. natans was higher than that of the other groups under the change rates of 0.8–1.7 cm/d, and the maximum value of the change rate of 0.8 cm/d was 2.1479 mg/g, which was significantly higher than that of the other groups. Under the declining water level (), each group decreased at the later stage of the experiment, and the decrease of Chl a in the 1.4–1.7 cm/d groups was greater than that in the other groups (P < 0.05). Under the conditions of rising and declining water levels, the 0 cm/d group and 1.7 cm/d groups began to decline after a large increase in 20–30 days.
Figure 8. Effect of water level change on chlorophyll a (Chl a) of V. natans. Different capital letters indicate the difference between the same change rate and different test times, and different lowercase letters indicate the difference between the same test time and different change rates.
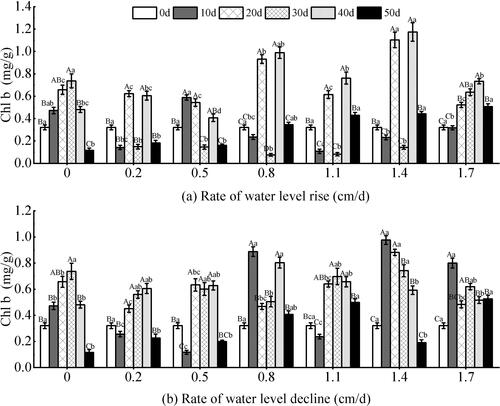
Compared with Chl a, the variation trend of Chl b was more complicated under different water level change rates, and it showed a multi-peak downward trend with the extension of the test time. The variation in each group was significant in the entire test period. At the same time, the differences among different groups were also significant (P < 0.05). Under the rising water level (), Chl b was significantly affected by the water level changes at different rates and test time (P < 0.05) ().Under the rising water level, the content of Chl b showed a decreasing trend at 0.2–1.4 cm/d on the 10th and 30th days. On the 50th day of the experiment, the content of Chl b of different rate groups decreased overall. The maximum value of Chl b content occurred at 1.4 cm/d group with 1.17 mg/g, which was significantly higher than the other groups. Under the declining water level (), the response of Chl b content to the water level changes at different rates was extremely significant (P < 0.01), and the response to the interaction of change rate and test time was significant (P < 0.05) (). The Chl b content in the 0.5–1.7 cm/d experimental groups showed a fluctuating downward trend in the early stage of the experiment. And the Chl b content reached a maximum value of 0.98 mg/g at 1.4 cm/d.
Figure 9. Effect of water level change on chlorophyll b (Chl b) of V. natans. Different capital letters indicate the difference between the same change rate and different test times, and different lowercase letters indicate the difference between the same test time and different change rates.
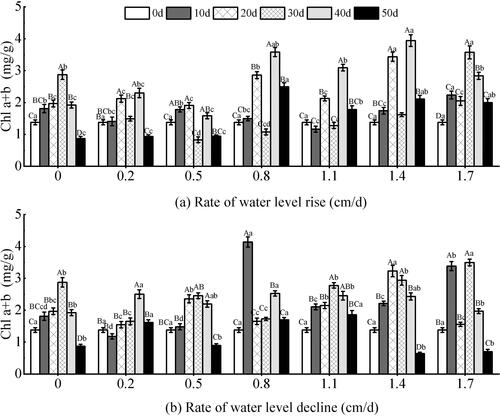
The content of Chl (a + b) showed extremely significant responses to the rate of water level changes, the test time, and the two factors (P < 0.05) (). It showed a fluctuating trend of first increase and then decrease with the test time (P < 0.01). Under the different water level change rates, the Chl (a + b) content of the high rate groups was higher than that of the low rate groups. Under the rising water level (), the range of changes within the group was large during the whole test period, and the range of changes between different groups was also large (P < 0.001). The experimental groups of 0.2–1.4 cm/d showed an overall trend of first increasing and then decreasing within 30 days of the experiment. And it rose and then fell after 30 days. The other two groups showed a significant downward trend after 30 days, which was consistent with the change of Chl a under the condition of rising water level. Under the declining water level (), the difference between groups in middle and early stage was greater than that in later stage (P < 0.05). During the entire test period, the differences between the different groups were significant (P < 0.05). The 0.8 cm/d group increased sharply from 0 to 10 days, and the maximum value of Chl (a + b) content among each group was 4.14 mg/g during the test period, and the growth rate was as high as 66.71%. In the later stage, each group experienced a comparatively large decrease. The 0.8–1.1 cm/d groups declined more slowly than the other groups in the later stage, and the content of Chl (a + b) was higher than that of the other groups at the end of the test.
Figure 10. Effect of water level change on chlorophyll (a + b) (Chl a + b) of V. natans. Different capital letters indicate the difference between the same change rate and different test times, and different lowercase letters indicate the difference between the same test time and different change rates.
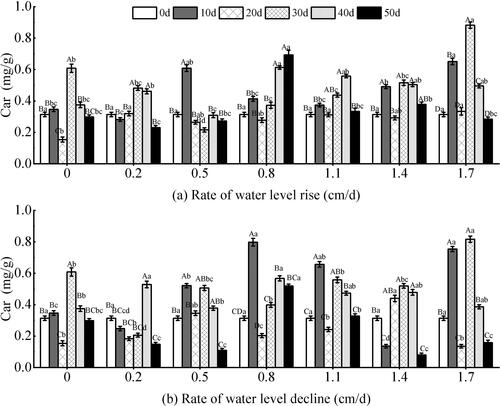
Under the rising water level (), the content of Car showed significant responses to the water level change rates, the test time, and the two factors (P < 0.05) (). It showed a fluctuating trend of first increase and then decrease with the test time. In the 20th day, the Car content in each experimental group generally decreased, which was similar to the changes of Chl a and Chl (a + b). At the end of the experiment, the Car content in the 0.8 cm/d group showed an upward trend, and the maximum value was 0.69 mg/g. Compared with the rising water level, the Car showed more complex changes at the declining water level (). The Car showed extremely significant responses to the test time (P < 0.01) (). There was an overall upward trend within 10 days of the test, with a maximum magnitude of 60.58%. At the later stage of the experiment, the overall trend was downward. And the maximum content was 0.53 mg/g in the 0.8 cm/d group.
Figure 11. Effect of water level changes on carotenoid (Car) of V. natans. Different capital letters indicate the difference between the same change rate and different test times, and different lowercase letters indicate the difference between the same test time and different change rates.
The influence of water level changes on the osmotic adjustment substance content of V. natans
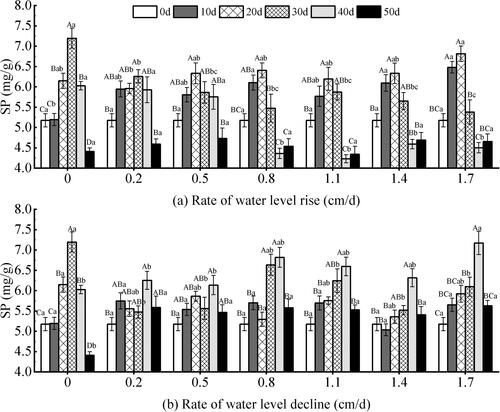
The rising and declining water levels showed a trend of first rising and then falling with the test time. Under the rising water level (), the content of SP showed extremely significant responses to the rate of water level changes, the test time, and the two factors (P < 0.01) (). On the whole, the SP content with high rate of change was higher than that with low rate from 10 to 20 days. The SP content of the 0.5–1.7 cm/d groups decreased after 20 days, and the lowest value was 4.23 mg/g at the 1.1 cm/d group. During the whole test period, there were significant differences within each test group (P < 0.05). The values between each group were close to each other after 50 days, and the difference was small (P < 0.05). Under the declining water level (), there was a significant response to the test time and water level change rate (P < 0.05) (). The differences of 0.2–1.4 cm/d groups were smaller than that of the other two groups during the entire test time. At 30 to 50 days, there were significant differences between groups with different change rates. At the rate of 0.2–1.7 cm/d groups, the content of SP increased before 40 days of the test. The SP content decreased to a relatively close level on the 50 days of the test. The SP content reached a minimum value of 4.41 mg/g under the 0 cm/d rate group.
Figure 12. Effect of water level changes on soluble protein (SP) content of V. natans. Different capital letters indicate the difference between the same change rate and different test times, and different lowercase letters indicate the difference between the same test time and different change rates.
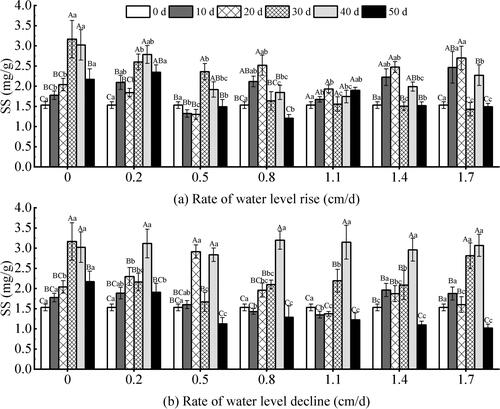
Under different water level conditions, the SS content of V. natans showed significant responses to the rate of water level changes, the test time, and the two factors (P < 0.05) (). It showed a trend of first increase and then decrease with the test time. Under the rising water level (), the SS content of high-rate was higher than that of low-rate in the 10–20 days, and the 0.8–1.7 cm/d test groups showed a decreasing trend in the SS content after 20 days of the test. This was consistent with the changing trend of SP content. But the content of SS was more complicated than that of SP. Under the declining water level (), the 0.8 cm/d group maintained a stable variation throughout the test period, and the difference was not significant (P > 0.05). In contrast, the other test groups were significantly different between test groups in the same test period (P < 0.05). Overall, the SS content showed an increasing trend at 30 to 40 days and reached a maximum. After 40 days, the content of SS decreased significantly and reached a maximum of 66.59%. On the 50th day, the SS content of the descending water level was lower than that of the ascending water level.
Figure 13. Effect of water level change on soluble sugar (SS) content of V. natans. Different capital letters indicate the difference between the same change rate and different test times, and different lowercase letters indicate the difference between the same test time and different change rates.
Correlation analysis of morphological and physiological indexes of V. natans
The correlation analysis of morphological and physiological indicators showed that SS was significantly correlated with SP, plant height, blades number, and root activity at the level of 0.01. SS was correlated with Chl a and Chl (a + b) at the level of 0.05. It was not correlated with Chl b and Car. SP was significantly correlated with plant height, the number of blades, and root activity at the level of 0.01, but it was no correlation with photosynthetic pigments. Plant height maintained a correlation with the number of blades and root activity at the level of 0.01, but it was not correlated with photosynthetic pigments. There was a correlation between the number of blades and root activity at the level of 0.01, but it was not correlated with photosynthetic pigments. Chl a was significantly correlated with Chl b, Chl (a + b), and Car at the level of 0.01. Chl b was correlated with Chl (a + b) and Car at the level of 0.01, and Chl (a + b) with Car at the level of 0.01. There was no correlation between Chl a and Chl b, Chl (a + b), Car, and root activity ().
Table 2. Correlation analysis of morphological and physiological indexes of V. natans.
Discussion
Responses of morphological characteristics to water level changes
In natural habitats, water level changes are a dynamic process that may affect submerged plants in time and space (Luo et al. Citation2016; Wang et al. Citation2016). Under different water level conditions, the faster the change rate of water level, the higher the plant height of V. natans, which indicated that the obvious change in water level would affect the plant height (L. Li et al. Citation2020). At the rising water level, plant height and the number of blades grew vigorously in the middle and late stages of the experiment. This was because aquatic macrophytes can make morphological adaptations in response to increased water depth by elongating shoots or blades (Wang et al. Citation2014). However, the 0–0.2 cm/d groups showed a downward trend in the later stage of the experiment. It may be that water levels change at a slower rate, resulting in lower water levels, and V. natans showed relevant morphological adaptations (Deegan et al. Citation2007). At the declining water level, plant height and the number of blades were consistent with the rising water level. However, the growth rate of each group slowed down or the plant height and number of blades decreased in the later stages of the experiment, and V. natans rots near the water surface. It was very likely that leaves in the shallow water treatment had access to very high photosynthetically active radiation. In that case, in shallow water, high light conditions might be a stressor for submerged macrophytes due to photo-inhibition (Li et al. Citation2017; Zhou et al. Citation2019).
Response of root activity and biomass to water level change
The plant root system is an active absorptive and synthetic organ. The growth status and activity level of the roots directly affect the nutrition status and yield level of the above-ground parts (Cao et al. Citation2019). The study found that the root activity of plants gradually decreased with the prolongation of the stress time and the aggravation of the stress degree, which led to the retardation of plant growth (Wenjing et al. Citation2018). The declining water level was low in the later stage, which resulted in the decrease of the root activity of V. natans, indicating that V. natans suffered greater stress during this period. In the middle and later stages of rising water level, the root activity increased significantly with the test time, which was significantly correlated with plant height and the number of blades. It indicated that V. natans grew vigorously during this period. Biomass accumulation in both the above- and below-ground parts of submerged plants was significantly affected by the rate of water level changes (Wang et al. Citation2016). Under the different of water level change rates, biomass showed an increasing trend with the test time, and the AGB was larger than the BGB. It indicated that stolon length and number increased significantly with the test time. The effect of water level changes on biomass was consistent with the changing trend of plant height. Biomass reached the maximum growth when the water level change rate was 0.8 cm/d, which indicated that the suitable water level was beneficial to the growth. This was because in a suitable environment it mainly relied on stolons for asexual reproduction (Mony et al. Citation2010). This also indicated that V. natans will show the best clonal growth under suitable growth water levels (Xiao et al. Citation2006). Under the rising water level, biomass began to decrease when the rising rate exceeded 0.8 cm/d. It was most likely because high water levels can induce low light intensities and low dissolved oxygen availability, thus adversely affecting the photosynthetic capacity and the nutrient uptake efficiency, consequently reducing fitness and growth (Xiao et al. Citation2007; Huber et al. Citation2014). The biomass also decreased when the declining rate exceeded 0.8 cm/d. Low water levels are accompanied by sufficient penetration of light to the substratum (Raulings et al. Citation2010) but restrict shoot growth (Milne et al. Citation2006).
Response of photosynthetic pigments to water level changes
Chlorophyll is an important physiological indicator reflecting the photosynthesis of plant leaves, and the chlorophyll content directly indicated the photosynthetic efficiency and adaptation to the change of light intensity (Leong and Anderson, Citation1984). The chlorophyll content at different rates was more complex, it showed a multi-peak decreasing trend in the later stage. It may that the plant height increased significantly in the later, the number of blades was closer to the water surface. High light intensity may inhibit the growth of V. natans and chlorophyll degradation (Chou et al. Citation2022). The photosynthetic efficiency was reduced, or the photosynthetic system was destroyed due to the light intensity received by the photosynthetic system of V. natans exceeding its utilization capacity. This can also explain the yellowing of the blades at the later stage of the experiment when the water level dropped. Photosynthetic pigments content (excluding Chl b) increased with the increase in water level change rates. Under the condition of high rate water level change, the rising water level remained high in the later stage and the falling water level remained high in the early stage. V. natans can tolerate a certain degree of low light due to their low light-compensation point. Therefore, in a low-light environment at high water levels, chlorophyll content was compensated in response to low-light environments in deep water (Li et al. Citation2021). However, Chl b is sensitive to water level with high rate of change. This was due to the selective absorption of light by Chl a and Chl b. Chl b absorbs mainly blue-violet light that is more penetrating and can reach deeper below the water surface. Therefore, Chl b was able to absorb enough light without being compensated, thus remained at a lower level.
Response of the osmotic adjustment substance content to water level changes
Plants increase tolerance by accumulating osmotic adjustment substances such as SP, SS, and play a role in stress adaptation mechanisms (Liu et al. Citation2021). Under different water level conditions, both SP and SS showed a trend of first rising and then decreasing in the 50 days. In the rising water, there was less difference in SP and SS at different rates of water level changes, which indicated that V. natans had adaptability to the rising water level (such as increasing plant height in response to rising water levels). In the declining water level, the 0.2–1.7 cm/d experimental groups maintained an upward trend in the content of SP and SS before 40 days, to cope with the water level drop stress (Jia et al. Citation2015). The decreasing trend at 50 days was because the stress time was longer than the tolerance range of V. natans itself, resulting in damage to plant cells. The SP and SS in the control group (0 cm/d) showed an earlier decline trend than the other groups after 30 days. It may be that the inhibition of protein synthesis and SS accumulation by strong light when the plants were under low water level (Shan-shan et al. Citation2019).
Conclusion
In this experiment, we studied the response of V. natans growth and physiology to water level changes and found the following: (1) the plant height, the number of blades, root activity, and biomass increased with the increase of the test time. (2) however, the contents of photosynthetic pigments and osmotic regulators were inhibited in the later stage of the test, and it showed a trend of first increasing and then decreasing with the increase of the test time. The plant growth was best at 0.8–1.4 cm/d, and the too high or too low water level would produce certain stress to V. natans. Therefore, it is suitable to grow in waters with moderate changes in water level. This result has reference significance for the restoration and reconstruction of the lake ecological environment.
Disclosure statement
No potential conflict of interest was reported by the authors.
Additional information
Funding
Notes on contributors
Kai-jing Xin
Kai-jing Xin is a graduate student at Jiangxi Normal University. Her research interest is in submerged vegetation restoration.
Yun Cao
Yun Cao received his PhD from Nanjing Normal University in 2007. His research interests are in plant ecology and ecological restoration in wetlands. He is currently working on a research project about the ecological amplitude of beach-typical vegetation in Poyang Lake under a water level gradient.
Qin-zhao Xie
Qin-zhao Xie is a graduate student at Jiangxi Normal University. Her research interest is in submerged vegetation restoration.
Rong-hua Liang
Rong-hua Liang is a graduate student at Jiangxi Normal University. His research interest is in submerged vegetation restoration.
Hui-xiong Huang
Hui-xiong Huang is a graduate student at Jiangxi Normal University. His research interest is in submerged vegetation restoration.
Yi-ting Chen
Yi-ting Chen is a graduate student at Jiangxi Normal University. Her research interest is in submerged vegetation restoration.
Jia-jun Qi
Jia-jun Qi is a graduate student at Jiangxi Normal University. His research interest is in submerged vegetation restoration.
References
- Allen CD, Macalady AK, Chenchouni H, Bachelet D, McDowell N, Vennetier M, Kitzberger T, Rigling A, Breshears DD, Hogg E, et al. 2010. A global overview of drought and heat-induced tree mortality reveals emerging climate change risks for forests. For Ecol Manage. 259(4):660–684.
- Arnell NW, Gosling SN. 2016. The impacts of climate change on river flood risk at the global scale. Clim Change. 134(3):387–401.
- Belote RT, Jones RH, Wieboldt TF. 2012. Compositional stability and diversity of vascular plant communities following logging disturbance in Appalachian forests. Ecol Appl. 22(2):502–516.
- Cao Y, Chen D, Ji X-S, Zhang S-J, Huang Q, Wang W-L. 2019. Effects of water depth gradient on physiological characteristics of Vallisneria natans. J Freshwater Ecol. 34(1):405–417.
- Cao Y, Wu H-y, Zhang S-J, Guo Z-C, Wang G-x 2016. Effects of water depth on the seedling morphology and chlorophyll fluorescence of Vallisneria natans. J Freshwater Ecol. 31(3):463–475.
- Chou Q, Zhang W, Chen J, Ren W, Yuan C, Wen Z, Zhang X, Cao T, Ni L, Jeppesen E, et al. 2022. Phenotypic responses of a submerged macrophyte (Vallisneria natans) to low light combined with water depth. Aquat Bot. 176:103462.
- Coops H, Beklioglu M, Crisman TL. 2003. The role of water-level fluctuations in shallow lake ecosystems – workshop conclusions. Hydrobiologia. 506–509(1–3):23–27.
- De Backer S, Teissier S, Triest L. 2012. Stabilizing the clear-water state in eutrophic ponds after biomanipulation: submerged vegetation versus fish recolonization. Hydrobiologia. 689(1):161–176.
- Deegan BM, White SD, Ganf GG. 2007. The influence of water level fluctuations on the growth of four emergent macrophyte species. Aquat Bot. 86(4):309–315.
- Huber H, Visser EJ, Clements G, Peters JL. 2014. Flooding and fragment size interact to determine survival and regrowth after fragmentation in two stoloniferous Trifolium species. AoB PLANTS 6: plu024.
- Jeppesen E, Brucet S, Naselli-Flores L, Papastergiadou E, Stefanidis K, Nõges T, Nõges P, Attayde JL, Zohary T, Coppens J, et al. 2015. Ecological impacts of global warming and water abstraction on lakes and reservoirs due to changes in water level and related changes in salinity. Hydrobiologia. 750(1):201–227.
- Jia X, Sun C, Li G, Li G, Chen G. 2015. Effects of progressive drought stress on the physiology, antioxidative enzymes and secondary metabolites of Radix Astragali. Acta Physiol Plant. 37:262.
- Ke X, Li W. 2006. Germination requirement of Vallisneria natans seeds: implications for restoration in Chinese lakes. Hydrobiologia. 559(1):357–362.
- Leira M, Cantonati M. 2008. Effects of water-level fluctuations on lakes: an annotated bibliography. Hydrobiologia. 613(1):171–184.
- Lenssen JPM, De Kroon H. 2005. Abiotic constraints at the upper boundaries of two Rumex species on a freshwater flooding gradient. J Ecol. 93(1):138–147.
- Leong TY, Anderson JM. 1984. Adaptation of the thylakoid membranes of pea chloroplasts to light intensities. I. Study on the distribution of chlorophyll-protein complexes. Photosynth Res. 5(2):105–115.
- Li HM, Li Q, Luo X, Fu J, Zhang JB. 2020. Responses of the submerged macrophyte Vallisneria natans to a water depth gradient. Sci Total Environ. 701:134944.
- Li L, Bonser SP, Lan Z, Xu L, Chen J, Song Z. 2017. Water depth affects reproductive allocation and reproductive allometry in the submerged macrophyte Vallisneria natans. Sci Rep. 7(1):16842.
- Li L, Ding M, Jeppesen E. 2020. Variation in growth, reproduction, and resource allocation in an aquatic plant, Vallisneria spinulosa: the influence of amplitude and frequency of water level fluctuations. Aquat Sci. 82:81.
- Li Q, Han Y, Chen K, Huang X, Li K, He H. 2021. Effects of water depth on the growth of the submerged macrophytes vallisneria natans and hydrilla verticillata: implications for water level management. Water. 13(18):2590.
- Li Q, Xie Y. 2013. Influence of low light on the growth and development of Vallisneria natans seedlings. AMM. 295–298:62–68.
- Liu B, Jing D, Liu F, Ma H, Liu X, Peng L. 2021. Serendipita indica alleviates drought stress responses in walnut (Juglans regia L.) seedlings by stimulating osmotic adjustment and antioxidant defense system. Appl Microbiol Biotechnol. 105(23):8951–8968.
- Luo F-L, Jiang X-X, Li H-L, Yu F-H. 2016. Does hydrological fluctuation alter impacts of species richness on biomass in wetland plant communities? JPECOL. 9(4):434–441.
- Milne JM, Murphy KJ, Thomaz SM. 2006. Morphological variation in Eichhornia azurea (Kunth) and Eichhornia crassipes (Mart.) Solms in relation to aquatic vegetation type and the environment in the floodplain of the Rio Paraná, Brazil. Hydrobiologia. 570(1):19–25.
- Mjelde M, Hellsten S, Ecke F. 2013. A water level drawdown index for aquatic macrophytes in Nordic lakes. Hydrobiologia. 704(1):141–151.
- Mony C, Mercier E, Bonis A, Bouzillé JB. 2010. Reproductive strategies may explain plant tolerance to inundation: a mesocosm experiment using six marsh species. Aquat Bot. 92(2):99–104.
- Peintinger M, Prati D, Winkler E. 2007. Water level fluctuations and dynamics of amphibious plants at Lake Constance: long-term study and simulation. Perspect Plant Ecol Evol Syst. 8(4):179–196.
- Raulings EJ, Morris KAY, Roache MC, Boon PI. 2010. The importance of water regimes operating at small spatial scales for the diversity and structure of wetland vegetation. Freshw Biol. 55(3):701–715.
- Shan-shan L, Yun C, Xin-sheng J, Ling-ming X, Jia-yi W, Wen-lin W. 2019. Effects of water depth on chlorophyll content and antioxidant enzyme activity of Hydrilla verticillata. Chin J Ecol. 38(1):221–228.
- Voesenek LA, Colmer TD, Pierik R, Millenaar FF, Peeters AJ. 2006. How plants cope with complete submergence. New Phytol. 170(2):213–226.
- Wang C, Zhang SH, Wang PF, Hou J, Li W, Zhang WJ. 2008. Metabolic adaptations to ammonia-induced oxidative stress in leaves of the submerged macrophyte Vallisneria natans (Lour.) Hara. Aquat Toxicol. 87(2):88–98.
- Wang P, Zhang Q, Xu Y-S, Yu F-H. 2016. Effects of water level fluctuation on the growth of submerged macrophyte communities. Flora. 223:83–89.
- Wang Q, Chen J, Liu F, Li W. 2014. Morphological changes and resource allocation of Zizania latifolia (Griseb.) Stapf in response to different submergence depth and duration. Flora - Morphol Distrib Funct Ecol Plants. 209(5–6):279–284.
- Wang X. 2015. Principles and techniques of plant physiological and biochemical experiments. Beijing: Higher Education Press.
- Wenjing Q, Yanan Q, Lingyan W, Zhanhui T. 2018. Responses of morphology, physiology and reproduction of iris laevigata to change of water level. Wetl Sci. 16(01):79–84.
- Xiao K, Yu D, Wu Z. 2007. Differential effects of water depth and sediment type on clonal growth of the submersed macrophyte Vallisneria natans. Hydrobiologia. 589(1):265–272.
- Xiao K, Yu D, Wang J. 2006. Habitat selection in spatially heterogeneous environments: a test of foraging behaviour in the clonal submerged macrophyte Vallisneria spiralis. Freshwater Biol. 51(8):1552–1559.
- Xing W, Wu HP, Hao BB, Huang WM, Liu GH. 2013. Bioaccumulation of heavy metals by submerged macrophytes: looking for hyperaccumulators in eutrophic lakes. Environ Sci Technol. 47(9):4695–4703.
- Zeng L, He F, Dai Z, Xu D, Liu B, Zhou Q, Wu Z. 2017. Effect of submerged macrophyte restoration on improving aquatic ecosystem in a subtropical, shallow lake. Ecol Eng. 106:578–587.
- Zhao F, Fang X, Zhao Z, Chai X. 2021. Effects of water level fluctuations on the growth characteristics and community succession of submerged macrophytes: a case study of Yilong Lake, China. Water. 13(20):2900.
- Zhou Y, Li L, Song Z. 2019. Plasticity in sexual dimorphism enhances adaptation of dioecious Vallisneria natans plants to water depth change. Front Plant Sci. 10:826.