
Abstract
River ecosystems receive a large amount of organic matter, which will increase the production of greenhouse gases (GHGs), including carbon dioxide (CO2), methane (CH4) and nitrous oxide (N2O). Despite extensive research on the distribution of greenhouse gases and dissolved organic matter (DOM), little is known about the associations between greenhouse gases and DOM compositions. In this study, the distributions of GHGs (CO2, CH4 and N2O) and DOM in the overlying water of the main rivers around Taihu Lake were investigated. The results showed that the concentration of GHGs was positively correlated with dissolved organic carbon concentrations. Three-dimensional excitation-emission matrix fluorescence spectroscopy techniques were employed to identify the source of the DOM, which was related to protein-like and humic-like components. The DOM was a combination of terrigenous and endogenous origins. The GHGs (except CO2) were significantly associated with DOM composition. These results emphasize the importance of the relationship between GHGs (CO2, CH4 and N2O) and DOM compositions in river ecosystems.
1. Introduction
The concentrations of carbon dioxide (CO2) and methane (CH4), which are the two major greenhouse gases (GHGs) in the atmosphere, have continued to rise (Stocker et al. Citation2014), leading to conditions that are a serious threat to human survival and sustainable social and economic development. The greenhouse effect has become one of the most concerning environmental problems worldwide. As two important GHGs in the atmosphere, methane (CH4) and carbon dioxide (CO2) contribute 18% and 64% to the greenhouse effect, respectively. CH4 and CO2 in the atmosphere originate from a wide range of sources, and freshwater (rivers, streams, lakes and reservoirs) is an important source of CH4 and CO2 in the atmosphere.
River ecosystems are an important link connecting the two carbon pools of the land and the ocean. The carbon input from rivers worldwide into the ocean is about 0.9 PG/A (Cole et al. Citation2007), which is an important structural unit of the global carbon cycle that plays a major role in the material cycle of the biosphere, particularly the carbon cycle (Cole et al. Citation2001). However, studies in the past 30 years have shown that rivers are not only the transport channels for the global carbon cycle, but also play an important role in the transport of terrestrial organic carbon, which participates in the biogeochemical cycle, and directly emits carbon dioxide (CO2) (Richey Citation2002; Butman and Raymond Citation2011; Raymond et al. Citation2013) and methane (CH4) (Marie and Marvin Citation1987; Bastviken et al. Citation2011; Belger et al. Citation2011) to the atmosphere through the water gas boundary. Therefore, research on the CO2 and CH4 emissions (carbon emissions) of river systems has become a hot topic in ecological research. Now, research on GHGs is focusing on reservoirs (Jiang et al. Citation2017, Yang et al. Citation2021), lakes (Yan et al. Citation2018, Deng et al. Citation2019), soils (Li et al. Citation2014) and wetlands (Tian Citation2018). Huttunen et al. (Citation2003) studied CH4 emissions from lakes in Finland and reported that the nutritional status of lakes, the oxygen content of the water during winter, and ice cover have an important effect on CH4 emissions during the following spring. CH4 produced during ice cover in the winter is released into the atmosphere when the ice melts (3.6–7.9 g CH4/m2). In addition, the emission pathways (Bastviken et al. Citation2004) and factors affecting (Gudasz et al. Citation2010; Walter Anthony et al. Citation2010; Marotta et al. Citation2014) GHGs are beginning to be understood. Borges et al. (Citation2018) found agricultural land has an impact on the concentration of GHGs (CO2, CH4, and N2O) in river ecosystems.
Organic matter is the basic raw material of in situ respiration and microbial metabolism in rivers and is also the main carbon source of endogenous CH4 and CO2 in rivers. The decomposition of organic matter by microorganisms is an important source of river CO2. In addition, there is also a lot of CO2 that is transported laterally from soils and from wetlands (Abril et al. Citation2014). CH4 emissions are more closely related to the organic matter in sediments (Baulch et al. Citation2011; Crawford et al. Citation2014). Based on an analysis of the global river CH4 data, a positive correlation has been reported between CH4 concentrations and dissolved organic carbon (DOC) (Stanley et al. Citation2016). Organic carbon not only promotes the production of in situ CH4 as a source of CH4 production but also consumes O2 quickly and reduces CH4 oxidation in bodies of water with high organic matter (Smith et al. Citation2000; Mayorga et al. Citation2005). Exogenous input of organic matter significantly stimulates CH4 production in rivers (Jones et al. Citation1995). The bioavailability of organic matter and the composition of humus (humin, humic acid and fulvic acid) in rivers may affect the mechanism of river CH4 production (Garnier et al. Citation2013). Smemo and Yavitt (Citation2011) reported that some humus stimulates CH4 production as an electron receptor for CH4 production. However, Minderlein and Blodau (Citation2010) showed that some humic acids have an inhibitory effect on methanogens, which is not conducive to the production of CH4 in sediments rich in organic matter. In addition, different aspects of human activities (e.g., population associated with urban areas and croplands) have specific impact on organic matter in aquatic ecosystems. CO2 and CH4 increased and O2 decreased in streams with increasing fraction of agricultural land cover on the catchment, strongly suggesting enhanced OM degradation in these streams (Lambert et al. Citation2017).
Chromophoric dissolved organic matter (CDOM) and the distribution of GHGs have attracted extensive attention in recent years. However, associations between them remain largely unknown. The present study determined the distributions of GHGs (CO2, CH4 and N2O) and dissolved organic matter in the overlying water of the main rivers around Taihu Lake, (1) to reveal the distribution of GHGs and water quality parameters; (2) to identify the source of the DOM in the rivers, and (3) to verify the correlations between the GHGs and dissolved organic matter composition.
2. Materials and methods
2.1. Sampling sites
Sampling was conducted in the main rivers around Taihu Lake in December 2021. The details of the sampling sites are given in and .
Figure 1. Distribution of sampling sites in the main rivers around Taihu Lake.
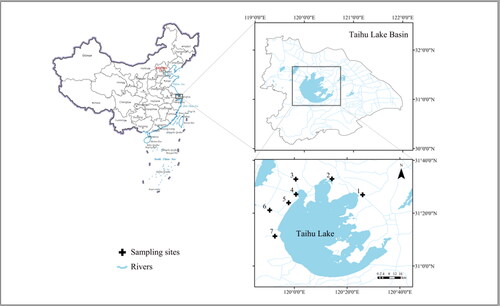
Table 1. Analytical performance parameters for the determination of GHGs.
2.2. Sample collection
Water samples of 10 cm beneath the air–water interface were collected. A 300 mL aliquot of the water sample was taken in duplicate in 500 mL sealed glass bottles for the determination of CH4 and N2O. They were stored with saturated mercuric chloride to inhibit microbial activity, and used Apiezon® grease to prevent gas exchange. These samples were stored under cool condition and transported immediately to the laboratory for quantification.
2.3. Physical and chemical analytical methods
Water temperature, pH, dissolved oxygen (DO), oxidation-reduction potential (ORP), and electric conductivity (EC) were measured using a water quality testing instrument (YSI 6600, USA). Samples of total nitrogen (TN) analyses were determined by a UV-6100 spectrophotometer (Mapada, Shanghai, China) (Raveh and Avnimelech Citation1979). Total phosphorus (TP) was analyzed by colorimetry following digestion with K2S2O8 and NaOH (Ebina et al. Citation1983). Ammonium-nitrogen (NH4+-N) and nitrate-nitrogen (NO3−-N) were measured with AutoAnalyzer 3 (SEAL, Rottenbach, Germany). Dissolved inorganic carbon (DOC) and dissolved inorganic carbon (DIC) were analysed using a HT 1300 N/C analyser (Analytik Jena, Germany).
2.4. Analysis of gas concentration
The dissolved gas concentrations in the samples were measured using the headspace equilibration method (Xiao et al. Citation2017; Xiao et al. Citation2019). By injecting ultra-high purity N2 gas (99.999%), a 50 mL aliquot of water was pushed out to form a headspace. Then, shake the glass bottle vigorously for about 10 min to balance the dissolved gases between the residual liquid and the headspace. To determine the values of dissolved gases in the samples, a small gas sample was withdrawn from the equilibrated headspace of the glass bottle through the syringe with three-way valve. The gas samples were measured by a gas chromatograph (Agilent GC7890B, Agilent Technologies Inc., Palo Alto, CA, USA) fitted with a flame ionization detector to detect CO2, N2O and CH4. Validation parameters have been presented in .
2.5. Statistical analysis
The Statistical Package of the Social Sciences 24.0 software (SPSS 24.0: SPSS Inc., Chicago, IL, USA) was used for the statistical analysis. One-way analysis of variance (ANOVA) and correlation analyses were conducted using bivariate correlation analysis. Relationships between the production of GHGs and the physicochemical parameters were identified by Pearson’s correlation analysis. A P-value < 0.05 was considered significant.
3. Results and discussion
3.1. Physicochemical parameters of water samples
As shown in , the pH values in the different bodies of fresh water were weakly alkaline (range 7.67–8.32). The pH at site 2 was significantly higher than that at site 6 (P < 0.01). Total dissolved solids (TDS) are the total amount of inorganic minerals dissolved in the water. The TDS concentrations in the samples were 92.73–456.95 mg/L (mean 302.37 mg/L). Water EC indicates the number of ions in the water. The EC values ranged from 88.30 to 407.90 μs/cm (mean 288.85 μs/cm). The DO concentration affects the survival of aquatic organisms and determines the self-purification ability of water. The average DO concertation at the different sites was 13.44 mg/L. The DO concentration at site 3 was significantly higher than that at site 2 (P < 0.05). The mean oxidation-reduction potential (ORP) value in the overlying water was 239.97 mV.
Table 2. Physical and chemical parameters of sampling sites.
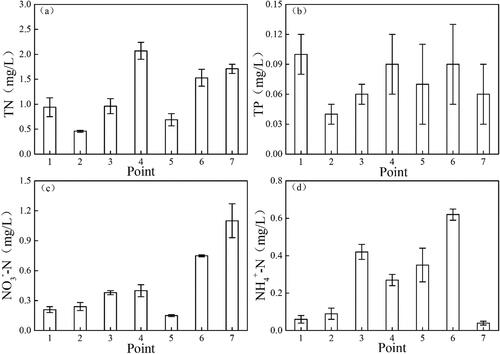
3.2. Contents of nutrients in the water samples
As shown in , the TN level varied between 0.46 and 2.07 mg/L (mean 1.19 mg/L). The TN in the sample from point 4 was the highest with an average of 2.07 mg/L. Nitrogen levels varied from 0.15 to 1.10 mg/L for NO3−-N, 0.04 to 0.62 mg/L for NH4+-N, with mean values of 0.46 and 0.26 mg/L, respectively. The NH4+-N level in the sample from point 6 was significantly higher than those in the other samples (P < 0.01). The highest TP level occurred at site 1 (0.10 mg/L), while the lowest value was 0.04 mg/L, which occurred at site 2, with an average of 0.07 mg/L.
Figure 2. Concentrations of TN (a), TP (b), NO3−-N (c) and NH4+-N (d) in the overlying water.
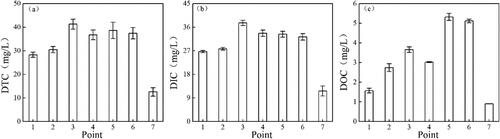
3.3. Dissolved organic matter distribution
As shown in , DTC concentrations varied from 12.57 to 41.31 mg/L (mean 32.21 mg/L). The average DTC level at site 3 was significantly higher than those (except site 5) in the other samples (P < 0.01). A similar variation was observed at point 3, where the highest DIC concentration occurred, with a mean of 37.65 mg/L. DOC in the samples varied from 0.90 to 5.32 mg/L, and the maximum value occurred at site 5.
Figure 3. Concentrations of DTC (a), DIC (b) and DOC (c) in the overlying water.
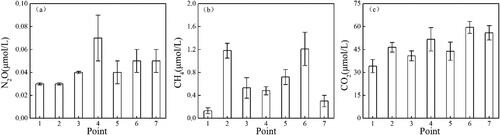
3.4. Distribution of GHGs (CO2, CH4 and N2O)
The N2O content in the samples ranged from 0.03 to 0.07 µmol/L (mean 0.04 µmol/L). The highest CH4 level occurred at site 6 (mean 1.21 µmol/L), while the lowest of 0.13 µmol/L occurred at site 1. Significant differences in CH4 were observed among the samples (P < 0.01) except between sites 1 and 7. The CO2 concentrations at the sampling sites ranged from 34.12 to 59.48 µmol/L (mean 47.48 µmol/L). Similar to the CH4 distribution (), the highest CO2 occurred at point 6, and the lowest occurred at point 1.
Figure 4. Concentrations of the greenhouse gases N2O (a), CH4 (b) and CO2 (c) in the overlying water.
3.5. The relationships between the physicochemical parameters and gas production
This study analyzed the correlations between the GHGs and the physicochemical parameters. As shown in , the concentration of N2O was positively related to the NH4+-N concentration (P < 0.01). A positive correlation was detected between CO2 production and the NH4+-N concentration (P < 0.05). The DOC value was positively correlated with N2O and CO2 (P < 0.05). In addition, close correlations were observed among the greenhouse gases in this investigation (). The CO2 concentration was closely correlated with N2O and CH4.
Table 3. Pearson’s correlation between the water quality indices and gas production.
4. Discussion
4.1. CDOM characteristics in the Rivers
The three-dimensional excitation-emission matrix fluorescence (3D EEM) technique was useful to distinguish the origin of the DOM in the samples. The peaks in the fluorescent EEMs of the DOM in the samples had many common characteristics with previously identified peaks (). To be specific, four main peaks were identified from the fluorescent EEMs (). Component 1 (C1) was observed at the excitation/emission wavelengths (Ex/Em) of 295/344 nm, which have been reported as tryptophan-like substances (designated peak T2). This component is associated with the newly generated DOM (Coble et al. Citation2014). Component 2 (C2) has been reported as a protein-like substances, which was observed at the Ex/Em of 285/318 nm (peak B) (). Component 3 (C3) has been identified in a variety of aquatic environments, which is related to microbial humic-like substances (peak M) (Coble et al. Citation2014) and is considered to represent both autochthonous and allochthonous DOM. Finally, component 4 was located at Ex/Em of 365 (305)/456 nm (designated peak C), which in previous studies was identified to be fluorescence of visible fulvic-like substances (Zhang et al. Citation2009). Peak C reflects the fluorescence peak formed by exogenous input of humic acid and fulvic acid, mainly from river input and soil leaching, and reflects the characteristics of the land source (Song et al. Citation2010). Protein-like peaks are components that reflect the fluorescence peaks formed by biodegradable sources, which are generated by the action of microorganisms and phytoplankton (Coble Citation1996).
Figure 5. Typical EEMs of DOM in the samples.
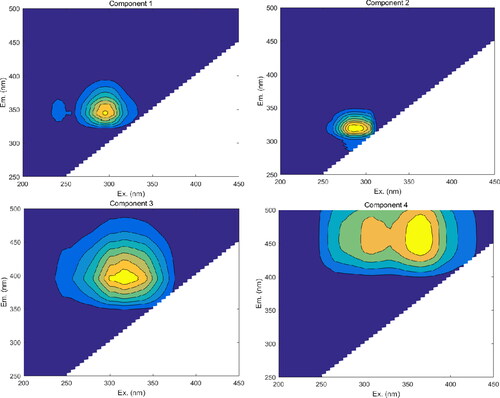
Table 4. Major fluorescence peaks and their spectral positions of dissolved organic matter in previous studies (Coble et al. Citation1998; Coble et al. Citation2014; Xi et al. Citation2018).
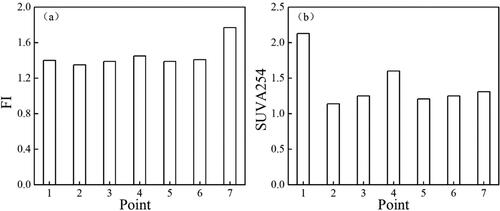
3D EEM fluorescence spectroscopy is an effective method to identify the source of organic matter in water and soil. The fluorescence index (FI) is the ratio of emission intensity wavelength at 470 nm to the emission intensity at 520 nm, following an Ex of 370 nm, and has been used as a parameter to distinguish CDOM sources (Jiang et al. Citation2017). The FI value of organic matter from the autogenous source is low (around 1.3), while the FI value of terrestrial organic matter is high (around 1.9) (McKnight et al. Citation2001). The FI in the samples ranged from 1.35 to 1.77 (mean 1.45), indicating a combination of terrigenous and endogenous sources. The SUVA254 index is used to describe the degree of humification, indicating the composition of aromatic substances in the DOM. The SUVA254 values ranged from 1.14 to 2.13 (), and the highest value occurred at site 1, indicating high humification. Edzwald and Tobiason (Citation1999) reported that small molecular proteins are the main DOM fraction present in freshwater with a SUVA254 value < 2, which was consistent with the DOM characterization results.
Figure 6. Comparison of UV and fluorescence characteristics of DOM.
4.2. Associations between DOM composition and greenhouse gases
In the present study, the DOC concentration was positively correlated with the production of N2O and CO2 (), indicating that the change was related to organic matter mineralization. Many studies have shown that the organic matter is crucial to the distribution of GHGs (Sierra et al. Citation2020).
The CO2 emissions occurring at the water–air interface are the most important in rivers. About 77% of the carbon transported from the land into rivers is in the form of CO2, and > 90% of it enters the atmosphere through the water–air interface (Johnson Citation2008). Terrigenous POC, DOC and DIC flow into rivers in runoff, most of which are directly discharged in the form of CO2, while organic carbon and a small amount of CO2 flow into downstream rivers. Therefore, some studies have shown that CO2 in the water of river headwaters is mainly derived from terrigenous soil respiration, while CO2 downstream is mainly derived from internal organic carbon decomposition (Johnson Citation2008; Mulholland et al. Citation2001). Endogenous CO2 is mainly produced by microbial decomposition of organic carbon in freshwater and sediments.
CH4 is the final product in the mineralization of anaerobic organic matter (Duc et al. Citation2010). The production of CH4 requires the use of three types of microorganisms (hydrolytic bacteria, hydrogen-acetic acid-producing bacteria, and methane-producing bacteria) (Lay et al. Citation1996). In the present study, the CH4 levels at sites 2 and 6 were higher than those at the other sites. Sampling site 2 was located in a cyanobacterial accumulating area, and sampling site 6 was near the town. Cyanobacterial blooms release lots of organic matter into freshwaters, which is mineralized by microorganisms. In addition, cyanobacterial residues in the sediments are decomposed by microbiota, releasing CO2 and CH4. Previous studies have suggested that sediments are important sites for CH4 production. However, Hu et al. (Citation2017) reported that CH4 originates from the sediments but is also transformed by organic matter released during the decomposition of the cyanobacteria in water. In the present study, visible fulvic-like FDOM may have had an effect on the CH4 production of samples (). The production of CH4 is facilitated by the accumulation of chromophoric terrestrial material, as observed in lakes (Zhou et al. Citation2018). In a eutrophic lake, terrestrial CDOM input increases the concentration of CH4 rather than protein material. Moreover, the high content of terrigenous organic matter contributes to the increase of methane production (Araujo et al. Citation2018). This could explain the positive relationship between CH4 and C4 compounds.
Table 5. Relationships between gas production and DOM composition.
N2O is produced during the denitrification process (Seitzinger Citation1988), which is affected by the concentration of NO3−-N. Denitrifiers utilize N2O as an electron acceptor under hypoxic and low nitrate conditions (Usui et al. Citation2001). Studies have shown that N2O is consumed when the NO3−-N concentration in water is < 0.5 mg/L (Johansson et al. Citation2003). In the present study, N2O production was significantly related to the NH4+-N concentration (P < 0.01) (), which was also reported by Yan et al. (Citation2018). Amaral et al. (Citation2021) showed that tryptophan-like matter enhances the production of N2O rather than the humic-like fraction from microbial or terrestrial sources. However, no significant correlation was found between N2O and C1 (). This may be related to the sampling site. The sources of organic matter in the investigation are complex and there are many influencing factors.
It is necessary to further explore the relationship between GHGs (CO2, CH4 and N2O) and the composition of DOM, and establish the relationship between the impact of carbon emissions on climate change.
5. Conclusions
This study comprehensively investigated the concentrations and characteristics of GHGs, DOM, and water parameters in the main rivers around Taihu Lake. The GHGs were significantly associated with DOM composition. Protein-like and humic-like components were identified from the DOM using the EEM-PARAFAC method. River ecosystems are subjected to increasing environmental perturbations, which affect organic matter composition and hence affect GHG concentrations. It is important to account for the composition of DOM when studying the distribution of GHGs in a river ecosystem.
Author contributions
Data curation, Fei He; Formal analysis, Jie Ma; Investigation, Jie Ma, Qiuying Lai and Dongyan Pei; Writing – original draft, Fei He; Writing – review & editing, Weixin Li.
| Abbreviations | ||
| TDS | = | total dissolved solid |
| EC | = | electric conductivity |
| DO | = | dissolved oxygen |
| ORP | = | oxidation-reduction potential |
| TN | = | total nitrogen |
| TP | = | total phosphorus |
| NH4+-N | = | ammonium |
| NO3--N | = | nitrate |
| DTC | = | dissolved total carbon |
| DOC | = | dissolved organic carbon |
| DIC | = | dissolved inorganic carbon |
| CDOM | = | chromophoric dissolved organic matter |
Acknowledgments
This work was supported by Ecological environment scientific research project of Jiangsu Province (No. JSZC-G2021-291), Major Science and Technology Program for Water Pollution Control and Treatment (No. 2017ZX07301006), The Special basic research service for the Central Level Public Welfare Research Institute (No. GYZX210517), The Special Fund of Chinese Central Government for Basic Scientific Research Operations in commonweal Research Institute (No. GYZX220405).
Disclosure Statement
All authors claim that they do not have any actual or potential conflict of interest including any financial, personal or other relationships with other people or organizations.
Additional information
Funding
References
- Abril G, Martinez J-M, Artigas LF, Moreira-Turcq P, Benedetti MF, Vidal L, Meziane T, Kim J-H, Bernardes MC, Savoye N, et al. 2014. Amazon River carbon dioxide outgassing fuelled by wetlands. Nature. 505(7483):395–398.
- Amaral V, Ortega T, Romera-Castillo C, Forja J. 2021. Linkages between greenhouse gases (CO2, CH4, and N2O) and dissolved organic matter composition in a shallow estuary. Sci Total Environ. 788(147863):147863.
- Araujo J, Pratihary A, Naik R, Naik H, Naqvi SWA. 2018. Benthic fluxes of methane along the salinity gradient of a tropical monsoonal estuary: Implications for CH4 supersaturation and emission. Mar Chem. 202:73–85.
- Bastviken D, Cole J, Pace M, Tranvik L. 2004. Methane emissions from lakes: Dependence of lake characteristics, two regional assessments, and a global estimate. Global Biogeochem Cy. 18(4):1–12.
- Bastviken D, Tranvik LJ, Downing JA, Crill PM, Enrich-Prast A. 2011. Freshwater methane emissions offset the continental carbon sink. Science. 331(6013):50.
- Baulch HM, Dillon PJ, Maranger R, Schiff SL. 2011. Diffusive and ebullitive transport of methane and nitrous oxide from streams: Are bubble-mediated fluxes important? J Geophys Res. 116(G04028):1-15.
- Belger L, Forsberg BR, Melack JM. 2011. Carbon dioxide and methane emissions from interfluvial wetlands in the upper Negro River basin, Brazil. Biogeochemistry. 105(1-3):171–183.
- Borges AV, Darchambeau F, Lambert T, Bouillon S, Morana C, Brouyère S, Hakoun V, Jurado A, Tseng H-C, Descy J-P, et al. 2018. Effects of agricultural land use on fluvial carbon dioxide, methane and nitrous oxide concentrations in a large European river, the Meuse (Belgium). Sci Total Environ. 610-611:342–355.
- Butman D, Raymond PA. 2011. Significant efflux of carbon dioxide from streams and rivers in the United States. Nat Geosci. 4(12):839–842.
- Coble PG. 1996. Characterization of marine and terrestrial DOM in seawater using excitation-emission matrix spectroscopy. Mar Chem. 51(4):325–346.
- Coble PG, Castillo C, Avril B. 1998. Distribution and optical properties of CDOM in the Arabian Sea during the 1995 Southwest Monsoon. Deep-Sea Res Pt II. 45(10-11):2195–2223.
- Coble PG, Lead J, Baker A, Reynolds DM, Spencer GGM. 2014. Aquatic Organic Matter Fluorescence: Environmental Effects. Cambridge University Press. ISBN 978-0-521-76461-2.
- Cole JJ, Cole JJ, Caraco NF, Caraco NF. 2001. Carbon in catchments: Connecting terrestrial carbon losses with aquatic metabolism. Mar Freshwater Res. 52(1):101–110.
- Cole JJ, Prairie YT, Caraco NF, Mcdowell WH, Tranvik LJ, Striegl RG, Duarte CM, Kortelainen P, Downing JA, Middelburg JJ, et al. 2007. Plumbing the global carbon cycle: integrating inland waters into the terrestrial carbon budget. Ecosystems. 10(1):172–184.
- Crawford JT, Stanley EH, Spawn SA, Finlay JC, Loken LC, Striegl RG. 2014. Ebullitive methane emissions from oxygenated wetland streams. Glob Chang Biol. 20(11):3408–3422.
- Deng HG, Zhang ZB, Liu T, Yin SH, Dong J, Zhang J, Yao X. 2019. Dissolved greenhouse gas concentrations and the influencing factors in different vegetation zones of an urban lake. J Lake Sci. 31(4):1055–1063.
- Duc NT, Crill P, Bastviken D. 2010. Implications of temperature and sediment characteristics on methane formation and oxidation in lake sediments. Biogeochemistry. 100(1-3):185–196.
- Ebina J, Tsutsui T, Shirai T. 1983. Simultaneous determination of total nitrogen and total phosphorus in water using peroxodisulfate oxidation. Water Res. 17(12):1721–1726.
- Edzwald JK, Tobiason JE. 1999. Enhanced coagulation: US requirements and a broader view. Water Sci Technol. 40(9):63–70.
- Garnier J, Vilain G, Silvestre M, Billen G, Jehanno S, Poirier D, Martinez A, Decuq C, Cellier P, Abril G. 2013. Budget of methane emissions from soils, livestock and the river network at the regional scale of the Seine basin (France). Biogeochemistry. 116(1-3):199–214.
- Gudasz C, Bastviken D, Steger K, Premke K, Sobek S, Tranvik LJ. 2010. Temperature-controlled organic carbon mineralization in lake sediments. Nature. 466(7305):478–481.
- Hu WT, Tang Q, Sun W, Zhu LF, Xing P. 2017. Dissolved methane dynamics during the degradation of organic matter derived from cyanobacterial bloom. China Environ Sci. 37(2):702–710.
- Huttunen JT, Alm J, Saarijärvi E, Matti Lappalainen K, Silvola J, Martikainen PJ. 2003. Contribution of winter to the annual CH4 emission from a eutrophied boreal lake. Chemosphere. 50(2):247–250.
- Jiang JW, Li SD, Shen YY, Wu YL, Huang CC, Huang T, Jiang S. 2017. Spatial differences of optical properties of CDOM and their source apportionment in Taihu Lake in summer. Res Environ Sci. 30(7):1020–1030.
- Jiang XY, Zhang L, Yao XL, Xu HX, Li M, 2017. Greenhouse gas flux at reservoirs of Jiangxi Province and its influencing factors. J Lake Sci. 29(4):1000–1008.
- Johansson AE, Klemedtsson AK, Klemedtsson L, Svensson BH. 2003. Nitrous oxide exchanges with the atmosphere of a constructed wetland treating wastewater: Parameters and implications for emission factors. Tellus B. 55(3):737–750.
- Johnson MS. 2008. CO2 efflux from Amazonian headwater streams represents a significant fate for deep soil respiration. Geophys Res Lett. 35(17):1–5.
- Jones JB, Holmes RM, Fisher SG, Grimm NB, Greene DM. 1995. Methanogenesis in Arizona, USA dryland streams. Biogeochemistry. 31(3):155–173.
- Lambert T, Bouillon S, Darchambeau F, Morana C, Roland FAE, Descy J-P, Borges AV. 2017. Effects of human land use on the terrestrial and aquatic sources of fluvial organic matter in a temperate river basin (The Meuse River, Belgium). Biogeochemistry. 136(2):191–211.
- Lay JJ, Miyahara T, Noike T. 1996. Methane release rate and methanogenic bacterial populations in lake sediments. Water Res. 30(4):901–908.
- Li BB, Ma JH, Wu LF. 2014. Effects of dissolved organic matter in soil on the emission of CO2 and N2O. Acta Ecol Sin. 34(16):4690–4697.
- Marie A, Marvin D. 1987. Methane in surface waters of Oregon estuaries and rivers1. Limnol Oceanogr. 32(3):716–722.
- Marotta H, Pinho L, Gudasz C, Bastviken D, Tranvik LJ, Enrich-Prast A. 2014. Greenhouse gas production in low-latitude lake sediments responds strongly to warming. Nat Clim Change. 4(6):467–470.
- Mayorga E, Aufdenkampe AK, Masiello CA, Krusche AV, Hedges JI, Quay PD, Richey JE, Brown TA. 2005. Young organic matter as a source of carbon dioxide outgassing from Amazonian rivers. Nature. 436(7050):538–541.
- McKnight DM, Boyer EW, Westerhoff PK, Doran PT, Kulbe T, Andersen DT. 2001. Spectrofluorometric characterization of dissolved organic matter for indication of precursor organic material and aromaticity. Limnol Oceanogr. 46(1):38–48.
- Minderlein S, Blodau C. 2010. Humic-rich peat extracts inhibit sulfate reduction, methanogenesis, and anaerobic respiration but not acetogenesis in peat soils of a temperate bog. Soil Biol Biochem. 42(12):2078–2086.
- Mulholland PJ, Fellows CS, Tank JL, Grimm NB, Webster JR, Hamilton SK, Martí E, Ashkenas L, Bowden WB, Dodds WK, et al. 2001. Inter-biome comparison of factors controlling stream metabolism. Freshw Biol. 46(11):1503–1517.
- Raveh A, Avnimelech Y. 1979. Total nitrogen analysis in water, soil and plant material with persulphate oxidation. Water Res. 13(9):911–912.
- Raymond PA, Hartmann J, Lauerwald R, Sobek S, McDonald C, Hoover M, Butman D, Striegl R, Mayorga E, Humborg C, et al. 2013. Global carbon dioxide emissions from inland waters. Nature. 503(7476):355–359.
- Richey JE. 2002. Outgassing from Amazonian rivers and wetlands as a large tropical source of atmospheric CO2. Science. 416(6881):617–620.
- Seitzinger SP. 1988. Denitrification in freshwater and coastal marine ecosystems: Ecological and geochemical significance. Limnol Oceanogr. 33(4part2):702–724.
- Sierra A, Jiménez-López D, Ortega T, Fernández-Puga MC, Delgado-Huertas A, Forja J. 2020. Methane dynamics in the coastal – Continental shelf transition zone of the Gulf of Cadiz. Estuar Coast Shelf Sci. 236:106653.
- Smemo KA, Yavitt JB. 2011. Anaerobic oxidation of methane: an underappreciated aspect of methane cycling in peatland ecosystems? Biogeosciences. 8(3):779–793.
- Smith LK, Lewis WM, Chanton JP, Hamilton GC, Hamilton SK. 2000. Methane emissions from the Orinoco River floodplain, Venezuela. Biogeochemistry. 51(2):113–140.
- Song XN, Yu T, Zhang Y, Zhang Y, Yin XY. 2010. Distribution characterization and source analysis of dissolved organic matters in Taihu Lake using three dimensional fluorescence excitation-emission matrix. Acta Sci Circumst. 30(11):2321–2331.
- Stanley EH, Casson NJ, Christel ST, Crawford JT, Loken LC, Oliver SK. 2016. The ecology of methane in streams and rivers: patterns, controls, and global significance. Ecol Monogr. 86(2):146–171.
- Stocker TF, Qin D, Plattner GK. 2014. Climate Change 2013: The Physical Science Basis. Contribution of Working Group I to the Fifth Assessment Report of IPCC the Intergovernmental Panel on Climate Change, vol. 18, pp. 95–123.
- Tian ZX. 2018. Study on the seasonal regularity and influencing factors of greenhouse gas emission of typical wetland in Poyang Lake. Southeast University(Master degree)in China.
- Usui T, Koike I, Ogura N. 2001. N2O production, nitrification and denitrification in an estuarine sediment. Estuar Coast Shelf S. 52(6):769–781.
- Walter Anthony KM, Vas DA, Brosius L, Chapin FS, Zimov SA, Zhuang Q. 2010. Estimating methane emissions from northern lakes using ice- bubble surveys. Limnol Oceanogr Methods. 8(11):592–609.
- Xi Y, Wang T, Ni JR, Han P, Yi ML, Zhen T, Jiang Y, Ma RQ, Cui F. 2018. Characterization of dissolved organic matter fractions in the Ning-Meng Section of the Yellow River and relationship with metal ions. Environ Sci. 39(09):4114–4121.
- Xiao QT, Hu ZH, Fu CS, Bian H, Lee X, Chen ST, Shang DY. 2019. Surface nitrous oxide concentrations and fluxes from water bodies of the agricultural watershed in Eastern China. Environ Pollut. 251:185–192.
- Xiao QT, Zhang M, Hu ZH, Gao YQ, Hu C, Liu C, Liu SD, Zhang A, Zhao JY, Xiao W, et al. 2017. Spatial variations of methane emission in a large shallow eutrophic lake in subtropical climate. J Geophys Res Biogeosci. 122(7):1597–1614.
- Yan XC, Zhang ZQ, Ji M, Wang MY, Ran SS, Xu XG, Wang GX. 2018. Concentration of dissolved greenhouse gas and its influence factors in the summer surface water of eutrophic lake. J Lake Sci. 30(5):1420–1428.
- Yang FY, Zhang SL, Wang SM, Hu XK, Wang HW, Tang MY, Zhang M, Zhong JC. 2021. Dissolution and emission patterns and influencing factors of greenhouse gases in Panjiakou Reservoir. China Environ Sci. 41(11):5303–5313.
- Zhang YL, Dijk MAV, Liu ML, Zhu GW, Qin BQ. 2009. The contribution of phytoplankton degradation to chromophoric dissolved organic matter (CDOM) in eutrophic shallow lakes: Field and experimental evidence. Water Res. 43(18):4685–4697.
- Zhou YQ, Xiao QT, Yao XL, Zhang YL, Zhang M, Shi K, Lee XH, Podgorski DC, Qin BQ, Spencer RGM, et al. 2018. Accumulation of terrestrial dissolved organic matter potentially enhances dissolved methane levels in eutrophic Lake Taihu, China. Environ Sci Technol. 52(18):10297–10306.