
 ?Mathematical formulae have been encoded as MathML and are displayed in this HTML version using MathJax in order to improve their display. Uncheck the box to turn MathJax off. This feature requires Javascript. Click on a formula to zoom.
Abstract
With the aim of exploring the features of the phytoplankton community and eutrophication status in the lower reaches of the Haihe River Basin near Tianjin, sampling surveys were carried out in May, July and September of 2021. The results showed 53 dominant phytoplankton species in the survey area, of which 36 species were found in May, while 28 were found both in July and September. Ten dominant species were highlighted in the surveys, mainly belonging to Cyanophyta, Chlorophyta, Bacillariophyta, and Cryptophyta. The regions with relatively higher levels of phytoplankton biomass and abundance were Duliujian River, Qilihai Wetland and New Chaobai River, while the highest species richness and biodiversity occurred in Yuqiao Reservoir, Duliujian River, New Chaobai River and Ji Canal. The highest TN content was observed in Duliujian River, and the highest TP, chl-a, CODMn and EI were recorded in New Chaobai River. In contrast, the region with the lowest level of eutrophication was Yuqiao Reservoir. Correlation analysis and RDA analysis showed that the eutrophication assessment indices affecting the phytoplankton community and distribution of dominant species were mainly TN, chl-a and CODMn in May and July, while TN, TP, chl-a, CODMn and EI were the most influential in September.
Introduction
Phytoplankton are considered the predominant primary producer in aquatic ecosystems and an important indicator of water quality along with playing pivotal roles in aquatic food webs. However, the variable environmental characteristics of aquatic habitat in different regions lead to spatial and temporal heterogeneity in the distribution, biomass and community structure of phytoplankton (Maren et al. Citation2012). Although the nutrients nitrogen and phosphorus are essential for phytoplankton, eutrophication is triggered under high nutrient conditions. Therefore, the phytoplankton biodiversity index and the richness index are important indicators for measuring the degree of water eutrophication and are also important parameters for indicating the ecological health of rivers (Maialen et al. Citation2013).
Haihe river basin, with a total area of 318,200 km2, is one of the seven major basins in China, and in which the Haihe watershed is biggest. Moreover, the fan-shaped Haihe watershed includes North canal, Yongding river, Daqing river, Ziya river, South canal and Haihe mainstem, and all of them converge at Tianjin and drain into Bohai Bay (Xia et al. Citation2005, Domingues et al. Citation2012, Shao et al. Citation2014, Qiu et al. Citation2019). The lower reaches of the Haihe River Basin near Tianjin is located at the junction of Bohai sea and North China Plain, belonging to the center of the Bohai economic zone. Therefore, the massive amounts of pollutants have been discharged, leading to intense impacts on the natural aquatic habitats (Xia and Zhang Citation2011, Gao et al. Citation2014). A previous survey showed that serious nitrogen pollution existed in the downstream of Haihe river basin near Tianjin and cyanobacteria blooms erupted in a series of rivers and reservoirs (Xiong et al. Citation2005). Furthermore, according to the nationwide monitoring of the seven major basins in 2015, Hai River Basin was the most polluted (Yang et al. Citation2017). In view of the situation, a series of environmental protection measures have been taken by the government. However, the recent survey results indicated that although the aquatic environment has been improved to a certain extent, the content of TN and TP in the river network of Tianjin central urban area still exceeded Grade V and Grade III respectively, which led to moderate eutrophication (Zheng et al. Citation2018).
According to the previous study, the phytoplankton richness declined in Haihe river basin from the upstream to the downstream sections (Yang et al. Citation2005). The ecological survey and health assessment has been conducted at 73 sampling stations in the lower reaches of Haihe river basin, and the results indicated that the ecological health status of the aquatic ecosystems in the survey area were poor generally. Moreover, the eutrophication levels were relatively higher, while the phytoplankton biodiversity lower, compared to several aquatic ecosystems in northern China (Hao et al. Citation2014). Additionally, the long-term observations and studies on Baiyangdian, a shallow lake in the lower reaches of Haihe River Basin, demonstrated that the phytoplankton biomass in the lake gradually decreased due to eutrophication, and the ecological health was deteriorating.
In this study, water samples were collected and the characteristics of the phytoplankton community and eutrophication status were analyzed in the lower reaches of Haihe River Basin. Furthermore, the effects of eutrophication assessment indices on phytoplankton community are discussed. Through the present study, we hope to provide basic information on ecological status, aquatic organism resources, and eutrophication status as reference states for aquatic environment protection.
Materials and methods
Survey sampling
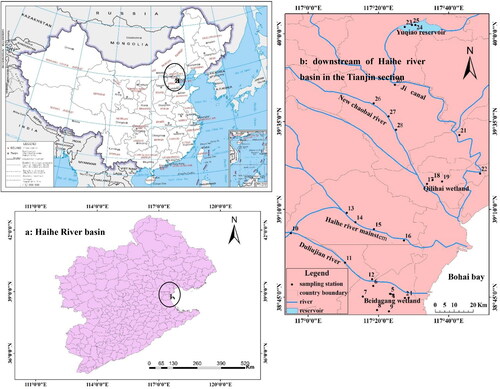
Sampling stations were set up in the different areas of the lower reaches of Haihe River Basin, including Beidagang Wetland (1-9), Duliujian River (10-12), Haihe river mainstem city section (13-16), Qilihai Wetland (17-19), Ji Canal (20-22), Yuqiao Reservoir (23-25) and New Chaobai River (26-28). The samplings occurred in May, July, and September of 2021 ().
Figure 1. Map of sampling stations.
Water sample collection and measurement
The surface water at a depth of 0.5 m was collected using a 5 L plexiglass Kitahara’s hydrophore. A 1 L water sample was placed in a plastic jar and fixed with 1% Lugol’s solution immediately. The samples were taken back to the laboratory and left to stand for 24 h. Precipitate was concentrated and counted to obtain the phytoplankton abundance (×104 cells·L−1). Phytoplankton taxonomic identification was performed by microscopic examination simultaneously (Ming et al. Citation2020).
A 500 mL surface water sample at each station was collected synchronously to measure total nitrogen (TN), total phosphorus (TP), chlorophyll a (chl-a) and chemical oxygen demand (CODMn). The methods for pre-treatment and analysis of water samples followed Greenberg et al. (Citation1992). TN and TP were measured by potassium persulfate digestion - UV spectrophotometry method. Chl-a was measured by the ethanol freeze extraction method. CODMn was measured through acid potassium permanganate-sodium oxalate titration.
Statistical analysis
Margalef richness index, d, and Shannon-Wiener diversity index, H, of the phytoplankton community at each station were calculated using PRIMER 6.0 software. The equations are as follows:
In which: S is the number of species per station; N is the total number of individuals per station; and Pi is the proportion of individuals of the species at each station.
The trophic status at each station was evaluated according to the《Technological regulations for surface water resources quality assessment》(Water conservancy industry standard of the people’s Republic of China, SL395-2007), in which TP, TN, potassium permanganate index (CODMn) and chl-a were used as the evaluation indicators. Furthermore, the indicators were fitted with the corresponding fixed scores to obtain the linear regression equations, and then the measured values of the indicators were convert into the grading scores (En) using linear interpolation. Ultimately, a eutrophication index (EI) was calculated and used to evaluate the trophic status of each station. Moreover, the evaluation indicators and the trophic status were graded according to the national standards listed in .
Table 1. Grading standards for freshwater trophic status.
In which: En is the grading score of the evaluation index, and N is the number of evaluation indicators.
Pearson correlation analysis was performed on the phytoplankton community parameters (abundance, biomass, d and H) and eutrophication indicators (TN, TP, chl-a, CODMn, EI) using SPSS 19.0 software.
The phytoplankton species which accounted for more than 5% of the total community abundance at each station were considered the dominant species. Canoco for windows 4.5 software was used to analyze the correlation between the abundance of dominant species and the eutrophication indicators (Leira and Sabater Citation2005). The phytoplankton abundance and eutrophication indicators were all subjected to log(x + 1) conversion before the analysis. And then, detrended canonical analysis (DCA) was performed on phytoplankton abundance to determine whether it fits a unimodal or linear distribution. The DCA results showed that the longest gradients were between 3-4 among all ordinations, therefore the redundancy analysis (RDA) belonging to the linear model was chosen to explore the relationship between the dominant species and the eutrophication indicators (Tang et al. Citation2006; Tan et al. Citation2013).
Result
Characteristics of dominant phytoplankton
During the investigation, 53 dominant phytoplankton species were identified within the survey area, of which 36 species were found in May and 28 species each in July and September. The taxonomies of the dominant phytoplankton were mainly in the Cyanophyta, Chlorophyta, Bacillariophyta, and Cryptophyta. Moreover, the dominant species identified in the three surveys were Cryptomonas erosa, Merismopedia sp., Phormidlum tenue, Dactylococcopsis sp., Chlorella vulgaris, Scenedesmus quadricauda, Nitzschia sp., Cyclotella meneghiniana, Ankistrodesmus sp. and Scenedesmus dimorphus. In addition, the times and locations with the maximum abundance of dominant species were listed in and .
Table 2. Directory of dominant phytoplankton species.
Table 3. Distribution characteristics of maximal abundance of dominant phytoplankton species in three surveys.
Spatial distribution of biomass and abundance of the phytoplankton community
The biomass of phytoplankton community was relatively higher in Duliujian River and Qilihai Wetland, with the annual average maximum of 15.75 mg·L−1 in station 11 and 14.68 mg·L−1 in station 17, respectively. Whereas, the lowest phytoplankton biomass occurred in Yuqiao Reservoir with the annual average minimum 1.074 mg·L−1 at station 25. In terms of spatial distribution, a decreasing trend from the midstream to the upstream and downstream presented both in Duliujian River and Qilihai Wetland. However, no obvious spatial distribution pattern of phytoplankton biomass was observed in Beidagang wetland. In addition, the phytoplankton biomass in Haihe River mainstem city section declined from the upstream and midstream to the downstream, with a relatively lower annual average from 2.023 mg·L−1 to 2.242 mg·L−1. Moreover, the phytoplankton biomass in Ji Canal was much higher in the downstream section than that in the upstream and midstream sections. Inversely, the biomass in New Chaobai River was higher in the midstream compared to the upstream and downstream.
The spatial distribution of the phytoplankton abundance in the survey area was consistent with that of biomass basically. The annual average of abundance was 0.40 × 10⁴ cells·L−1-7924.17 × 104 cells·L−1. Duliujian River, Qilihai Wetland and New Chaobai River were the areas with the higher phytoplankton abundance, whereas the lowest was in Yuqiao Reservoir ().
Table 4. Biomass and abundance of the phytoplankton community in the survey area.
Spatial distribution of species richness index and biodiversity index
The highest species richness level was observed in Yuqiao Reservoir in the survey area, with the annual average maximum 6.50 at station 25. The phytoplankton richness in Haihe River mainstem city section decreased from the upstream to the downstream with the annual average d of 0.96 − 5.12.Whereas, d value in New Chaobai River showed a gradual increase from the upstream to the downstream with the annual average d of 0.54 − 4.03. Moreover, d in Duliujian River and Ji Canal was higher in the midstream than that in the upstream and downstream. In particular, the spatial distribution of species richness in Beidagang Wetland was quite different. The areas with the higher d value were located in the northeast and south of the wetland, whereas that with lower d value in the northwest and central of the region. Otherwise, the species richness of phytoplankton in the Qilihai Wetland was at the intermediate level with the annual average d of 1.07 − 4.18.
The spatial distribution of phytoplankton biodiversity index H in the survey area was consistent with that of species richness index d basically, with the annual average H of 0.870 − 3.02. The high H value areas were distributed in Yuqiao reservoir, the downstream of New Chaobai River, the midstream of Duliujian River and Ji canal. Whereas, the northwest and the central of Beidagang Wetland were the areas with the lower phytoplankton biodiversity ().
Table 5. Species richness index d and biodiversity index H of the phytoplankton community in the survey area.
Spatial distribution of TN and TP in the survey area
The region with the highest TN level was Duliujian River, in which the annual average TN ranged from 4.74 to 8.83 mg·L−1. In addition, the TN level was higher in the midstream than that in the upstream and downstream. Nevertheless, the lowest TN level in the survey area was observed in Baidagang Wetland, with the annual average of 1.21 − 3.79 mg·L−1. However, the spatial distribution pattern of TN in the region was not obvious. In terms of the spatial distribution, the TN level was higher in the midstream than that in the upstream and downstream in Haihe River mainstem city section. The spatial distribution of the TN level in Qilihai Wetland was relatively homogeneous, and the annual average TN ranged from 3.95 to 4.74 mg·L−1. Additionally, the annual average TN in Ji Canal presented an increasing trend from the upstream to the downstream, and the TN level was 3.69 − 5.42 mg·L−1. On the contrary, the annual average TN in New Chaobai River declined from the upstream to the downstream, with the TN level of 5.01 − 8.17 mg·L−1.
The highest level of TP was observed in New Chaobai River in the survey area, and the annual average was 0.485 − 1.209 mg·L−1. Moreover, the TP level was higher in the midstream the that in the upstream and downstream. The TP level in Ji Canal ranked second only to which in New Chaobai River, with the annual average of 0.188 − 0.679 mg·L−1 In addition, the TP level in the midstream was higher than that in the upstream and downstream. Whereas, the region with the lowest TP level was Yuqiao Reservoir, and the annual average range from 0.028 to 0.031 mg·L−1. Generally speaking, the TP levels in Beidagang Wetland and Qilihai Wetland were relatively lower. and the differences among the sampling stations were insignificant. The annual average of TP in Duliujian River was higher in the midstream than that in the upstream and downstream, with the TP level of 0.177 − 0.270 mg·L−1. Moreover, the TP content in Haihe River mainstem city section was at the intermediate level, and the annual average ranged from 0.099 to 0.433 mg·L−1. Basically, the TP level was higher in the downstream than that in the upstream and midstream ().
TABLE 6. Spatial distribution of TN and TP in the survey area.
Spatial distribution of chl-a and CODMn in the survey area
According to , the lowest level of chl-a in the survey area was observed in Yuqiao Reservoir, with the annual average of 10.53 − 16.67 µg·L−1 Whereas, the region with the highest chl-a was New Chaobai River, in which the annual average chl-a ranged from 80.49 to 289.35 μg·L−1. Additionaly, the chl-a level was higher in the midstream than that in the upstream and downstream. Moreover, the annual average chl-a in Duliujian River ranked second only to which in New Chaobai River, and the spatial distribution pattern was similar to that in New Chaobai River. However, the spatial distribution heterogeneity of chl-a was showed in Beidagang Wetland, with the higher level in the north and west of the region while the lower in the south and east. Especially, the chl-a level at station 15 was 5.61 − 9.58 times higher than that at other stations in Haihe River mainstem city section. The annual average chl-a in Qilihai Wetland ranged from 53.78 to 173.11 μg·L−1. The spatial distribution of chl-a in Ji Canal exhibited an increasing trend from upstream to downstream, with the annual average of 68.46 to 144.96 μg·L−1.
TABLE 7. Spatial distribution of Chl-a and CODMn in the survey area.
The lowest CODMn level was observed in Yuqiao Reservoir during the surveys, with the annual average of 6.59 − 7.10 mg·L−1 Whereas, the region with the highest CODMn was Qilihai Wetland in the survey area, and the annual average ranged from 17.42 to 23.18 mg·L−1. Furthermore, the CODMn level in New Chaobai River was also relatively high, with the annual average of 15.92 − 22.16 mg·L−1. In terms of spatial distribution, the CODMn level was higher in the midstream than that in the upstream and downstream. Nevertheless. the spatial distribution of CODMn in Beidagang Wetland exhibited an obvious heterogeneity. In particular, the region with the higher CODMn level was located in the northeast of the wetland, while other regions were relatively lower. The CODMn level in Duliujian River was higher in the midstream than that in the upstream and downstream. Additionally, the CODMn content in Ji Canal gradually increased from the upstream to the downstream, and the annual average ranged from 13.20 to 16.27 mg·L−1.
Spatial distribution of water eutrophication index EI in the survey area
The indicators were fitted with the corresponding fixed scores to obtain the linear regression equations, and then the measured values of the indicators were convert into the grading scores (En) using linear interpolation. Ultimately, eutrophication index (EI) was calculated and used to evaluate the trophic status of each station ().
Table 8. Linear regression equation fitted by assessment indices and fixed score.
As showed in , the annual average EI in the survey area ranged from 45.18 to 75.46. In addition, according to the criterion listed in , 11 of the 28 sampling stations were in the oligotrophic and mesotrophic state (20<EI≦50), while 17 stations in the eutrophic state (50<EI≦100). To be specific, the lowest eutrophication status was observed in Yuqiao Reservoir with the annual average EI of 45.83 − 48.85. Nevertheless, the highest eutrophication region in the survey area was New Chaobai River, in which EI of each station generally exceeded more than 20% of the eutrophication baseline value. In addition, EI in New Chaobai River was higher in the midstream than that in the upstream and downstream. Moreover, the spatial distribution of EI in Beidagang Wetland was relatively uniform and most of the sampling stations were in the mesotrophic state. Most of the sampling stations in Ji Canal, Duliujian River and Qilihai Wetland were in the mild eutrophic status, with the annual average EI from 51.05 to 62.29. Furthermore, EI in Ji Canal, Duliujian River and Haihe River mainstem city section were higher in the midstream and downstream than that in the upstream.
Table 9. Spatial distribution characteristics of EI in the survey area.
Correlation analysis between phytoplankton community parameters and eutrophication assessment indices
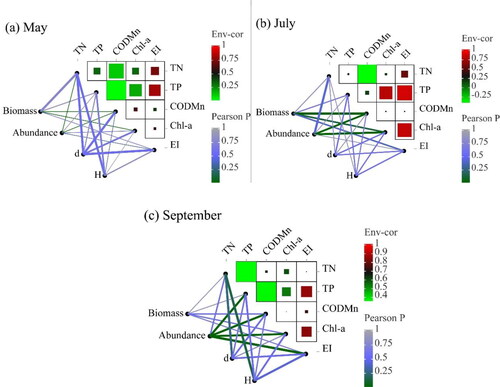
Pearson correlation analysis was performed between the phytoplankton community parameters and the eutrophication assessment indices in the three surveys, with the results shown in . There were significantly positive correlations between chl-a, CODMn and both the biomass and abundance in May (P < 0.01). Moreover, there was also a significant positive correlation among TN, EI and abundance (P < 0.01). In addition, the correlation between CODMn and H was significantly positive (P < 0.05). Furthermore, there was a significant positive correlation among chl-a, CODMn, EI and the phytoplankton community biomass in July (P < 0.05), and a positive correlation among TN, chl-a, CODMn and the abundance (P < 0.01). Additionally, in September, TP, chl-a, CODMn and EI were positively correlated with the phytoplankton community abundance (P < 0.01). However TN and EI were negatively correlated with d and H (P < 0.05).
Figure 2. Pearson correlation between the phytoplankton community parameters and the eutrophication assessment indices.
RDA analysis between phytoplankton species and eutrophication assessment indices
RDA analysis ordination is an integrated multivariate statistical analysis method, which is used to reflect the trend between the environmental factors and their effects on the biological community parameters. The ecological adaptability of the phytoplankton species are variable, so the positions of the species on the RDA ordination plot reflect the dependence on the environmental factors. In addition, the cosine of the angle between the environmental factor arrow and the species arrow indicates the correlation between the environmental factors and the species abundance (Pierre and Eugene Citation2001; Wang et al. Citation2018). In this study, the phytoplankton dominant species are listed in and the results exhibited in .
Figure 3. Ordination plot between the abundance of phytoplankton dominant species and the eutrophication assessment indices.
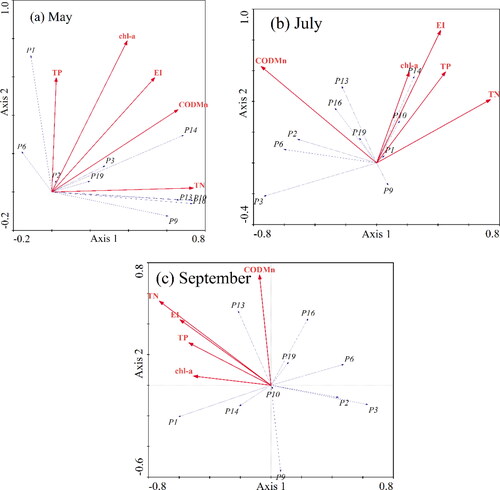
As shown in , the Axis 1 of RDA reflected the gradient changes of TN, CODMn and EI in May, and the TN, CODMn and EI levels gradually increased from left to right along the Axis 1. In addition, the Axis 2 reflected the trends of TP and chl-a, and the TP content gradually increased from bottom to top along the Axis 2. Furthermore, TN, TP, chl-a, CODMn and EI were positively correlated with the abundance of P2, P3, P14 and P19 (P < 0.01), indicating that the distribution of Merismopedia sp., Phormidlum tenue, Cyclotella meneghiniana and Scenedesmus dimorphus were dependent on the levels of nutrients, phytoplankton standing stock and organic matter. Additionally, TP, chl-a and EI were positively correlated with the abundance of P1 and P6 (P < 0.01), demonstrating that phosphorus, phytoplankton standing stock and eutrophication index were the major factors affecting the distribution of Cryptomonas erosa and Dactylococcopsis sp. Moreover, TN, CODMn and EI were positively correlated with the abundance of P9, P10, P13 and P16 (P < 0.05), indicating that the distribution of Chlorella vulgaris, Nitzschia sp. and Ankistrodesmus sp. were mainly regulated by nitrogen, organic matter and eutrophication index.
According to , the Axis 1 of RDA reflected the gradient changes of TN and CODMn in July, and the TN content increased from left to right along the Axis 1 while the CODMn level decreased continuously. Additionally, the Axis 2 reflected the distribution trend of TP, chl-a and EI, and the levels of TP, chl-a and EI gradually increased from bottom to top along the Axis 2. Furthermore, CODMn was positively correlated with the abundances of P2, P3, P6, P13, P16 and P19 (P < 0.01), indicating that the organic matter was the main factor affecting the distribution of Merismopedia sp., Phormidlum tenue, Dactylococcopsis sp., Nitzschia sp., Ankistrodesmus sp. and Scenedesmus dimorphus. In addition, TN, TP, chl-a and EI were positively correlated with the abundance of P1 and P14 (P < 0.05), showing that the distribution of Cryptomonas erosa, Scenedesmus quadricauda and Cyclotella meneghiniana were mainly effected by nutrients, phytoplankton standing stock and eutrophication index. However, TP, chl-a, CODMn and EI were negatively correlated with the abundance of P9 (P < 0.01), demonstrating that the environment situation with high phosphorus and organic matter was not suitable for the growth of Chlorella vulgaris.
Based on the results in , the Axis 1 of RDA reflected the distribution changes of TN, TP, chl-a and EI in September, and the TN, TP, chl-a and EI levels gradually decreased from left to right along the Axis 1. Moreover, the Axis 2 reflected the trend of CODMn, and the CODMn level continuously increased from bottom to top along the Axis 2. Furthermore, TN, TP, chl-a, CODMn and EI were positively correlated with the abundance of P13 (P < 0.05), indicating that the distribution of Nitzschia sp. was regulated by nutrients, organic matters and phytoplankton standing stock. TN, TP, chl-a and EI were positively correlated with the abundance of P1 and P14 (P < 0.05), exhibiting that the distributions of Cryptomonas erosa and Cyclotella meneghiniana were mainly influenced by the nitrogen and phosphorus nutrients and phytoplankton standing stock. In addition, there were significantly positive correlation between CODMn and the abundance of P6, P16 and P19 (P < 0.01), showing that the organic matters had a significant impact on the distribution of Dactylococcopsis sp., Ankistrodesmus sp. and Scenedesmus dimorphus. Neverthless, TN, TP, chl-a, CODMn and EI were negatively correlated with the abundance of P2, P3, P9 and P10 (P < 0.01), demonstrating that the relatively higher levels of nutrients and organic matters had negative effects on the distribution of Merismopedia sp., Phormidlum tenue, Chlorella vulgaris and Nitzschia sp.
Discussion
Spatial distribution of the phytoplankton community and the eutrophication assessment indices
According to the previous research, the inverse correspondence between the phytoplankton community biomass and species richness were often observed, along with the similar trend between the abundance and biodiversity index (Jin et al. Citation2022). The reasons may be that as the biomass and abundance of phytoplankton community gradually increased and reached a high level, a few species with the stronger competitiveness would become dominant, leading to decline of the richness and biodiversity (Ma et al. Citation2022). In this study, the lowest levels of phytoplankton community biomass and abundance but the highest of richness and biodiversity were observed in Yuqiao Reservoir, a water source protection area in Tianjin, simultaneously, proving the views properly. Moreover, the phytoplankton biomass and abundance in Ji Canal decreased from the upstream to the downstream, but the opposite trend of the species richness and biodiversity was observed simultaneously. However, the decreasing of biomess and abundance exhibited in Haihe mainstem city section, meanwhile, the similar distribution trend of richness and biodiversity was shown. The result implied that the species with the absolute competitive advantage have not emerged yet in the region.
The lowest levels of TP, chl-a, CODMn and EI were observed in Yuqiao Reservoir concurrently, which indicated the reservoir served as a water source protection area in Tianjin has been protected well. The nutrients, chl-a, CODMn and EI were relatively lower in Beidagang wetland and Qilihai wetland, because the two regions were designated as the nature reserves, being less disturbed by the human activities, which made the ecological characteristics different from the lotic system. The similar situation was observed in the northeast China wetlands (Liu et al. Citation2022). The TN content in Duliujian River and Haihe maintem city section was higher in the midstream than the upstream and downstream, while decreased from the upstream to downstream in Ji Canal and New Chaobai River. Additionally, the TP level in New Chaobai River, Ji Canal and Duliujian River was higher in the midstream than the upstream and downstream, however, increased from the upstream to downstream in Haihe maintem city section. Moreover, the discriminating distribution of CODMn exhibited in the different regions. To be specific, the CODMn in New Chaobai River and Duliujian River was relatively higher in the midstream than the upstream and downstream, meanwhile, decreased from the upstream to downstream in Ji Canal. The results indicated that the variable spatial patterns were effected by the hydrologic condition, emission source distribution and environmental protect measures in the different regions (Fornarelli et al. Citation2013, Li et al. Citation2016, Li et al. Citation2022). Neverthless, the similar spatial distribution trend of EI in New Chaobai River, Ji Canal, Duliujian River and Haihe maintem city section was observed, which implied that the distribution discrepancy among the eutrophication assessment indices has been counteracted by calculation.
Responses of the phytoplankton community to eutrophication assessment indices
The historical survey showed that the TN level was lower than 2 mg·L−1 in the downstream Haihe River at Tianjin section in 2004 (Xiong et al. Citation2005). However, the annual average TN has reached up to 4.96 mg·L−1, with more than 60% of the sampling stations under the eutrophic status to a certain degree in this study. Furthermore, the phytoplankton blooms were triggered easily by eutrophication in the aquatic environment. In this study, the abundance of Chroococcus minutus has reached up to 6723.70 × 104 cells·L−1, which exceeded the red tide level. Moreover, as the aquatic environment situation changed, the succession of phytoplankton dominant species occurred. A previous survey in 2009 indicated that Chlorophyta and Bacillariophyta were the phytoplankton dominate species in Haihe river basin (Yang et al. Citation2005). Neverthless, the results in this study showed that with the nutrients levels increasing, Cyanobacteria and Cryptophyta have become the dominant species along with Chlorophyta and Bacillariophyta.
The life activities of phytoplankton are affected by a series of environmental factors. Temperature is an important ecological factor, but which among the most sampling stations were insignificant in the surveys, and not in the formula for calculating the eutrophication index, so the results of temperature has been not included in this study. Although nitrogen and phosphorus are the biogenic elements for phytoplankton, nutrients became a limiting factor when consumed heavily by the phytoplankton communities. This view has been proved by the results in this study, that the negative correlation between the TN content and the phytoplankton abundance was obtained in July. However, nutrients seemed to be unnecessary to maintain the relatively higher levels of the phytoplankton community richness and biodiversity at times. According to this study, the negative correlations among the TN content, the richness index and the biodiversity index were observed in September, which supported the view. Furthermore, the similar results have been obtained in Ruxi river (Xiang et al. Citation2017) and Chaohu lake (Wang et al. Citation2018). In addition, the construction process of the phytoplankton communities are quite complicated. Although the taxonomic status of several phytoplankton species are similar, the environment and resource conditions demanded by them differ sharply. Nevertheless, some phytoplankton species with the similar life habit may not coexist in the same habitat due to niche overlap and resource competition. Therefore, the phytoplankton community structure is the tradeoff between the environmental factors and biological elements (Xing et al. Citation2015, Dong et al. Citation2016). In this study, the variable nitrogen demands by Merismopedia sp. and Dactylococcopsis sp. belonging to Cyanobacteria phylum have been observed, thus the two phytoplankton species were in the different quadrants on the RDA ordination plot. Moreover, Phormidlum tenue, Nitzschia sp. and Cyclotella meneghiniana were highly correlated with each other due to their similar nutrients demands (). According the previous research, CODMn were significantly related to the variability of phytoplankton community composition (Li et al. Citation2021). But the similar situation was not observed in this study, probably because the effect depended on the specific environmental conditions and CODMn level.
Conclusion
53 phytoplankton species were identified in the downstream of Haihe river at Tianjin section. Among them 10 dominant species were highlighted, mainly belonging to Cyanophyta, Chlorophyta, Bacillariophyta and Cryptophyta.
The regions with the relatively higher levels of phytoplankton biomass and abundance were Duliujian River, Qilihai Wetland and New Chaobai River, while which with the higher of the species richness and biodiversity were Yuqiao Reservoir, Duliujian River, New Chaobai River and Ji Canal. The highest TN content was observed in Duliujian River, and the highest TP, chl-a, CODMn and EI were recorded in New Chaobai River. In contrast, the region with the lowest level of eutrophication was Yuqiao Reservoir.
Correlation analysis and RDA analysis showed that the eutrophication assessment indices affecting the phytoplankton community and distribution of dominant species were mainly TN, chl-a and CODMn in May and July, while TN, TP, chl-a, CODMn and EI in September.
Disclosure statement
The authors declare no competing interests.
Data availability statement
The data that support the findings of this study are available from the first author, upon reasonable request.
Additional information
Funding
Notes on contributors
Yong Dou
Dou Yong is an assistant professor in Tianjin Agriculture University, mainly engaged in the investigation and evaluation of aquatic ecology.
Wen L. Zhou
Wen L. Zhou is a professor in Tianjin Agricultural College, mainly engaged in the study of aquatic ecology.
References
- Domingues RB, Barbosa AB, Sommer U, Galvao HM. 2012. Phytoplankton composition, growth and production in the Guadiana estuary (SW Iberia): Unraveling changes induced after dam construction. Sci Total Environ. 416:300–313.
- Dong XY, Li B, He FZ, Gu Y, Sun MQ, Zhang HM, Tan L, Xiao W, Liu SR, Cai QH. 2016. Flow directionality, mountain barriers and functional traits determine diatom metacommunity structuring of high mountain streams. Sci Rep. 6:24711.
- Fornarelli R, Antenucci JP, Marti CL. 2013. Disturbance, diversity and phytoplankton production in a reservoir affected by inter-basin water transfers. Hydrobiologia. 705(1):9–26.
- Gao X, Zhou F, Chen C-TA. 2014. Pollution status of the Bohai Sea: An overview of the environmental quality assessment related trace metals. Environ Int. 62:12–30.
- Greenberg AE, Clesceri LS, Eaton AD. 1992. Standard methods for the examination of water and wastewater. Washington: American Public Health Association.
- Hao LX, Sun RH, Chen LD. 2014. Health assessment of river ecosystem in Haihe River Basin, China. Environ Sci. 35(10):2692–3701.
- Jin L, Chen HH, Xue YY, Soininen J, Yang J. 2022. The scale-dependence of spatial distribution of reservoir plankton communities in subtropical and tropical China. Sci Total Environ. 845:157179.
- Leira M, Sabater S. 2005. Diatom assemblages distribution in Catalan rivers, NE Spain, in relation to chemical and physiographical factors. Water Res. 39(1):73–82.
- Li M, Li Y, Zhang ZY, Xu QL, Iqbal SM, Xi YL, Xiang XL. 2022. The significance of phosphorus in algae growth and the subsequent ecological response of consumers. J Freshwater Ecol. 37(1):57–69.
- Liu XX, Sui FY, Liu Y, Fan YW. 2022. Comparison of three functional classification approaches to characterize phytoplankton response to environmental heterogeneity: a case study in NE China wetlands. J Freshwater Ecol. 37(1):103–116.
- Li Y, Xiong W, Zhang W, Wang C, Wang P. 2016. Life cycle assessment of water supply alternatives in water-receiving areas of the South-to-North Water Diversion Project in China. Water Res. 89:9–19.
- Li YR, Yu ZD, Ji SP, Meng J, Kong Q, Wang RQ, Liu J. 2021. Diverse drivers of phytoplankton dynamics in different phyla across the annual cycle in a freshwater lake. J Freshwater Ecol. 36(1):13–29.
- Ma CX, Li ZY, Mwagona CP, Rabbany A, Bhadha HJ. 2022. Spatial and seasonal dynamics of phytoplankton groups and its relationship with environmental variables in Lake Okeechobee, USA. J Freshwater Ecol. 37(1):173–187.
- Maialen G, Angel B, Javier F, Marta R. 2013. Phytoplankton composition indicators for the assessment of eutrophication in marine waters: Present state and challenges within the European directives. Mar Pollut Bull. 66(1-2):7–16.
- Maren S, Gabriel S, Herwig S, Tom A. 2012. Trophic overyielding”: Phytoplankton diversity promotes zooplankton productivity. Ecology. 93(12):2719–2727.
- Ming A, Yang Y, Liu S, Nong Y, Tao Y, Zeng J, An N, Niu C, Zhao Z, Jia H. 2020. A Decade of Close-to-Nature Transformation Alters Species Composition and Increases Plant Community Diversity in Two Coniferous Plantations. Front Plant Sci. 11:1141.
- Pierre L, Eugene G. 2001. Ecologically meaningful transformations for ordination of species data. Oecologia. 129(2):271–280.
- Qiu Y, Liu Y, Liu Y, Chen Y, Li Y. 2019. An interval two-stage stochastic programming model for flood resources allocation under ecological benefits as a constraint combined with ecological compensation concept. IJERPH. 16(6):1033.
- Shao C, Guan Y, Chu C, Shi R, Ju M, Shi J. 2014. Trends Analysis of Ecological Environment Security Based on DPSIR Model in the Coastal zone: A survey study in Tianjin, China. Int J Environ Res. 8(3):765–778.
- Tan X, Sheldon F, Bunn S, Zhang QF. 2013. Using diatom indices for water quality assessment in a subtropical river, China. Environ Sci Pollut Res Int. 20(6):4164–4175.
- Tang T, Cai QH, Liu JK. 2006. Using epilithic diatom communities to assess ecological condition of Xiangxi River system. Environ Monit Assess. 112(1-3):347–361.
- Wang XL, Zhang M, Yin J. 2018. Composition and influential factors of phytoplankton function groups in Lake Chaohu. J Lake Sci. 30(2):431–440.
- Xia J, Liu MY, Jia SF. 2005. Water security problem in north China: research and perspective. Pedosphere. 15(5):563–575.
- Xiang R, Li QY, Yuan Y, Zhang HB, Dong CC, Shi JQ, Wu ZX. 2017. Functional group characteristics of planktonic diatoms and their relationship with environmental factors in the Ruxi River. Environ Sci 38(8):3290–3301.
- Xia B, Zhang LJ. 2011. Pollution status of the Bohai Sea: An overview of the environmental quality assessment related trace metals. Acta Oceanol Sin. 30(3):43–54.
- Xing W, Wu HP, Shi Q, Hao BB, Liu H, Wang ZX, Liu GH. 2015. Multielement stoichiometry of submerged macrophytes across Yunnan plateau lakes (China). Sci Rep. 5:10186.
- Xiong DQ, Du XM, Tang WH, Huang MX, Gu QB, Guo LJ, Li FS. 2005. Nitrogen distribution in the water of the haihe river mainstreammainstem and estuary seawater and its relationship with water dissolved oxygen levels. Res Environ Sci. 18(3):1–4.
- Yang X, Liu Q, Luo X, Zheng Z. 2017. Spatial Regression and Prediction of Water Quality in a Watershed with Complex Pollution Sources. Sci Rep. 7:8318.
- Yang ZF, Sun T, Qin XS. 2005. Calculating Methods for Quantifying Environmental Flows in Estuaries:A Case Study of Haihe River Basin. J Env Inform. 6(2):72–79.
- Zheng JF, Jiao JD, Sun LP, Zhang S, Wang SP. 2018. Pollution characteristics of nitrogen, phosphate and eutrophication of river network in central urban area of Tianjin. J Lake Sci. 30(2):326–335.