
 ?Mathematical formulae have been encoded as MathML and are displayed in this HTML version using MathJax in order to improve their display. Uncheck the box to turn MathJax off. This feature requires Javascript. Click on a formula to zoom.
Abstract
Assemblages of infralittoral periphytic algae are understudied due partially to the historical emphasis on phytoplankton and other water-column characteristics to evaluate the integrity of lentic systems. We tested the null hypothesis that characteristics of epilithic algal assemblages at infralittoral sites in reservoirs of Middle and East Tennessee do not infer trophic state. One infralittoral site in five mesotrophic and five eutrophic reservoirs in Middle and East Tennessee was sampled to determine the relative abundance of the most common epilithic diatoms and soft algae, concentrations of epilithic chlorophyll (chl) a, and water concentrations of chl a, total phosphorus (TP), and total nitrogen (TN). The concentration of epilithic chl a correlates significantly to the concentration of TP but not to TN as determined by the probability values for Pearson’s correlation coefficients. The water concentration of chl a does not correlate significantly to concentrations of TP, TN, or epilithic chl a. Trophic-state indicator values for 162 epilithic diatom taxa and 102 epilithic soft-algal taxa are calculated as the abundance-weighted average of the concentration of epilithic chl a normalized between 0 and 100. The trophic-state indicator values indicate the relationship of the abundance of algal taxa to trophic state and contribute to our limited knowledge of the effects of eutrophication on infralittoral algal taxa. Trophic-state indices are calculated as the mean abundance-weighted average of trophic-state indicator values for algal taxa of an assemblage. The index values infer the trophic state of the sites and are the first to use epilithic concentrations of chl a as opposed to water-column characteristics to indicate trophic-state optima for periphytic algae of lentic systems. The indices are easy to calculate and provide novel tools to help evaluate and monitor the trophic state of infralittoral sites in reservoirs of Middle and East Tennessee.
Introduction
Assemblages of periphytic algae are a major component of the trophic base of many infralittoral zones (Ren et al. Citation2021) and their integrity is essential for ecological function of even the largest freshwater lakes and reservoirs (Vadeboncoeur et al. Citation2008). The composition of benthic diatom and soft-algal assemblages in infralittoral zones of Tennessee reservoirs is largely unknown. The inadequate knowledge of the diversity and relative abundance of infralittoral periphytic algae limits the ability to evaluate the impacts of environmental stressors on the integrity of littoral communities (Rimet et al. Citation2019; Oleksy et al. Citation2021). Assessments of periphytic infralittoral algae may be especially valuable to evaluate the impact of anthropogenic activities given that infralittoral algae may be more influenced by watershed pollutants and nutrient-rich runoff relative to pelagic phytoplankton (Kravtsova et al. Citation2020).
The most common methods to assess trophic state of lentic systems include measurements of water-column variables such as concentration of phosphorus (P), nitrogen (N), and chlorophyll a (chl a) (Poikane et al. Citation2014; Soria et al. Citation2019). Because indicators of trophic state may be inaccurate, assessment of multiple indicators is best (Tolonen et al. Citation2020). Water concentrations of P and N may not accurately reflect trophic state. Pulses of precipitation-induced nutrient runoff result in variations of nutrient concentrations especially in infralittoral zones (Kravtsova et al. Citation2020). Consumption of nutrients by periphytic algal assemblages and macrophytes may result in reduced nutrient concentrations of water in infralittoral zones relative to pelagic zones (Cantonati and Lowe Citation2014; Špoljar et al. Citation2017). In addition, nutrient concentrations of water at infralittoral sites may not indicate the amount of nutrients available to periphytic algal assemblages because they may be obtained directly from substrate and recycled within algal mats (Carlton and Wetzel Citation1988).
Concentrations of chl a of water may not accurately represent the concentration of phytoplankton. Kasprzak et al. (Citation2008) demonstrated the efficacy of concentrations of chl a to estimate phytoplankton biomass diminishes with decreased trophic state at pelagic sites in German Lakes. Kasprzak et al. (Citation2008) also demonstrated that the concentration of chl a of phytoplankton is influenced by the ratio of the biomass of algal groups such as green algae, cyanobacteria, diatoms, dinoflagellates, and chrysophytes. Concentrations of chl a and phytoplankton composition of water may vary over short time periods (DeNicola et al. Citation2004). Both of these variables are influenced by diurnal vertical migrations, herbivory, depth, and season (Graham et al. Citation2016). Concentrations of chl a and phytoplankton composition of water samples only provide information about a specific location in the water column at a specific time. Multiple water-column samplings at different depths, locations, and over long time periods may be required to provide an accurate indicator of water quality (King et al. Citation2000).
Determination of the composition of benthic diatom assemblages is a standard protocol to monitor habitat quality of streams and shallow rivers in many European countries (Schneider et al. Citation2013) and several states of the United States of America (Lebkuecher and Mauney Citation2020). This is because the relationship of trophic state to the abundance of many lotic diatoms is well studied which results in accurate trophic-state indicator values (Marchetto and Sforzi Citation2018).
The composition of benthic diatom assemblages may differ substantially between lentic and lotic systems in the same regions (Soinen and Weckström Citation2009) although several studies indicate that eutrophication increases the abundance of eutraphentic species in both lentic and lotic systems (Marchetto and Sforzi Citation2018; Tao et al. Citation2020; Kennedy and Buckley Citation2021). More studies of the correlations of the abundance of infralittoral diatoms to trophic state are needed to improve the ability to evaluate the effects of trophic state on infralittoral diatom assemblages (Kennedy and Buckley Citation2021).
The use of the composition of soft-algal assemblages to assess trophic state is much less common relative to the use of diatom assemblages (Stancheva and Sheath Citation2016). This is because the autecology of most soft algae is poorly understood or unknown (Paul Citation2017). The limited number of studies that assign trophic-state indicator values to benthic soft-algal taxa is due partially to the assumption that relative to diatoms, soft algae may be more influenced by the physical characteristics of a habitat. For example, spates of high-water velocity in streams and wave energy in infralittoral zones may have a greater effect on soft-algal composition relative to diatoms because of the much greater variation of soft-algal morphologies (Whitton Citation2012). A few studies demonstrate that some soft algae are indicators of trophic state (Schneider and Lindstrøm Citation2011; Fetscher et al. Citation2014; Lebkuecher et al. Citation2015; Stancheva and Sheath Citation2016; Grimmett and Lebkuecher Citation2017). The largely inadequate autecological information for many soft algae precludes their use as indicators of habitat quality and more studies of the relationships of the abundance of soft algae to trophic state are needed (Stancheva and Sheath Citation2016; Mei et al. Citation2022).
Reservoirs differ from natural lakes in many important aspects that complicate designation of trophic state. Hydraulic retention time for lakes may be years, yet for reservoirs may be days and is more variable (Wetzel Citation2001). The greater rate and variation of water velocity for reservoirs results in more turbid water, greater fluctuations in nutrient concentrations, and a phytoplankton biomass that may be limited periodically by hydraulic washout as opposed to nutrient concentration (USGS 2018). Reservoirs typically have a greater horizontal (downstream) gradient of nutrient concentrations from a more nutrient-rich primary inflow to a less-nutrient-rich outflow (USGS 2018). Water levels for large reservoirs may be kept consistent for navigation that result in shallow and stable littoral zones with macrophytes and floating algal mats that consume littoral nutrients (Cox Citation1984). These reservoir characteristics relegate the traditional variables of the concentrations of water-column nutrients and chl a less meaningful as benchmarks of trophic state (Cox Citation1984).
Large lentic systems in the state of Tennessee include one natural lake and 647 reservoirs. All Tennessee reservoirs are impacted by eutrophication due mostly to agricultural runoff, removal of riparian habitats for shoreline development, and expansion of urban communities (TDEC 2022). Our objectives were to: (1) document the percent composition of the most common epilithic diatom and soft-algal taxa at infralittoral sites in Middle and East Tennessee reservoirs with different morphological and chemical characteristics, (2) determine the trophic state of the reservoir sites, (3) determine the relationships of percent composition of algal taxa to trophic state, and (4) develop indices using algal taxa to help evaluate and monitor the trophic state of the sites. The objectives were met by: (1) sampling epilithic diatom and soft-algal assemblages, (2) measurement of the characteristics used to assess trophic state including concentrations of epilithic chl a and water concentrations of total phosphorus (TP) total nitrogen (TN), and chl a, (3) calculation of trophic-state indicator values for diatom and soft-algal taxa as the abundance-weighted average for the concentration of epilithic chl a normalized between 0 and 100, and (4) calculation of trophic-state indices as the mean abundance-weighted average of the trophic-state indicator values for taxa of an assemblage.
Methods
Sampling dates, site locations, and site descriptions
One infralittoral site in five mesotrophic and five eutrophic reservoirs in Middle and East Tennessee in the southeastern United States of America was sampled July 1, 2020 through July 7, 2020. Site and reservoir choices were based on visual characteristic such as water clarity, periphyton biomass, presence of surface algal mats, and water-quality parameters measured previously by the Tennessee Valley Authority (unpublished data). Infralittoral reservoir sites selected because they appeared mesotrophic included those in Chilhowee, Norris, Tellico, Parksville, and McKamy reservoirs (, Appendix A). Infralittoral reservoir sites selected because they appeared eutrophic included those in Nickajack, Swan, Percy Priest, Green Cove, and Old Hickory reservoirs.
Figure 1. Locations of the ten reservoir sites sampled (open circles with letter abbreviations for the sites) and cities (dark circles) near the sites sampled in Middle and East Tennessee. Lines within the Tennessee state boundary represent county boundaries. Abbreviations for sites: Chlihowee (Ch), Norris (No), Tellico (Te), Parksville (Pa), McKamy (Mc), Nickajack (Ni), Swan (Sw), Percy Priest (PP), Green Cove (GC), and Old Hickory (OH).
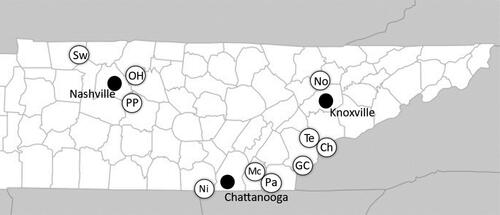
The reservoirs we sampled used to produce hydroelectricity include Chilhowee, Norris, Tellico, Parksville, Nickajack, Percy Priest, and Old Hickory reservoirs. There was no water movement at any of the infralittoral sites at the time of sampling and none of the sites exhibited evidence of sediment deposition, disturbance from animals, or anthropogenic activity. The Swan, Percy Priest, and Old Hickory reservoir sites are located in the Interior Plateau Level III Ecoregion in Middle Tennessee (Appendix A). The geologic base is composed of mostly limestone with some chert, sandstone, siltstone, and shale. The landforms include plains, tablelands, and low-elevation hills (Griffith et al. Citation1997). The Nickajack site is located in the Southwestern Appalachian Level III Ecosystem to the west and adjacent to the Interior Plateau Level III Ecoregion. The ecoregion is dominated by the Cumberland Plateau that is dissected into gorges and valleys. The geologic base is composed mostly of sandstone and includes shale and conglomerate over limestone. The limestone is exposed in the gorges, valleys, and at the Nickajack site (Griffith et al. Citation1997). The Norris site is located in the Ridge and Valley Level III Ecoregion. The ecoregion is characterized by parallel ridges and valleys as a result of faulting and folding events. The geologic base includes sandstone, dolomite, shale, chert, and limestone (Griffith et al. Citation1997). Limestone is most common in the valleys including at the Norris site. The Chilhowee, Tellico, Parksville, McKamy, and Green Cove sites are located in the Blue Ridge Mountains Level III Ecoregion that parallels the eastern border of Tennessee. The ecoregion includes the Great Smokey Mountains and deep valleys with streams and reservoirs used for recreational activities and hydroelectricity production. The geologic base is a mix of igneous, metamorphic, and sedimentary rock including limestone and sandstone (Griffith et al. Citation1997).
Chemical characteristics and concentrations of chlorophyll a of water and concentrations of epilithic chlorophyll a
One measurement at each site of specific conductance, concentration of dissolved solids, and concentration of dissolved oxygen was taken at a depth of 0.1 m using a Multiparameter meter (model HI 98194, Hana Instruments Incorporated, Woonsocket, Rhode Island). One water sample was collected at each site at a depth of 0.1 m for determinations of the concentrations of TP and TN of water. Samples were transferred to the lab in darkness at 4 °C. Concentrations of TP and TN were determined using the ascorbic-acid and cadmium-reduction methods, respectively (Baird et al. Citation2017) with a Lachat QuickChem 8500 Flow Injection Analyzer (Lachat Instruments, Loveland, Colorado). We acknowledge that multiple measurements of TP and TN at the ten sites leading up to the sampling of algae and chl a would have been optimal but was logistically impossible and cost prohibitive.
Concentrations of chl a of water were determined from three replicate measurements at 0.1-m depths with a portable chl a fluorometer (AlgaeChek Ultra, model RS232, Modern Water Incorporated, New Castle, Delaware). Concentrations of epilithic chl a were measured with a portable fluorometer designed to determine the concentration of benthic chl a (Benthotorch, bbe Moldaenke, Schwentinental, Germany). The fluorometer tip was pressed onto the surface of ten replicate cobbles located at approximately 0.25-m depths with diameters ≥ 12 cm and most of the surface area for periphyton growth parallel to the surface. A depth of 0.25 m was chosen to avoid sampling assemblages in which production was light limited.
Composition of epilithic diatom and soft-algal assemblages
Composition of epilithic diatom and epilithic soft algal assemblages was determined from five cobbles removed from approximately 0.25-m depths that had diameters between 12 and 18 cm2 and most of the surface area for periphyton growth parallel to the surface. All of the sites had cobbles large enough to meet the sampling criteria and there were no cobbles without biofilm. Algae were removed in the field using a scrub brush and razor blade and combined into one 1-L container. The algae were preserved in a final volume of 1 L of 1% glutaraldehyde adjusted to pH 7.0 with NaOH, and transferred to the lab in darkness.
A ten-mL subsample was removed from the 1-L containers of preserved algae to determine diatom composition. Diatoms were concentrated by centrifugation (10 min at 1200 g) and placed in 10 mL of 2.5% sodium hypochlorite for 1 h to remove organic debris and intracellular material (Carr et al. Citation1986). Aliquots of cleaned frustules (50 µL) were pipetted onto glass cover slips, dried at 50°C, and mounted on glass microscope slides with Permount mounting medium (ThermoFisher Scientific, Waltham, Massachusetts, USA). Valves were identified using an Olympus microscope, model CH30 (Olympus Corporation, Tokyo, Japan) at 1000 X magnification and tallied until a minimum of 200 valves from each site were counted. Striae density was determined as the number of striae at the valve margin in the middle of the valve as recommended by Anonymous (Citation1975). Valves in girdle view were not identified or tallied. Primary taxonomic references used to identify diatom taxa included Patrick and Reimer (Citation1966, Citation1975), Krammer and Lange-Bertalot (Citation1986, Citation1988, Citation1991a, Citation1991b), and Ponader and Potapova (Citation2007). Valves of small Nitzschia species (<22 µm) similar to N. frustulum (Kütz) Grun., N. inconspicua Grun., and N. liebetruthii Rabenh. not identified to species were recorded as members of the Nitzschia small species complex. This complex was created to decrease inconsistency of water-quality analyses using diatom composition in the European Union given members of the complex may be difficult to distinguish (Kahlert et al. Citation2012). Valves identified as N. frustulum, N. inconspicua, and N. liebetruthii were tallied and were not tallied as members of the Nitzschia small species complex. The permanent diatom mounts are maintained in the Austin Peay State University Herbarium in Clarksville, Tennessee.
Percent composition of soft-algal assemblages was determined as described by Woelkerling et al. (Citation1976) and Schoen (Citation1988) using wet mounts on a ruled microscope slide (NeoSci, Nashua, New Hampshire) with a 16-mm2 grid divided into eight 2-mm2 squares. Large filamentous soft algae were cut with scissors such that well-mixed aliquots of the sample could be obtained after the subsamples for diatom identification were removed. Soft algae within a 2-mm2 square were observed at 100 X, 400 X, and 1000 X magnification and identified to the lowest taxonomic level possible. Taxa were recorded as units. A unit is one cell of unicellular taxa, each 10 µm-diameter of colonial taxa, and each 10 µm-length of filamentous taxa. This method accounts for biovolume differences between unicells and large filaments and colonies that may consist of hundreds of cells that are not practical to count (Baird et al. Citation2017). Taxa were enumerated until at least 1000 units were counted. Primary taxonomic references used to identify soft-algal taxa included Prescott (Citation1982), Whitford and Schumacher (Citation1984), Anagnostidis and Komárek (Citation1988), Dillard (Citation1989a, Citation1989b, Citation1990, Citation1991a, Citation1991b, Citation1993, Citation2000, Citation2007), Komárek (Citation2013), KomáRek and Anagnostidis (Citation2008a, Citation2008b), Eloranta et al. (Citation2011), and John et al. (Citation2011). Diatoms were not included in the soft-algal enumeration.
Abundance-weighted averages of epilithic concentrations of chlorophyll a for algal taxa
The relationship of the trophic state of the sites to percent composition for each diatom and soft-algal taxon identified was assessed as the abundance-weighted average (AWA) of the concentration of epilithic chl a. The AWA of a characteristic for a taxon is the average value of a characteristic weighted by the abundance of the taxon at each site and calculated as:
where: AWAj is the abundance-weighted average of a characteristic for taxonj, nj = number of taxon units j sampled at a site, v = value for the characteristic of a site (concentration of epilithic chl a), and N = total number of taxon units j at all of the sampling sites used to calculate AWAj. Taxa more abundant at sites with greater values for a site characteristic, such as concentration of epilithic chl a, have greater values for AWA. Values for AWA were normalized between 0 and 100 using the equation:
where: Zi is the ith normalized value in the data set, xi = ith value in the data set, min(x) = minimum value in the data set, and max(x) = maximum value in data set. The normalized AWA value of epilithic [chl a] for a taxon serves as the taxon’s trophic-state indicator value.
Trophic-state indices using epilithic diatom and soft algal assemblages
A trophic-state index (TSI) is calculated as:
where: nj = number of taxon units j sampled at a site, tij = trophic-state indicator value for taxon j, and N = total number of taxon units at the sampling site used to calculate the index. The trophic-state indicator value for a taxon is the normalized AWA of the concentrations of epilithic chl a for the sites where the taxon occurs. Trophic-state indices calculated with diatom taxa include: (1) a TSI with diatom taxa identified to species (TSIdiatom sp.), (2) a TSI with all diatom taxa identified including those identified to genus only (TSIdiatom), and (3) a TSI with diatom taxa identified to species excluding the phytoplankton Asteroinella formosa Hassell (TSIdiatom sp. - A. formosa). The TSIdiatom sp. - A. formosa was calculated because the epilithic samples collected at the Green Cove site had high concentrations of A. formosa valves. Asteroinella formosa is mostly planktonic. High concentrations of A. formosa valves among the valves of benthic taxa can result from a previous A. formosa bloom and may not reflect the current benthic diatom composition (Pouličková et al. Citation2004; Sivarajah et al. Citation2016). Trophic-state indices calculated with soft-algal taxa include a TSI with soft-algal taxa identified to species (TSIsoft algal sp.) and a TSI with all soft-algal taxa identified including those identified to genus only (TSIsoft algae).
Shannon diversity index, evenness, percent similarity of algal assemblages, and statistical analyses
Shannon Diversity Index (H′) and evenness (J) of soft-algae and diatom assemblages were calculated by the equations of Shannon and Weaver (Citation1949):
where Pi = abundance of species i and S = richness (number of taxa). Percent similarities of diatom and soft-algae assemblages were calculated as the sum of the lower of the two percent-composition values for each taxon common to two sites (Whittaker and Fairbanks Citation1958).
The objectives of the statistical methods were to determine the site characteristics that are significantly different and to determine the relationships between site characteristics and the composition of algal assemblages. Statistical methods to accomplish the objectives followed the recommendations of Sokal and Rohlf (Citation2011) and Whitlock and Schluter (Citation2020). Data for the concentrations of epilithic chl a were heteroscedastic as determined by Brown-Forsythe tests and thus were compared using Steel-Dwass tests (Sokal and Rohlf Citation2011). Data for concentrations of chl a of water were not heteroscedastic as determined by Brown-Forsythe and tests and were compared using Tukey-Kramer Honestly Significant Difference Tests (Sokal and Rohlf Citation2011). Means were considered significantly different if they differed at the experimentwise-error rate of alpha = 0.05.
Correlations between epilithic concentrations of chl a, water-column characteristics, and values for the trophic-state indices were evaluated using Pearson’s correlation coefficients (Whitlock and Schluter Citation2020). The value of Pearson’s correlation coefficient (r) ranges from −1 to 1. The closer the r value is to zero, the weaker the linear relationship between the two variables. If r is positive, then as one variable increases, the other also increases. If r is negative, then as one variable increases, the other decreases. The linear correlation is significant if within the 95% confidence level of probability (Whitlock and Schluter Citation2020).
Results
Trophic state of the sites
The concentration of epilithic chl a is a more accurate indicator of the trophic state of the sites relative to the concentrations of chl a of water at the time the sites were sampled. The concentrations of epilithic chl a are significantly lower at the Chilhowee, Norris, Tellico, Parksville, and McKamy sites relative to the Nickajack, Swan, Percy Priest, Green Cove, and Old Hickory sites (). The concentrations of chl a of water are not significantly greater at the Nickajack and Swan sites relative to the Chilhowee, Norris, Tellico, Parksville, and McKamy sites () despite the significantly greater concentrations of epilithic chl a and greater concentrations of TP and TN at the Nickajack and Swan sites ( and ). Concentrations of epilithic chl a correlate significantly with concentrations of TP as indicated by the p value ≤ 0.05 (). Concentrations of epilithic chl a do not correlate significantly with concentrations of TN () due partially to the relatively low concentration of TN at the Green Cove site (), yet relatively high concentration of epilithic chl a at the Green Cove site (). The concentrations of chl a of water do not correlate significantly with concentrations of TP, TN, or epilithic chl a () due partially to the low concentrations of chl a of water at the Nickajack and Swan sites ().
Figure 2. Concentration of epilithic chlorophyll (chl) a at reservoir sites. Means ± standard error represent 10 replicate measurements and are significantly different at the experiment-wise error rate of alpha = 0.05 if they do not share the same letter. Abbreviations for sites: Chlihowee (Ch), Norris (No), Tellico (Te), Parksville (Pa), McKamy (Mc), Nickajack (Ni), Swan (Sw), Percy Priest (PP), Green Cove (GC), and Old Hickory (OH).
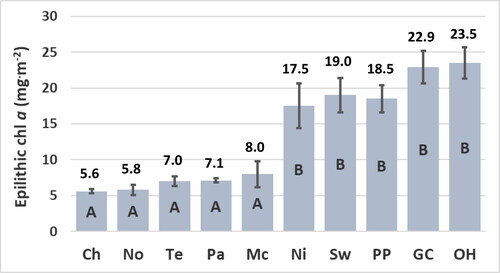
Figure 3. Concentration of chlorophyll (chl) a of water at reservoir sites. Means ± standard error represent three replicate measurements and are significantly different at the experiment-wise error rate of alpha = 0.05 if they do not share the same letter. Abbreviations for sites: Chlihowee (Ch), Norris (No), Tellico (Te), Parksville (Pa), McKamy (Mc), Nickajack (Ni), Swan (Sw), Percy Priest (PP), Green Cove (GC), and Old Hickory (OH).
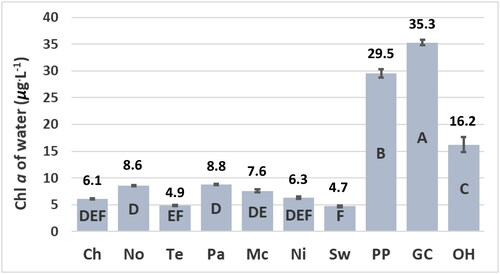
Figure 4. Concentration of total phosphorus of water at reservoir sites. Bars represent the concentration of 1 sample. Abbreviations for sites: Chlihowee (Ch), Norris (No), Tellico (Te), Parksville (Pa), McKamy (Mc), Nickajack (Ni), Swan (Sw), Percy Priest (PP), Green Cove (GC), and Old Hickory (OH).
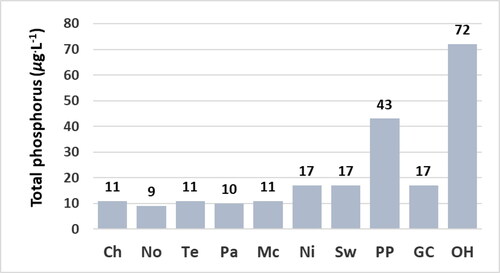
Figure 5. Concentration of total nitogen of water at reservoir sites. Bars represent the concentration of 1 sample. Abbreviations for sites: Chlihowee (Ch), Norris (No), Tellico (Te), Parksville (Pa), McKamy (Mc), Nickajack (Ni), Swan (Sw), Percy Priest (PP), Green Cove (GC), and Old Hickory (OH).
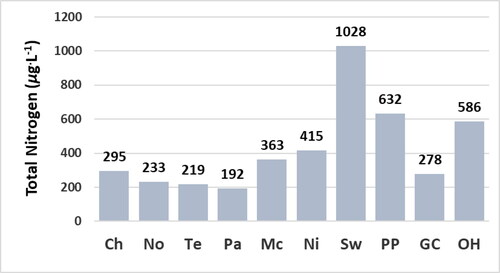
Table 1. Pearson’s correlation coefficients followed by significance of probability at the 95 percent confidence level in parentheses for the concentrations of epilithic chlorophyll (chl) a and chl a of water to concentrations of total phosphorus, total nitrogen, and each other.
The reservoir sites may be divided into two distinct groups, mesotrophic and eutrophic, based on the significant differences of the concentrations of epilithic chl a (). For this study, mesotrophic sites are designated by concentrations of epilithic chl a that range from 5.6 mg · m−2 to 8.0 mg · m−2. These sites have concentrations of TP that range from 9 μg · L−1 to 11 μg · L−1 and include the Chilhowee, Norris, Tellico, Parksville, and McKamy sites (). Eutrophic sites are designated by concentrations of epilithic chl a that range from 17.5 mg · m−2 to 23.5 mg · m−2 (). These sites have concentrations of TP ≥ 17 μg · L−1 and include the Nickajack, Swan, Percy Priest, Green Cove, and Old Hickory sites ().
Specific conductance, concentrations of total dissolved solids, and concentrations of dissolved oxygen
The relatively low values for specific conductance and concentrations of total dissolved solids of water at the Chilhowee, Tellico, Parksville, McKamy, and Green Cove sites () reflect the soft water at these sites typical of most water in the Blue Ridge Mountain Level III Ecoregion (Appendix A) in the southeastern-most region of Tennessee (). The greater specific conductance and concentrations of dissolved solids at the Norris, Nickajack, Swan, Percy Priest, and Old Hickory sites reflect the hard water of these reservoirs due largely to the geologic bases of mostly limestone. The concentrations of dissolved oxygen at all sites are above the minimum specified by national water-quality criteria (5.0 mg · L−1) as potentially harmful to aquatic life and indicate that none of the sites are saprobic (USGS 2018). Specific conductance and concentrations of total dissolved solids and dissolved oxygen do not correlate significantly with concentrations of epilithic chl a or with water concentrations of chl a, TP, and TN determined by nonsignificant Pearson’s correlation coefficients (data not shown).
Table 2. Specific conductance and concentrations of dissolved solids and dissolved oxygen of water at reservoir sites.
Composition of algal assemblages and correlations of percent composition of algal taxa to trophic state
The 162 taxa of diatoms (Appendix B) and 102 taxa of soft algae (Appendix C) identified at the ten sites sampled illustrate the large diversity of algal taxa in the infralittoral zones of reservoirs in Middle and East Tennessee. Normalized abundance-weighted averages (NAWA) of the concentrations of epilithic chl a for diatom taxa (Appendix B) and for soft-algal taxa (Appendix C) serve as trophic-state indicator values. The mean NAWA of the concentrations of epilithic chl a for diatom taxa (40.8) and mean NAWA of the concentrations of epilithic chl a for soft-algal taxa (48.9) serve as approximate values that separate taxa based on their percent composition at mesotrophic and eutrophic sites. Taxa with high NAWA values have a greater percent composition at eutrophic sites. Taxa with low NAWA values have a greater percent composition at mesotrophic sites. There are no set guidelines for the use of abundance-weighted averages to designate taxa as reliable indicators of habitat quality (Stancheva et al. Citation2012). For this study, we consider taxa as strong indicators of eutrophic and mesotrophic reservoir sites those: (1) with values for the NAWA of the concentration for epilithic chl a in the upper and lower quartiles, respectively, (2) that are identified from more than one site, and (3) with a total percent composition ≥ 5%.
Diatom composition
The upper and lower quartiles for the NAWA of the concentrations of epilithic chl a for diatom taxa are ≥ 66.5 and ≤ 11.0, respectively. Diatom taxa considered strong indicators of eutrophic sites for this study include ten taxa: Asteroinella formosa Hassell, Cyclotella meneghiniana Kütz., Navicula antonii Lange-Bert., Navicula capitatoradiata Germ., Nitzschia frustulum (Kütz.) Grun., Nitzschia inconspicua Grun., Nitzschia palea var. debilis (Kütz.) Grun., Nitzschia palea var. tenuirostris Grun., Psammothidium microscopicum (Cholonky) S. Blanco, and Stephanodiscus minutulus (Kütz.) Round. Diatom taxa considered strong indicators of mesotrophic sites include two taxa, Achnanthidium druartii Rimet and Couté and Kobasiella micropunctata (H. Germ.) Lange-Bert. A synonym for K. micropunctata is Navicula micropunctata (H.Germ.) H. Kobayasi and Nagumo.
Achnanthidium is the most abundant diatom genus among the ten sites (23.9%; Appendix B). Achnanthidium is attached to substrate by mucus stalks and is often the most abundant diatom genus on stable substrate at stream sites subjected to spates of high-water velocity (Ponader and Potapova Citation2007). The resilience of Achnanthidium to hydrologic turbulence most likely contributes to the reason Achnanthidium is the most abundant diatom genus among the infralittoral sites we sampled. Achnanthidium minutissimum (Kütz.) Czarn. is the only species identified at all ten sites (Appendix B) which supports the characterization that A. minutissimum is widespread in the Eastern United States and is tolerant of a wide range of nutrient concentrations (Ponader and Potapova Citation2007). Achnanthidium minutissimum is the most abundant species at the five mesotrophic sites (; Chilhowee, Norris, Tellico, Parksville, and McKamy) which results in a low trophic-state indicator value (Appendix B). This result supports conclusions of earlier studies that A. minutissimum is more abundant in water that is not nutrient impaired (Kelly and Whitton Citation1995; Ponader and Potapova Citation2007; Lebkuecher et al. Citation2011; Tao et al. Citation2020).
Table 3. Diatom taxa in order of greatest percent composition at reservoir sites.
The mean ± standard error (SE) for the percent of diatom valves not identified to species is 15.1% ± 2.8 and ranged from 4.9% at the Green Cove site to 33.4% at the Nickajack site (Appendix B). The large percent of diatom valves not identified to species at the Nickajack site is due partially to the large percent of Pseudostaurosira species (15.9%; ). Many Pseudostaurosira species are very similar and several undescribed species are known to occur in North America (Spaulding et al. Citation2021). The Swan site has the next greatest percent of diatom valves not identified to species (25.4%) due partially to the large percent of valves that could only be identified as members of the Nitzschia small species complex (12.1%; ). Valves recorded as units of the Nitzschia small species complex occurred at nine of the ten sites and are more abundant at eutrophic sites (Appendix B).
The diatom assemblages most similar to each other () are those at the Tellico and Parksville sites (49% similar). The similarity most likely results from the similar habitats given both sites are located in the Metasedimentary Mountains Level IV Ecoregion (Appendix A) and are mesotrophic. The diatom assemblages at Percy Priest and Old Hickory sites are the next most similar (42% similar). These sites are located in the Inner Nashville Basin Level IV Ecoregion and the Outer Nashville Basin Level IV Ecoregion, respectively and are both eutrophic. The most dissimilar assemblages are those at the Green Cove and the Percy Priest sites and the Green Cove and and Old Hickory sites due largely to the high percent composition of valves of the phytoplankton Asterionella formosa (58.2%) at the Green Cove site ().
Table 4. Percent similarity of diatom assemblages at reservoir sites.
Soft-algal composition
The upper and lower quartiles for the NAWA of the concentration of epilithic chl a for soft-algal taxa are ≥ 74.9 and ≤ 8.4, respectively. Two soft-algal taxa meet the criteria for strong indicators of eutrophic sites: the filamentous chlorophyte Cladophora glomerata (L.) Kütz. and the epiphytic cyanophyte Chamaesiphon amethystinus (Rostaf.) Lemmerm. Four soft-algal taxa meet the criteria for strong indicators of mesotrophic sites: the filamentous cyanophytes Leptolyngbya truncata Anagn. and Komárek, Phormidium autumnale Gomont, Phormidium retzii (C. Agardh) Gomont, and Phormidium tergestinum (Kutzing) Anagn. and Komárek.
The four most abundant soft-algal taxa among the ten sites (Appendix C) are the filamentous chlorophytes Oedogonium (10.3%) and Spirogyra (9.7%) and the filamentous cyanophytes Leptolyngbya truncata (Lemmerm.) Anagn. and Komárek (8.6%), and Dichothrix gypsophila (Kütz.) Bornet and Flahault (8.5%). Oedogonium and Spirogyra were the most abundant taxa at the Nickajack and Swan sites, respectively (). Dichothrix gypsophila is the dominant taxon at the Green Cove site, second most abundant at the McKamy site, and is present at the Parksville site (Appendix C). This taxon is widespread (Komárek Citation2013) and common in infralittoral zones of lentic systems in North America (Prescott Citation1982). We have no explanation to why this taxon was not found at the other sites sampled. Leptolyngbya truncata (Basionym: Phormidium truncatum) is one of the top three most abundant taxa at four of the five mesotrophic sites () and is present at the other mesotrophic site (Tellico, Appendix C). Leptolyngbya truncata was not identified at any of the eutrophic sites (Appendix C).
Table 5. Soft-algal taxa in order of greatest percent composition at reservoir sites.
The mean ± SE for percent of soft algae not identified to species is 38.4% ± 7.0 and ranged from 9.8% at the Chilhowee site to 76.8% at the Nickajack sited (Appendix C). The much greater percent of soft algae not identified to species relative to diatoms is due to the large percent composition of a few soft-algal taxa that could not be identified to species without culturing to observe reproductive organs. For example, Oedogonium comprises 54.2% the soft-algal assemblage at the Nickajack site and Spirogyra comprises 34.3% of the soft-algal assemblage at the Swan site ().
The most dissimilar soft-algal assemblages are those at sites which differ in trophic state () and include those at the Old Hickory and McKamy sites (3% similar), Percy Priest and Chilhowee sites (3% similar), and Old Hickory and Norris sites (3% similar). The Old Hickory and McKamy sites and the Percy Priest and Chilhowee sites differ in trophic state () and by hardness of water (). The Old Hickory and Norris sites both have hard water () but differ in trophic state (). The most similar soft-algal assemblages () are those at the McKamy and Parksville sites (39% similar). These sites are both located in the Southern Metasedimentary Mountains Level IV Ecoregion approximately 10 km from each other (Appendix A, ) and both are mesotrophic.
Table 6. Percent similarity for soft-algal assemblages at reservoir sites.
Metrics for diatom and soft-algal assemblages
Taxon richness for diatom and soft-algal assemblages are differentially affected by reservoir size. Taxon richness for diatom assemblages is lowest at the Swan site, greatest at the Norris site (), and correlates significantly and positively with reservoir size determined by a significant Pearson’s correlation coefficient (r = 0.70, p = 0.02). The diatom assemblage at the Green Cove site has the lowest Shannon diversity index value (). This low value is due largely to low evenness, which in turn, is due largely to the high percent composition of A. formosa valves (58.2%; ). Taxon richness for soft-algal assemblages is lowest at the Swan site, greatest at the Percy Priest site (), and is not correlated significantly with reservoir size determined by a nonsignificant Pearson’s correlation coefficient (r = 0.24, p = 0.50). The mean ± SE taxon richness for soft-algal assemblages (23.5 ± 1.4) is significantly lower than the mean ± SE taxon richness for diatom assemblages (48 ± 4) as determined by a Student’s t test (p < 0.001). This result is consistent with several studies that demonstrate taxon richness for epilithic diatom assemblages is greater than taxon richness for epilithic soft-algal assemblages in Tennessee streams (Lebkuecher et al. Citation2015; Grimmett and Lebkuecher Citation2017; Lebkuecher et al. Citation2018; Lebkuecher and Mauney Citation2020). The Shannon diversity index and evenness values for the soft-algal assemblages are lowest at the Green Cove site () due partially to the high percent composition of Dichothrix gypsophila (58.5%; ).
Table 7. Metrics for diatom assemblages at reservoir sites.
Table 8. Metrics for soft-algal assemblages at reservoir sites.
Trophic-state indices based on diatom taxa
Values for the TSIdiatom sp. () range from 24.5 to 29.4 at mesotrophic sites (Chilhowee, Norris, Tellico, Parksville, and McKamy) and from 52.6 to 77.1 at eutrophic sites (Nickajack, Swan, Percy Priest, Green Cove, and Old Hickory). The similar values for the TSIdiatom sp. and TSIdiatoms () result from the relatively few diatom taxa that were not identified to species (15.1%). The greatest values for the TSIdiatom sp. and TSIdiatoms for the assemblage at the Green Cove site are due mostly to the high percent composition of A. formosa valves that have a high trophic-indicator value (NAWA for the concentration of epilithic chl a = 94.0, Appendix B). Values for the TSIdiatom sp. and TSIdiatoms are similar to the values for the TSIdiatom sp. - A. formosa except for the lower value for the TSIdiatom sp. - A. formosa for the assemblage at the Green Cove site (). This lower value still implies a eutrophic site given the value is substantially greater than values for the TSIdiatom sp., TSIdiatoms, and TSIdiatom sp. - A. formosa at the mesotrophic sites.
Figure 6. Values for the trophic-state index calculated with diatoms identified to species (TSIdiatom sp.) at reservoir sites. Abbreviations for sites: Chlihowee (Ch), Norris (No), Tellico (Te), Parksville (Pa), McKamy (Mc), Nickajack (Ni), Swan (Sw), Percy Priest (PP), Green Cove (GC), and Old Hickory (OH).
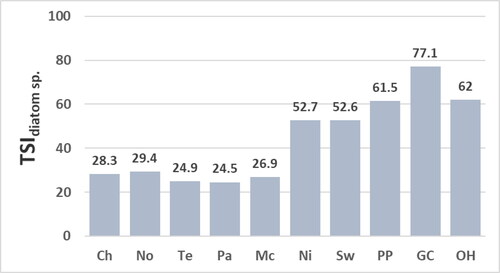
Figure 7. Values for the trophic-state index calculated with all diatoms identified including those identified to genus only (TSIdiatoms) at reservoir sites. Abbreviations for sites: Chlihowee (Ch), Norris (No), Tellico (Te), Parksville (Pa), McKamy (Mc), Nickajack (Ni), Swan (Sw), Percy Priest (PP), Green Cove (GC), and Old Hickory (OH).
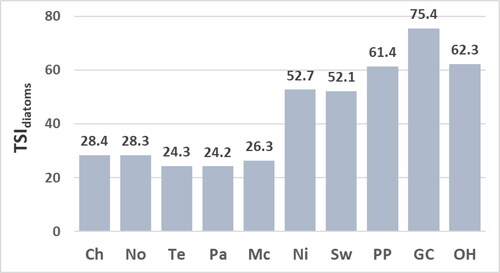
Figure 8. Values for the trophic-state index calculated with diatoms identified to species excluding the phytoplankton Asteroinella formosa (TSIdiatoms sp. - A. formosa) at reservoir sites. Abbreviations for sites: Chlihowee (Ch), Norris (No), Tellico (Te), Parksville (Pa), McKamy (Mc), Nickajack (Ni), Swan (Sw), Percy Priest (PP), Green Cove (GC), and Old Hickory (OH).
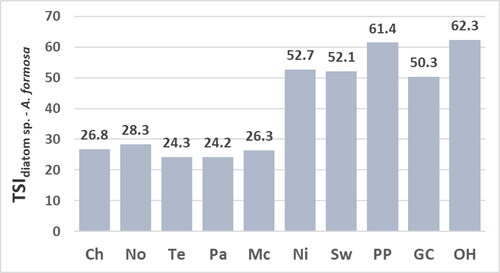
The TSIdiatom sp. and TSIdiatoms correlate significantly to concentrations of epilithic chl a and chl a of water and not to TP or TN (). The insignificant correlation of the TSIdiatom sp. and TSIdiatoms to concentrations of TP and TN is due partially to the moderate concentrations of TP and TN at the Green Cove site ( and ) yet high values for the TSIdiatom sp. and TSIdiatoms at the Green Cove site ( and ). Values for the TSIdiatom sp. - A. formosa correlate significantly to concentrations of epilithic chl a, TP of water, and TN of water (). The lack of significant correlation for the TSIdiatom sp. - A. formosa to concentrations of chl a of water is due partially to the high concentration of chl a of water at the Green Cove site () yet a value for the TSIdiatom sp. - A. formosa that infers a moderately eutrophic habitat at the Green Cove site (). The moderate value for the TSI diatom sp. - A. formosa for the assemblage at the Green Cove site most likely aligns best with the eutrophic state of the Green Cove site relative to the greater values for the TSIdiatom sp. and TSIdiatoms. This suggestion is supported by: (1) values for the TSIsoft-algal sp. and TSIsoft algae also imply a moderately eutrophic site and (2) conclusions by earlier studies that high concentrations of A. formosa valves among those of benthic taxa may result from a previous A. formosa bloom and may not reflect current trophic state (Pouličková et al. Citation2004; Sivarajah et al. Citation2016).
Table 9. Pearson’s correlation coefficients followed by the significance of probability at the 95 percent confidence level in parentheses for trophic-state indices to concentrations of epilithic chlorophyll a (chl a), chl a of water, total phosphorus (TP) of water, and total nitrogen (TN) of water at reservoir sites.
Trophic-state indices based on soft-algal taxa
Values for the TSIsoft-algal sp. range from 4.9 to 28.5 at mesotrophic sites and from 56.5 to 92.2 at eutrophic sites (). The soft-algal assemblage at the Nickajack site has the greatest difference between values for the TSIsoft-algal sp. (63.8) and TSIsoft algae (48.5; ). The lower value for the TSIsoft algae is due largely to the high percent composition of Oedogonium units not identified to species at the Nickajack site, and thus tallied as Oedogonium species (54.2%, ). Units tallied as Oedogonium species are assigned a moderate trophic-state indicator value (NAWA of the concentration of epilithic chl a = 42.9, Appendix C) which may result from tallying different Oedogonium species with different trophic-state optima as Oedogonium species. This suggestion is consistent with conclusions of NAWQA (2005) who also calculated a moderate trophic-state indicator value for Oedogonium not identified to species at stream sites across the United States. The greater value for the TSIsoft algae sp. relative to the TSIsoft algae for the assemblage at the Nickajack site most likely best represents the trophic state of the site. This suggestion is supported by the greater similarity for the value of the TSIsoft algae sp. for the assemblage at the Nickajack site to the values for the TSIsoft algae and TSIsoft algae sp. of the other assemblages at eutrophic sites ( and ).
Figure 9. Values for the trophic-state index calculated with soft algae identified to species (TSIsoft-algal sp.) at reservoir sites. Abbreviations for sites: Chlihowee (Ch), Norris (No), Tellico (Te), Parksville (Pa), McKamy (Mc), Nickajack (Ni), Swan (Sw), Percy Priest (PP), Green Cove (GC), and Old Hickory (OH).
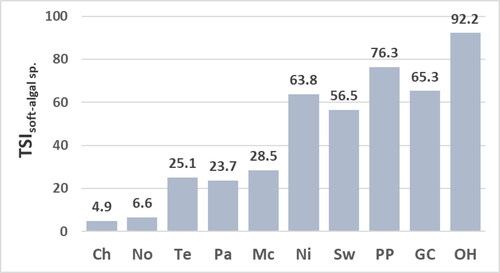
Figure 10. Values for the trophic-state index calculated with calculated with all soft algae identified including those identified to genus only (TSIsoft-algae) at reservoir sites. Abbreviations for sites: Chlihowee (Ch), Norris (No), Tellico (Te), Parksville (Pa), McKamy (Mc), Nickajack (Ni), Swan (Sw), Percy Priest (PP), Green Cove (GC), and Old Hickory (OH).
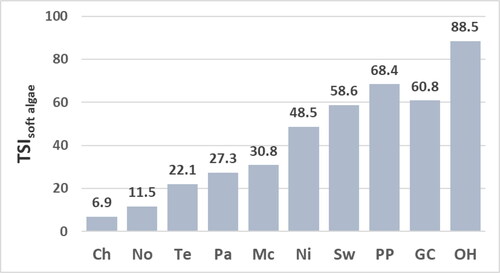
Values for the TSIsoft-algal sp. and TSIsoft algae correlate significantly with concentrations of epilithic chl a and TP, but not to concentrations of chl a of water or TN (). The lack of correlation of the TSIsoft-algal sp. and TSIsoft algae to concentrations of chl a of water is due partially to: (1) very high concentration of chl a of water at the Green Cove site () yet values for TSIsoft-algal sp. and TSIsoft algae that indicate a moderately eutrophic habitat at the Green Cove site ( and ) and (2) the high values for TSIsoft-algal sp. and TSIsoft algae for the soft-algal assemblage at the Old Hickory site ( and ), yet more moderate concentrations of chl a of water at the Old Hickory site (). The lack of correlation of the TSIsoft-algal sp. and TSIsoft algae to concentrations of TN of water is due partially to: (1) very high concentration of TN of water at the Swan site () yet values for TSIsoft-algal sp. and TSIsoft algae that indicate a moderately eutrophic habitat at the Swan site ( and ) and (2) the moderate concentrations of TN of water at the Green Cove site () yet the high values for TSIsoft-algal sp. and TSIsoft algae for the soft-algal assemblage at the Green Cove ( and ).
Discussion
Our study supports conclusions of earlier studies that characteristics of benthic littoral algal assemblages such as their sensitivity to anthropogenic influences (Kravtsova et al. Citation2020) and species richness (Nakov et al. Citation2019) may be ideal to evaluate the impact of eutrophication. The concentration of epilithic chl a of the infralittoral reservoir sites we sampled infers the trophic state of the sites. Algal taxa that may be most influenced by trophic state are indicated by the trophic-state indicator values calculated as the NAWA for the concentration of epilithic chl a.
Estimates of the concentrations of periphytic chl a are a standard protocol to evaluate the trophic state of lotic systems yet are uncommon for lakes and reservoirs (Cantonati and Lowe Citation2014). Reasons for the underuse of benthic chl a to evaluate the trophic state of lentic systems include the potential for shading from phytoplankton in eutrophic lentic systems (Mei et al. Citation2022) and intermittent disturbances by wave energy (Ishida et al. Citation2006). The significant positive correlation of the concentrations of epilithic chl a to concentrations of TP at the infralittoral sites we studied supports the conclusions of other studies that biomass of periphytic algae may correspond to the trophic state of infralittoral sites (King et al. Citation2000; Lambert et al. Citation2008; Vadeboncoeur et al. Citation2008; Oleksy et al. Citation2021).
This study demonstrates the value of including evaluations of the composition of infralittoral algal assemblages to traditional evaluations of water-column characteristics to estimate the integrity of lentic systems. The trophic-state indicator values calculated as the NAWA for the concentrations of epilithic chl a for the diatom and soft-algal taxa we identified infer the relationships between percent composition and trophic state. These data contribute to our knowledge of the impacts of eutrophication on percent composition of algal taxa in the infralittoral zones of freshwater reservoirs in Middle and East Tennessee. More regional studies of algal composition of infralittoral zones are needed to provide baseline data needed to help differentiate between natural characteristics and anthropogenic influences. For example, naturally high concentrations of phosphorus in the limestone of the Nashville Basin results in phosphorus-rich and productive water that influences the composition of algal assemblages (Lebkuecher et al. Citation2018). The naturally high concentrations of phosphorus in the Nashville Basin most likely contributes to the reason that the Percy Priest and Old Hickory reservoir sites have water with the greatest concentrations of TP and algal assemblages with the greatest values for the TSIdiatom sp. - A. formosa, TSIsoft-algal sp., and TSIsoft algae.
Some diatom and soft-algal taxa are considered relatively reliable indicators of habitat characteristics across regions, lentic and lotic systems, and waterbody sizes while others are not (Van Dam et al. Citation1994; Pouličková et al. Citation2004). Besse-Lototskaya et al. (Citation2011) listed 30 diatom taxa that should be considered unreliable cosmopolitan indicators of trophic state because each had trophic-indicator values that range from oligotrophic to eutrophic in different regions of Europe. Some soft-algal considered indicators of eutrophic water in North America are more common in oligotrophic and mesotrophic water in Europe (Porter Citation2008). The United States Geological Survey National Water Quality Assessment (NAWQA) sampled benthic soft algae and water at river sites across the United States and assigned trophic-state indicator values to soft-algal taxa based on the abundance-weighted averages for water concentrations of soluble reactive phosphorus (NAWQA 2005). The trophic-state indicator values of many soft-algal taxa conflicted with those from local assessments. NAWQA (2005) concluded that more studies of the relationships between percent composition of soft-algal taxa to nutrient concentration and other habitat characteristics are needed to evaluate which taxa may be used as cosmopolitan indicators of habitat characteristics.
Nine of the ten diatom taxa that meet the criteria cited by this study to qualify as strong indicators of eutrophic sites are listed as eutraphentic to hypereutraphentic in Netherland freshwaters by Van Dam et al. (Citation1994). The exception, Nitzschia palea var. debilis (Kütz.), is listed as an indicator of eutrophic streams in the United Kingdom (Kelly and Whitton Citation1995) and in the state of Kentucky, United States (KDOW Citation2008). The four diatom taxa identified to species with the greatest percent composition at the five eutrophic sites we sampled () are cited as more abundant in other nutrient-rich habitats. Encyonopsis microcephala (Grun.) Krammer is listed as meso-eutraphentic by Van Dam et al. (Citation1994). Aulacoseira pusilla (Meister) Tuji and Houk is more abundant in eutrophic rivers relative to mesotrophic rivers in the Eastern United States (TANSP Citation2007). Asteroinella formosa is more abundant in temperate eutrophic lentic systems relative to temperate mesotrophic or oligotrophic lentic systems (Saros et al. Citation2005). Cocconeis placentula Ehrenb. is often an epiphyte on large filamentous algae and is often more abundant at eutrophic sites dominated by large filamentous algae (Leland and Porter Citation2000).
The few soft-algal taxa designated as strong indicators of trophic state of infralittoral reservoir sites in Middle and East Tennessee by this study strengthens conclusions of earlier studies that trophic state may not be the most important factor affecting percent composition for many soft-algal species. Stancheva et al. (Citation2012) designated only 7 out of 180 soft-algal taxa as indicators of trophic state in streams of southern California based on abundance-weighted averages of the total phosphorous concentrations of water where the taxa occur. Grimmett and Lebkuecher (Citation2017) designated only 7 of 128 epilithic soft-algal taxa as strong indicators of trophic state in eight Middle Tennessee streams based on abundance-weighted averages of epilithic chl a where the taxa occur. A few soft-algal taxa that are more abundant at the eutrophic infralittoral sites we studied are also more abundant in eutrophic streams. The high trophic-state indicator value we calculated for Cladophora glomerata is consistent with numerous earlier studies. Cladophora glomerata is cited as an indicator of eutrophic lentic and lotic sites in Europe and North America (Mackie Citation2013; Fetscher et al. Citation2014) including stream sites in Middle Tennessee (Grimmett and Lebkuecher Citation2017). The high trophic-indicator value we calculated for the cyanobacterial epiphyte Chamaesiphon amethystinus is consistent with earlier studies. The abundance of Chamaesiphon is often influenced by the abundance of large filamentous host algae that are often more abundant at eutrophic sites (Das Citation2015) including stream sites in Middle Tennessee (Lebkuecher et al. Citation2018). Three of the four soft-algal taxa considered strong indicators of mesotrophic conditions based on the criteria used in this study, Phormidium autumnale, P. retzii, and P. tergestinum, are more abundant at mesotrophic stream sites in middle Tennessee relative to eutrophic sites (Grimmett and Lebkuecher Citation2017). We are unaware of trophic-preference data elsewhere for Leptolyngba truncate, the fourth soft-algal taxa considered a strong indicator of mesotrophic conditions at the sites we sampled.
Biotic indices are used widely to assess ecological condition because organism composition is often a more accurate indicator of habitat quality than chemical characteristics or biomass (Stancheva and Sheath Citation2016). The trophic-state indices we calculated using diatom and soft-algal taxa infer the trophic state of the infralittoral reservoir sites sampled. This result supports conclusions from other studies that composition of periphytic algal assemblages of lentic systems can indicate trophic state (Marchetto and Sforzi Citation2018; Tao et al. Citation2020; Kennedy and Buckley Citation2021). The simplicity of biotic indices calculated as the mean abundance-weighted average of indicator values for taxa present allows researchers to modify the choice of taxa used based on assemblage composition, objectives, and researcher expertise (Marchetto and Sforzi Citation2018). Shin et al. (Citation2022) suggest that greater consistency may be achieved by excluding taxa difficult to identify, the use of dominant taxa only, or use of only taxa known to be strong indictors of habitat quality. Marchetto and Sforzi (Citation2018) suggest that tropic-state indices based on trophic-state indicator values of algal species could also incorporate trophic-state indicator values for some taxa identified only to genus. This is because some genera are apparent indicators of trophic state. The diatom genera Amphora, Cocconeis, and Diatoma are listed as indicators of eutrophic conditions by Van Dam et al. (Citation1994) and are more abundant at the eutrophic sites we studied. The Euglenoid genera Euglena, Phacus, and Trachelomonas are more abundant in eutrophic systems (Palmer Citation1969; Rosowski Citation2003) and these genera occurred only at the most nutrient-impaired sites we sampled. Of course, caution should be applied when using genera as indicators of habitat quality given many genera may include species not yet studied.
Conclusions
The 264 algal taxa we identified at the ten reservoir sites demonstrate the richness of algal assemblages of infralittoral zones in reservoirs of East and Middle Tennessee. Values for the NAWA for the concentrations of epilithic chl a of algal taxa serve as trophic-state indicator values and contribute to our limited knowledge of the effects of eutrophication on infralittoral algal taxa. The trophic-state indices calculated using the trophic-state indicator values are the first to use epilithic concentrations of chl a as opposed to water-column characteristics to indicate trophic-state optima for periphytic algae of lentic systems. The indices are easy to calculate and provide novel tools to help evaluate and monitor the trophic state of infralittoral zones in reservoirs of Middle and East Tennessee.
Author contributions
Dr. Jefferson G. Lebkuecher collected the samples, analyzed most of the data, and wrote the manuscript. Jenna L. Atma, Hailey Conn, and Daniel Redwine helped analyze the data.
Acknowledgements
We thank Dr. Jennifer Greenwood, Dr. John Schwartz, and three anonymous reviewers for offering suggestions that improved the manuscript.
Disclosure statement
No potential conflict of interest was reported by the authors.
Additional information
Funding
References
- Anagnostidis K, Komárek J. 1988. Modern approach to the classification system of cyanophytes 3 - Oscillatoriales. Arch Hydrobiol Suppl. 80:327–472.
- Anonymous. 1975. Proposals for a standardization of diatom terminology and diagnosis. Nova Hedwig Beih. 53:323–354.
- Baird RB, Eaton AD, Rice EW. 2017. Standard methods for the examination of water and wastewater. 23rd ed. Washington (DC): American Public Health Association.
- Besse-Lototskaya A, Verdonschot PFM, Coste M, de Vijver BV. 2011. Evaluation of European diatom trophic indices. Ecol Indic. 11:456–467.
- Cantonati M, Lowe RL. 2014. Lake benthic algae: toward an understanding of their ecology. Freshwater Sci. 33(2):475–486.
- Carlton RG, Wetzel RG. 1988. Phosphorus flux from lake sediments: effects of epipelic algal oxygen production. Limnol Oceanog. 33:562–570.
- Carr JM, Hergenrader JL, Troelstrup NH. Jr. 1986. A simple, inexpensive method for cleaning diatoms. Trans Am Microsc Soc. 105:152–157.
- Cox JP. 1984. Evaluating reservoir trophic status: the TVA approach. Lake Reserv Manage. 1:11–16.
- Das KS. 2015. Taxonomic study of the genus Chamaesiphon (Chroococcales: cyanoprokaryota) reported from India with two new distributional records. Feddes Repertorium. 126:22–30.
- DeNicola DM, de Eyto E, Wemaere A, Irvine K. 2004. Using epilithic algal communities to assess trophic status in Irish lakes. J Phycol. 40:481–495.
- Dillard GE. 1989a. Freshwater algae of the Southeastern United States. Part 1. Chlorophyceae: volvocales, Testrasporales, and Chlorococcales. Bibliotheca Phycologia series volume 81. Berlin, Germany: J. Cramer; 284 p.
- Dillard GE. 1989b. Freshwater algae of the Southeastern United States. Part 2. Chlorophyceae: ulotrichales, Microsporales, Cylindrocapsales, Sphaeropleales, Chaetophorales, Cladophorales, Schizogoniales, Siphonales, and Oedogoniales. Bibliotheca Phycologica series volume 83. Berlin, Germany: J. Cramer; 163 p.
- Dillard GE. 1990. Freshwater algae of the Southeastern United States. Part 3. Chlorophyceae: zygnematales: zygenmataceae, Mesotaeniaceae, and Desmidaceae (Section 1). Bibliotheca Phycologica series volume 85. Berlin, Germany: J. Cramer; 172 p.
- Dillard GE. 1991a. Freshwater algae of the Southeastern United States. Part 4. Chlorophyceae: zygnemateles: desmidaceae (Section 2). Bibliotheca Phycologica Vol. 89. Berlin, Germany: J. Cramer; 205 p.
- Dillard GE. 1991b. Freshwater algae of the Southeastern United States. Part 5. Chlorophyceae, Zygnemateles: desmidaceae (Section 2). Bibliotheca Phycologica Vol. 90. Berlin, Germany: J. Cramer; 155 p.
- Dillard GE. 1993. Freshwater algae of the Southeastern United States. Part 6. Chlorophyceae: zygnematales: desmidiacae (Section 4) Bibliotheca Phycologica series volume 93. Berlin, Germany: J. Cramer; 166 p.
- Dillard GE. 2000. Freshwater algae of the Southeastern United States. Part 7. Pigmented Euglenophyceae. Bibliotheca Phycologia series volume 106. Berlin, Germany: J. Cramer; 176 p.
- Dillard GE. 2007. Freshwater algae of the Southeastern United States. Part 8. Chrysophyceae, Xanthophyceae, Raphidophyceae, Cryptophyceae and Dinophyceae. Bibliotheca Phycologia series volume 112. Berlin, Germany: J. Cramer; 127 p.
- Eloranta P, Kwandrans J, Kusel-Fetzmann E. 2011. Rhodophyta and Phaeophyceae. In: Büdel B, Gärtner G, Krienitz L, Preisig HR, Schagerl M, editors. Süßwasserflora von Mitteleuropa. Vol. 7. Berlin, Germany: Springer Specktrum.
- Fetscher AE, Stancheva RS, Kociolek JP, Sheath RG, Stein ED, Mazor RD, Ode PR. 2014. Development and comparisons of stream indices of biotic integrity using diatoms vs. non diatom algae vs. a combination. J Appl Phycol. 26(1):433–450.
- Graham LE, Graham JM, Wilcox LW, Cook ME. 2016. Algae. 3rd ed. Upper Saddle River (NJ): Pearson Prentice Hall; 640 p.
- Griffith GE, Omernik JM, Azevedo SH. 1997. Ecoregions of Tennessee. EPA/600/R97/022. Corvallis (OR): NHREEL. U. S. Environ. Protection Agency, Western Ecological Division.
- Grimmett MR, Lebkuecher JG. 2017. Composition of algae assemblages in middle Tennessee streams and correlations of composition to trophic state. J Freshwater Ecol. 32:363–389.
- Ishida N, Mitamura O, Nakayama M. 2006. Seasonal variation in biomass and photosynthetic activity of epilithic algae on a rock at the upper littoral area in the north basin of Lake Biwa, Japan. Limnology. 7:175–183.
- John DM, Whitton BM, Brook AJ. 2011. The freshwater algal flora of the British Isles. An identification guide to freshwater and terrestrial algae. 2nd ed. Cambridge (UK): Cambridge University Press; 878 p.
- Kahlert M, Kelly M, Albert RL, Almeida SFP, Bešta T, Blanco S, Coste M, Denys L, Ector L, Fránková M, et al. 2012. Identification versus counting protocols as sources of uncertainty in diatom-based ecological status assessments. Hydrobiologia. 695:109–124.
- Kasprzak P, Padisák J, Koschel R, Krienitz L, Gervais F. 2008. Chlorophyll a concentration across a trophic gradient of lakes: an estimator of phytoplankton biomass? Limnologica. 38:327–338.
- Kelly MG, Whitton BA. 1995. The trophic diatom index: a new index for monitoring eutrophication in rivers. J Appl Phycol. 7:433–444.
- Kennedy B, Buckley YM. 2021. Use of seasonal epilithic diatom assemblages to evaluate ecological status in Irish lakes. Ecol Indic. 129:107853.
- Kentucky Division of Water (KDOW). 2008. Methods for assessing biological integrity of surface waters in Kentucky. Frankfort (KY): Department for Environmental Protection, Division of Water. http://water.ky.gov/Pages/SurfaceWaterSOP.aspx.
- King L, Barker P, Jones R. 2000. Epilithic algal communities and their relationship to environmental variables in lakes of the English Lake District. Freshwater Biol. 45:425–442.
- KomáRek J, Anagnostidis K. 2008a. Cyanoprokaryota Part 1: chroococcales. In: Ettl H, Gerloff J, Heynig H, Mollenhauer D, editors. Süßwasserflora von Mitteleuropa. Vol. 19/1. Berlin, Germany: Springer Spectum.
- Komárek J, Anagnostidis K. 2008b. Cyanoprokaryota Part 2: oscillatoriales. In Büdel B, Gärtner G, Krienitz L, Schagerl M, editors. Süßwasserflora von Mitteleuropa. Vol. 19/2. Berlin, Germany: Springer Spektrum.
- Komárek J. 2013. Cyanoprokaryota Part 3: heterocytous Genera. In: Büdel B, Gärtner G, Krienitz L, Schagerl M, editors. Süßwasserflora von Mitteleuropa. Vol. 19/3. Berlin, Germany: Springer Spektrum.
- Krammer K, Lange-Bertalot H. 1986. Bacillariophyceae. 1. Teil: naviculaceae. In: Ettl H, Gerloff, J, Heynig H, Mollenhauer D, editors. Süsswasserflora von Mitteleuropa, Band 2/1. Jena, Stuttgart, Germany: Gustav Fischer Verlag; p. 876.
- Krammer K, Lange-Bertalot H. 1988. Bacillariophyceae. 2. Teil: bacillariaceae, Epithemiaceae, Surirellaceae. In: Ettl H, Gerloff J, Heynig H, Mollenhauer D, editors. Süsswasserflora von Mitteleuropa, Band 2/2. Jena, Stuttgart, Germany: VEB Gustav Fischer Verlag; 596 pp.
- Krammer K, Lange-Bertalot H. 1991a. Bacillariophyceae. 3. Teil: centrales, Fragilariaceae, Eunotiaceae. In: Ettl, H, Gerloff J, Heynig H, Mollenhauer D, editors. Süsswasserflora von Mitteleuropa, Band 2/3. Jena, Stuttgart, Germany: Gustav Fischer Verlag; p. 576.
- Krammer K, Lange-Bertalot H. 1991b. Bacillariophyceae. 4. Teil: achnanthaceae, Kritische Ergänzungen zu Navicula (Lineolatae) und Gomphonema, Gesamtliteraturverzeichnis Teil 1–4. In: Ettl H, Gärtner G, Gerloff J, Heynig H, Mollenhauer D, ediors. Süsswasserflora von Mitteleuropa, Band 2/4. Jena, Stuttgart, Germany: Gustav Fischer Verlag; p. 437.
- Kravtsova LS, Mizandrontsey IB, Vorobyova SS, Izhboldina LA, Mincheva EV, Poyyomkina TG, Golbokova LP, Sakirko MV, Triboy TI, Khanaev IV, et al. 2020. Influence of water motion on the special distribution of Spirogyra in Lake Baikal. J Great Lakes Res. 46:29–40.
- Lambert D, Cattaneo A, Carignan R. 2008. Periphyton as an early indicator of perturbation in recreational lakes. Can J Fish Aquat Sci. 65:258–265.
- Lebkuecher JG, Bojic S, Breeden CA, Childs SL, Evans MC, Hauskins BS, Irick ZA, Kraft JC, Krausfeldt JM, Santoyo NI. 2018. Photoautotrophic periphyton composition in reaches with differing nutrient concentrations in the Harpeth River of Middle Tennessee. Castanea. 83(2):288–299.
- Lebkuecher JG, Mauney M. 2020. Comparison of algal assemblages in response to eutrophication of a stream by a wastewater treatment plant. Castanea. 85:122–138.
- Lebkuecher JG, Rainey SM, Williams CB, Hall AJ. 2011. Impacts of nonpoint-source pollution on the structure of diatom assemblages, whole-stream oxygen metabolism, and growth of Selenastrum capricornutum in the Red River Watershed of North-Central Tennessee. Castanea. 76(3):279–292.
- Lebkuecher JG, Tuttle EN, Johnson JL, Willis NKS. 2015. Use of algae to assess the trophic state of a stream in Middle Tennessee. J Freshwater Ecol. 30(3):346–379.
- Leland HV, Porter SV. 2000. Distribution of benthic algae in the upper Illinois River basin in relation to geology and land use. Freshwater Biol. 44:279–301.
- Mackie GL. 2013. Applied aquatic ecosystem concepts. Dubuque (IA): Kendall Hunt.
- Marchetto A, Sforzi T. 2018. Using benthic diatoms for estimating lake ecological quality: comparing different taxonomic resolution. Adv Limnol Oceanogr. 9:1–9.
- Mei X, Gao S, Liu Y, Hu J, Razlustkij V, Rudstam LG, Jeppesen E, Liu Z, Zhang X. 2022. Effects of elevated temperature on resource competition of nutrient and light between benthic and planktonic algae. Front Environ Sci. 10:908088.
- Nakov T, Beaulieu JM, Alverson AJ. 2019. Diatoms diversity and turn over faster in freshwater than marine environments. Evolution. 73(12):2497–2511.
- National Water-Quality Assessment (NAWQA). 2005. Relationships of soft-bodied algae to water-quality and habitat characteristics in U.S. rivers: analysis of the National Water Quality Assessment (NAWQA) program data set. Philadelphia (PA): The Academy of Natural Science, Patrick Center for Environmental Research, Phycology section. (Report No. 05-08).
- Oleksy IA, Baron JS, Whitney SB. 2021. Nutrients and warming alter mountain lake benthic algal structure and function. Freshwater Sci. 40(1):88–102.
- Palmer CM. 1969. A composite rating of algae tolerating organic pollution. J Phycol. 5(1):78–82.
- Patrick R, Reimer CW. 1966. The diatoms of the United States. Volume 1. Monogr Acad Nat Sci Philadelphia. 13(1):1–688.
- Patrick R, Reimer CW. 1975. The diatoms of the United States. Volume 2. Monogr Acad Nat Sci Philadelphia. 13(2):1–213.
- Paul MJ. 2017. Algal indicators in streams: a review of their application in water quality management of nutrient pollution. Washington (DC): United States Environmental Protection Agency.
- Poikane S, Portielje R, van den Berg M, Phillips G, Brucet S, Carvalho L, Mischke U, Ott I, Soszka H, Van Wichelen J. 2014. Defining ecologically relevant water quality targets for lakes in Europe. J Appl Ecol. 51(3):592–602.
- Ponader KC, Potapova MG. 2007. Diatoms from the genus Achnanthidium in flowing waters of the Appalachian Mountains (North America): Ecology, distribution and taxonomic status. Limnologica. 37:227–241.
- Porter SD. 2008. Algal attributes: an autecological classification of algal taxa collected by the National Water-Quality Assessment Program. Reston (VA): US Geological Survey Data Series 329. Available from: http://pubs.usgs.gov/ds/ds329/.
- Pouličková A, Duchoslav M, Dokulil M. 2004. Littoral diatom assemblages as bioindicators of lake trophic status: a case study from perialpine lakes in Australia. Eur J Phycol. 39:143–152.
- Prescott GW. 1982. Algae of the western Great Lakes area. Koenigstein (Germany): Otto Koeltz Science Publishers.
- Ren W, Tao Y, Zhang Z, Cao Y, Yuan C, Wang H, Chou QC, Ni L, Zhang X, Cao T. 2021. Changes of periphyton abundance and biomass driven by factors specific to flooding inflow in a river inlet area in Erhai Lake, China. Front Environ Sci. 9:1–10.
- Rimet F, Feret L, Bouchez A, Dorioz J-M. 2019. Factors influencing the heterogeneity of benthic diatom communities along the shoreline of natural alpine lakes. Hydrobiologia. 839:103–1198.
- Rosowski JR. 2003. Phtotosynthetic euglenoids. In: Wehr JD, Sheath RG, ediors. Freshwater algae of North America. Ecology and classification. Burlington (MA): Academic Press. 918 p.
- Saros JE, Michel TJ, Interlandi SJ, Wolfw AP. 2005. Resource requirements of Asterionella formosa and Fragillaria crotonensis in oligotrophic alpine lakes: implications for recent phytoplankton community reorganizations. Can J Fish Aquat Sci. 62:1681–1689.
- Schneider S, Kahlert M, Kelly MG. 2013. Interactions between pH and nutrients on benthic algae in streams and consequences for ecological status assessment and species richness patterns. Sci Total Environ. 444:73–84.
- Schneider S, Lindstrøm EA. 2011. The periphyton index of trophic status PIT: a new eutrophication metric based on non-diatomaceous benthic algae in Nordic rivers. Hydrobiologia. 665:143–155.
- Schoen S. 1988. Cell counting. In: Lobban, CS, Chapman, DJ, Kremer, BP, editors. Experimental phycology. A laboratory manual. Cambridge (MA): Cambridge University Press; p. 16–22.
- Shannon CE, Weaver W. 1949. The mathematical theory of communication. Urbana: University of Illinois Press.
- Shin Y, Kim D, Heo T-Y. 2022. Determination of habitat preferences of dominant epilithic diatoms using statistical models: a case study in the Han River, South Korea. Water. 14:956.
- Sivarajah B, Ruhland KM, Labaj AL, Paterson AM, Smol JP. 2016. Why is the relative abundance of Asterionella formosa increasing in a boreal shield lake as nutrient levels decline? J Paleolimnol. 55:357–367.
- Soinen J, Weckström J. 2009. Diatom community structure along environmental and special gradients in lakes and streams. Fundam Appl Limnol. 174:205–213.
- Sokal RR, Rohlf JF. 2011. Biometry. 4th ed. New York (NY): WH Freeman and Company.
- Soria JM, Soria-Perpinya’ X, Montagud D, Cabrera MDS. 2019. Phytoplankton reservoir trophic index (PRTI): new tool for ecological quality. Inland Waters. 9:301–308.
- Spaulding SA, Bishop IW, Edlund MB, Lee S, Furey P, Jovanovska E, Potapova M. 2021. Diatoms of North America.
- Špoljar M, Zhang C, Dražina T, Zhao G, Lajtner J, Radonić G. 2017. Development of submerged macrophyte and epiphyton in a flow-through system: assessment and modelling predictions in interconnected reservoirs. Ecol Indic. 75:145–154.
- Stancheva R, Fetcher AE, Sheath RG. 2012. A novel quantification method for stream- inhabiting, non-diatom epilithic algae, and its application in bioassessment. Hydrobiol. 684:225–239.
- Stancheva R, Sheath RG. 2016. Benthic soft-bodied algae as bioindicators of stream water quality. Knowl Manage Aquat Ecosyst. 414:1–16.
- Tao W, Qing W, Shaung X, Chunlan Y, Guofeng P. 2020. Response of benthic algae to environmental conditions in an urban lake recovered from eutrophication. China J Oceanol Limnol. 38(1):93–101.
- Tennessee Department of Environment and Conservation (TDEC). 2022. Safe dams program. Available from: https://www.tn.gov/environment/program-areas/wr-water-resources/water-quality/safe- dams-program.html.
- The Academy of Natural Sciences of Philadelphia (TANSP). 2007. Representatives of the genus Aulacoseira thwaites in NAWQA samples. Eighteenth NAWQA Workshop on Harmonization of Algal Taxonomy. Report No. 08-07. Philadelphia (PA): The Academy of Natural Sciences of Philadelphia. Available from: https://diatom.ansp.org/nawqa/pdfs/18th_NAWQA_Workshop_Revised.pdf.
- Tolonen KT, Karjalainen J, Hämämäinen H, Nyholm K, Rahkola-Sorsa M, Cai Y, Heino Y. 2020. Do the ecological drivers of lake littoral communities match and lead to congruence between organism groups? Aquat Ecol. 54:839–854.
- United States Geological Survey (USGS). 2018. Lakes and reservoirs - guidelines for study design and sampling: U.S. Geological Survey techniques and methods, book 9, Chapter A10, 48 p.
- Vadeboncoeur Y, Peterson G, Vander Zanden MJ, Kalff J. 2008. Benthic algal production across lake size gradients: interactions among morphometry, nutrients, and light. Ecology. 89(9):2542–2552.
- Van Dam H, Mertens A, Sinkeldam J. 1994. A coded checklist and ecological indicator values of freshwater diatoms from The Netherlands. Neth J Aquat Ecol. 28:117–133.
- Wetzel RG. 2001. Limnology-lake and river ecosystems. 3rd ed. New York (NY): Springer, 429 p.
- Whitford LA, Schumacher GJ. 1984. A manual of fresh-water algae. Raleigh (NC): Sparks Press.
- Whitlock MC, Schluter D. 2020. The analysis of biological data. 3rd ed. New York (NY): Macmillan Learning.
- Whittaker RH, Fairbanks CW. 1958. A study of plankton copepod communities in the Columbia Basin, Southeastern Washington. Ecology. 39:46–65.
- Whitton BA. 2012. Use of benthic algae and bryophytes for monitoring rivers. J Ecol Environ. 36:95–100.
- Woelkerling WJ, Kowal RR, Gough SB. 1976. Sedgwick-rafter cell counts: a procedural analysis. Hydrobiol. 48:95–107.
Appendix A:
Reservoir names, impounded Rivers or streams that form the reservoirs, reservoir sizes, ecoregions and ecoregion numbers in parentheses where reservoirs located, and locations of sampling sites
Appendix B:
Percent composition of diatom taxa listed in alphabetical order and normalized abundance-weighted averages (NAWA) of the concentration of epilithic chlorophyll a ([chl a]) for diatom taxa at reservoir sites sampled
Appendix C:
Percent composition of soft-algal taxa listed in alphabetical order by phylum at reservoir sites sampled and normalized abundance-weighted averages (NAWA) of the concentration of epilithic chlorophyll a ([chl a]) for soft-algal taxa at reservoir sites sampled