
Abstract
Human noroviruses (HNVs) are one of the major causes of food poisoning and severe gastroenteritis. However, prevention and medical treatment of HNV disease is underdeveloped due to the lack of ecological understanding of the HNVs including their host organisms. We address the potential source animals of HNVs based on the environmental DNA metabarcoding analysis. By focusing on the HNV-epidemic area in Japan, we found several bird species of ducks, pochards, carrion crow, and swan showing significant cross-correlation with the HNV detection from cultured oysters. Humans and livestock mammals do not exhibit correlation with HNVs. These results suggest an avian-sourced, non-human- or sewage-mediated model of HNV infection. Unraveling the unknown host animals of pathogens like HNV facilitates artificial propagation of the pathogen, leading to vaccine and small molecule drug development.
Keywords:
Introduction
Human noroviruses (HNVs) are one of the major pathogens of food poisoning. They cause about 16–22% gastroenteritis cases worldwide (Liao et al. Citation2021). The HNV infection is frequently attributed to shellfish seafood, including oysters (Bellou et al. Citation2013). Thus, HNVs are a significant problem for public health and for economies related to restaurant service and tourism industry.
Despite this, our understanding and preventive strategy of HNV infection are currently incomplete. This is due to a limited biological knowledge of the HNVs mainly owing to the inability to propagate them stably and massively in cultured cells of humans and mammals, despite multiple efforts (Duizer et al. Citation2004; Hosmillo et al. Citation2020). Therefore, performing basic research of the HNVs is difficult, resulting in a paucity of vaccines and molecularly targeted drugs against them (Tan Citation2021).
Another problem is that the host organisms of HNVs are not well known. The HNVs accumulating in marine bivalves of coastal area were thought to be from sewage water () (Mathijs et al. Citation2021). However, the sewage is well-treated using sludge incineration in the developed countries, particularly where the oysters are cultured, such as USA., France, and Japan. The burning of sludge powerfully inactivates and degrades virus pathogens () (Ducoli et al. Citation2021). A study from Finland showed that human fecal indicator microbes were not correlated with HNV detection in coastal river water (Hörman et al. Citation2004). It is possible that sewage water is not a main and stable source of HNVs of coastal area in the present developed countries.
Figure 1. Two distinct models of the infection cycle of human noroviruses examined in this study. (A) Human-origin model of food poisoning of marine bivalves by noroviruses. The infection is sourced from insufficiently treated sewage water. (B) Animal-sourced model of norovirus in marine bivalves. The sewage sludge is well-treated using incineration, particularly in current developed countries. The norovirus is persistently provided by unknown animal activities that occur cyclically or seasonally.
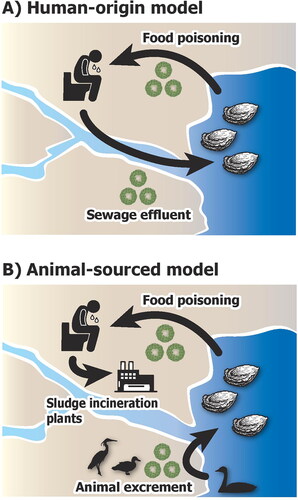
Inability to propagate HNVs due to their instability in human and mammalian cultured cells (Duizer et al. Citation2004) suggests that terrestrial mammals are not the primary hosts of HNVs. In oysters, HNVs do not colonize permanently (Campos and Lees Citation2014; Hassard et al. Citation2017). The oysters exposed to HNVs accumulate and concentrate virus particles in gills and digestive glands when the sea water temperature is low at winter. The HNVs reach about 100 times higher concentration in oysters than in sea water and persist for up to four weeks (Campos and Lees Citation2014; Hassard et al. Citation2017). When the water temperature is high (e.g. 17 °C), HNVs are quickly removed from oysters (e.g. within six days) (Campos and Lees Citation2014). These observations suggest that unknown host species exist as constant source of HNVs other than human, mammal, and marine bivalves () (Villabruna et al. Citation2019; Ludwig-Begall et al. Citation2021).
Here we explore the unknown host animals of HNVs that appear in epidemic season of HNVs using environmental DNA (eDNA) metabarcoding analysis (Thomsen and Willerslev Citation2015; Sato et al. Citation2018). Because the eDNA metabarcoding provides exhaustive analysis of animal fauna of the target environment, the correlation between detected animals and HNVs may enable us to address the unknown host animals of the HNVs based on animal-sourced model of HNVs (). We focused on Matsushima (MS) Coast of Miyagi Prefecture, a representative area of oyster culturing in Japan. In this region, sewage sludge is well-treated using incineration since 2004, although the HNV infections from oysters are reported every year. The cultured oysters are examined weekly using reverse transcription-polymerase chain reaction (RT-PCR) assay by local fisheries cooperative associations at coast-wide scale of the prefecture. Based on this temporal test data, we analyzed possible association between HNV detection and animal species appearance in coastal eDNA. Using the eDNA method of analyzing massive numbers of DNA sequences from sea water filtrates, we aim to unravel the animal that show significant correlation with the detection of HNVs.
Materials and methods
Sea water sampling
Water samples were taken from a wharf in the coastal area of Matsushima City, Miyagi Prefecture, Japan (38.371278 N 141.071028 E), close to the representative area of oyster cultivation in northern Japan. The sampling was conducted weekly from 15 November 2017 to 28 February 2018 to cover the seasonal epidemics of human norovirus in this area. Surface sea water was manually collected by wearing disposable gloves, using a clean plastic bucket. Approximately 1,000 mL of the water was filtered using the Sterivex filter with 0.45 µm pore size membrane (Merck Millipore, Milan, Italy) and a 50 mL disposable syringe (Terumo, Tokyo, Japan). After filtration, the filter unit was filled with 2 mL of DNAiso Reagent (Takara, Shiga, Japan) to preserve eDNAs and tightly sealed using polypropylene luer-fitting caps (ISIS, Osaka, Japan). These units were kept at −30 °C until DNA extraction was carried out.
Environmental DNA extraction
Total DNA was extracted from preserved filter units using the DNeasy PowerWater Sterivex Kit (Qiagen, Hilden, Germany) according to the manufacturer’s protocol with a slight modification as follows. Before DNA extraction, the units were placed at room temperature to dissolve the DNAiso reagent that was subsequently removed using a 10 mL disposable syringe (Becton, Dickinson and Company). After adding warmed MBL solution, the units were incubated at 65 °C on a heat block for 10 min to efficiently lyse the cells and proteins in the filtered residues. In the final DNA elution, an ultra-clean 25 µL of microbial DNA-free water (Qiagen) was used to avoid the unexpected contamination from common reagents, obtaining a total of 50 µL eDNA solution from each unit after two elution steps. The eDNA was stored at −30 °C after verification of its concentration and quality (OD260/280 >1.80) using a Nanodrop 2000c Spectrophotometer (Thermo Fisher Scientific).
PCR amplification and sequencing
Using a two-step tailed PCR method, we amplified and sequenced partial fragments of the mitochondrial (mt) 12S rRNA genes of broad vertebrate animals from the prepared eDNA as previously described (Sato et al. Citation2019; Gamage et al. Citation2020). In the first step, known PCR primers targeting vertebrate mt-12S rRNA (Miya et al. Citation2015) were used along with additional sequencing priming sites and random hexamer to improve the basecall calibration of the MiSeq (Illumina, San Diego, CA, USA). The final concentration of primers and the typical length of targeted mt-12S rRNA partial region were 0.30 μM and 169 bp, respectively. For each eDNA sample, four types of PCR conditions were applied using two PCR enzyme systems with two different annealing temperatures: HiFi HotStart ReadyMix (KAPA Biosystems, Wilmington, MA USA) and PrimeSTAR HS DNA polymerase (Takara) at annealing temperatures of 60 and 65 °C and 50 and 55 °C, respectively. These PCRs were conducted twice for each sample, generating eight PCR products per sample. The thermal cycle profiles were the same as previously described (Sato et al. Citation2019). The PCR products were diluted into RNase-free water (Thermo Fisher Scientific) to 20-fold and subjected to 2nd-round PCR to add the dual-index tags and MiSeq flow cell-binding sites (Illumina) using Ex Taq Hot Start Version (Takara) (Sato et al. Citation2019).
The tag-indexed 2nd-round PCR products were sequenced using MiSeq (Illumina). The 2nd-round PCR products with unique combinations of dual indices were pooled in equal amount in volume basis (3 μL for each sample) for semi-quantitative purpose. The pooled PCR product was purified using 1.0% L03 agarose gel (Takara) and a MinElute Gel Extraction Kit (Qiagen) under a standard protocol. The eluted DNA solution was further purified and concentrated using AMPure XP magnetic beads (Beckman Coulter) with a standard purification protocol. The obtained sequencing library was quantified using the Qubit 3.0 with the dsDNA HS Assay Kit (Thermo Fisher Scientific). The prepared 20 pM library was sequenced using the MiSeq Reagent Kit v2 300 Cycles Kit (Illumina) for 151 bp paired-end sequencing. The volume molarity of the libraries was estimated based on the average molecular weight of a DNA nucleotide (660 g per 1 bp), the quantified library concentration, and the typical length (365 bp) of the prepared library.
Sequencing data analysis
Obtained sequence data was filtered based on the nucleotide quality scores and sequence length. The low-quality 3′-tail nucleotides of each sequence (>10−1 error rate) were removed using the program DynamicTrim of the SolexaQA software package (Cox et al. Citation2010). The tail-trimmed paired-end sequences were connected using FLASH (Magoč and Salzberg Citation2011) and filtered using custom Perl scripts (available at https://doi.org/10.5061/dryad.54v2q) (Miya et al. Citation2015) to exclude sequences containing base-call failures (N bases) and showing atypical length compared to the expected size described above (within ± 25 bp in range). Primer sequences were removed using TagCleaner (Schmieder et al. Citation2010) with a maximum five-base mismatch. Sequences without primers at either end were discarded. The ≥2 count identical sequences within each sample were merged into a dereplicated sequence while keeping its count information in its sequence name using UCLUST (derep_fulllength command) (Edgar Citation2010). Finally, the singleton sequences in each sample were aligned with ≥2 count sequences at ≥99% sequence similarity to absorb PCR and sequencing errors. The number of aligned singletons was added to the count information of the matched sequence, and unaligned ones were discarded at this step.
The quality-filtered sequences were analyzed to estimate their taxonomic origin based on sequence similarity analysis to known reference sequences using the National Center for Biotechnology Information (NCBI) BLAST plus program (Camacho et al. Citation2009). The MitoFish (Iwasaki et al. Citation2013; Sato et al. Citation2018; Zhu et al. Citation2023) and NCBI nucleotide (nt) (Sayers et al. Citation2022) was used as a reference database. The Blastn-based species annotation was performed at the sequence similarity and e-value thresholds of 90% and 10−5, respectively. These provisional annotations according to the Blast top-hit results were confirmed or corrected based on the molecular phylogenetic analysis for avian species as described in the subsection ‘Phylogenetic analysis’ below. Species annotations of tetrapod species were adopted from the Blast top-hit results, as the completeness of the mtDNA database was generally higher in tetrapods and their diversity of species detected was limited compared to avians.
Phylogenetic analysis
Taxonomic annotation of the mt-12S rRNA sequences of avian determined from eDNA was corrected and/or confirmed based on the molecular phylogenetic analysis. The reference mt-12S rRNA gene sequences of genus Anas, Answer, Aythya, Corvus, Cygnus, Fulica, Gallus, Larus, Mergus, Nycticorax, and Tachybaptus were obtained from the NCBI nucleotide database. These reference sequences and the present eDNA-derived sequences were aligned using MAFFT version 7.310 (Katoh and Standley Citation2013) and analyzed using the neighbor-joining (NJ) method (Saitou and Nei Citation1987) based on the Kimura’s two-parameter model of nucleotide substitution (Kimura Citation1980) using MEGA X version 10.2.5 (Kumar et al. Citation2018). The support values for the nodes of the tree were evaluated using 1,000 replications of bootstrapping analysis. We considered that ≥50% of bootstrap support was reliable and indicated it on the nodes of the trees. In the preliminary analysis, the maximum-likelihood (ML) phylogenetic analysis was also conducted for the same data set. The resultant phylogenetic tree, however, was better resolved in the NJ than in ML method, probably because the present data with eDNA-derived sequences contains relatively higher number of closely related species and sequences with fewer number of saturated nucleotide sites. Accordingly, we adapted the NJ method for the present phylogenetic analysis.
Statistical analysis
The possible association between the detection of norovirus and vertebrate species was evaluated based on cross-correlation metrics allowing time lags between the signals. The explanatory variable was the absolute number of sequence count of each animal species, or relative number of sequence count normalized as counts per million (CPM) of each animal species, or the presence or absence (0/1 data) of each animal species. The dependent variable was the number of norovirus-positive immune assays from oyster samples along the coast of Matsushima City or Miyagi Prefecture (Table S1). The sequence counts of each species from eight separate PCRs with different PCR enzymes, annealing temperatures, and replicates were summed for each sample after confirming that the detection pattern of species showed significant correlation among same samples and higher correlation coefficient in average than that among the different samples. False discovery rate (FDR) was estimated and evaluated as q value based on the Benjamini-Hochberg (BH) method. The cross-correlation and partial cross-correlation scores were estimated using an R script ‘corr.lag.partial’ developed on the R platform version 4.4.2 (R Core Team Citation2022) and the software PAST version 4.06b (Hammer et al. Citation2001). The data regarding rainfall amount (mm) and weather (sunny, cloudy, or rainy) during November 2017 to March 2018 was taken from the website of the Japan Meteorological Agency (http://www.data.jma.go.jp/obd/stats/etrn/index.php). The data of Ishinomaki City, Miyagi Prefecture where was closer to the coastal area was adopted.
Results
Environmental DNA detection of animals from sea water and HNV detection pattern by certificated hygiene laboratory
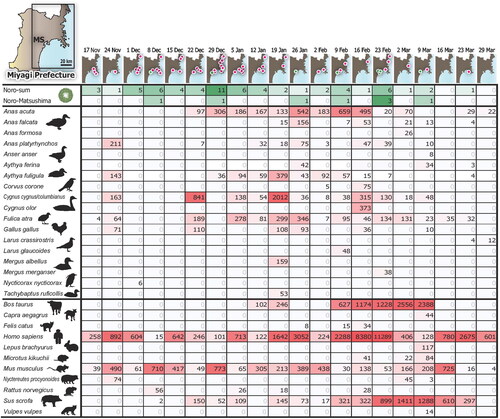
presents the temporal pattern of RT-PCR detection of HNVs from oysters and the eDNA detection of animal species from Matsushima Bay sea water. The analysis was conducted from November 2017 to March 2018 covering an epidemic season of HNVs of the area. The number of HNV RT-PCR assays varied between 29–60 lots/places per day (Table S1). Sequence numbers of animal eDNA analyzed using next generation DNA sequencer also varied by date, ranging from 5,082–119,136 with an average of 32,647 ± 7,256 (mean ± S.D.) (DDBJ Sequence Read Archive accession number: DRA014474). Effective sequences are from 18 bird, 11 mammal, 89 teleost fish, one salamander, and two invertebrate species (Table S2). Almost all reads are from the first three animal classes and those from birds and mammals are shown in . Because no poikilotherm animals including fish have reported to share zoonotic viral pathogens with humans (Boylan Citation2011; Woolhouse et al. Citation2012; Bondad-Reantaso et al. Citation2020), we excluded teleost fish, a salamander, and invertebrates from the downstream correlation analysis with HNV detection.
Figure 2. Detection of human norovirus and animal environmental DNA during the time course of norovirus epidemic season in the Miyagi Prefecture. Maps in the upper part of the figure depict the coastal area of the Miyagi Prefecture, Japan. Green and magenta dots indicate the RT-PCR-based detection of human norovirus (HNV) from cultured oysters of Matsushima Bay (MS) and other points, respectively. The upper 1st and 2nd rows present the number of HNV-positive assayed samples in all regions (green and magenta dots) and MS (green dots), respectively. Table S1 provides the details. Remaining rows show animal species detected from environmental DNA and their sequence counts from the MS. Figure S1 depicts the phylogenetic tree of avian used for correction of the species annotation. Columns correspond to the date analyzed at approximately one-week intervals. Green and magenta shading indicate the levels of detection strength.
Correlation between HNV and bird/mammal eDNA detection
Several bird and one mammalian species exhibited significantly consistent cycle of detection with that of HNVs ( and ). Among the 18 birds detected (), northern pintail (Anas acuta), falcated duck (A. falcata), common and tufted pochards (Aythya ferina and A. fuligula), carrion crow (Corvus corone), and common swan (or tundra swan) (Cygnus cygnus/columbianus) exhibited a statistical match with HNVs in their temporal pattern of detection based on the cross-correlation analysis where some delay was allowed between signal cycles (; cross correlation scores 0.700–0.929, estimated lags 1–5 weeks, p values <0.00001–0.00255, BH-corrected FDR q < 0.01). HNVs were detected from oysters about a week and a month later than the eDNA detection from crows and other five birds, respectively.
Table 1. Cross-correlation between detection cycle of animals based on absolute sequence numbers of environmental DNA metabarcoding and that of human norovirus from cultured oysters using RT-PCR-based assay at Matsushima Bay.
Table 2. Cross-correlation between detection cycle of animals based on relative sequence numbers (CPM) of environmental DNA metabarcoding and that of human norovirus from cultured oysters using RT-PCR-based assay at Matsushima Bay.
While the analysis presented in was based on the absolute sequence numbers of animal species detected (Table S2), the cross-correlation analysis based on the relative sequence numbers CPM (Table S3) also exhibited the significant match of detection of falcated duck (A. falcata), common pochard (A. ferina), carrion crow (C. corone), and common swan (or tundra swan) (C. cygnus/columbianus) with the HNVs (; cross-correlation scores 0.725–0.832, estimated lags 1–4 weeks, p values 0.00003–0.00255, BH-corrected FDR q < 0.01). Most of the mammalian species did not show significant cross-correlation with HNV appearance, except for domestic cat (Felis catus) ( and ; cross-correlation scores 0.717–0.744, an estimated lag one week, p values 0.00026–0.00055, BH-corrected FDR q < 0.01). When the same analysis was conducted based on the presence or absence (0/1 data) of animal detection, no significant cross-correlation was detected for all species.
We also confirmed that partial cross-correlation analysis controlling the effects of rainfall amounts (mm) gave essentially the same results (right side of the and ). As the abundance of HNVs concentrated in oysters may be influenced by fluctuating environmental factors such as weather (Campos and Lees Citation2014), we found that rainfall amounts (mm) (Table S4) also show significant cross-correlation with the detection of HNVs at the estimated time lag of five weeks (cross correlation score 0.818, p value 0.00019). The partial cross-correlation scores between birds/animals and HNVs detection corrected for the rainfall amounts (mm) remained significant in both analyses based on the absolute and relative sequence numbers of the birds/animal species (partial cross-correlation scores 0.674–0.848, p values <0.00001–0.00587, BH-corrected FDR q < 0.01 for absolute sequence numbers, ; partial cross-correlation scores 0.689–0.837, p values <0.00001–0.00449, BH-corrected FDR q < 0.01 for relative sequence numbers, ).
Discussion
Our results showing cross-correlation between HNVs and birds (, and ) and that corrected for an environmental factor rainfall (mm) (right side of the and ) imply that HNVs accumulated in the cultured oysters are initially brought by birds migrating into or endemic to the coastal area. It is plausible that many birds of multiple species excrete HNVs into coastal sea water via urine and feces. In winter when the water temperature is low, the contaminated HNVs are accumulated in oysters (Campos and Lees Citation2014; Hassard et al. Citation2017), occasionally leading to human food poisoning. This view supports the animal-sourced model of HNV infection (), particularly the avian-derived one.
One study among 6,702 papers of HNVs reports detection of this virus from bird feces (Summa et al. Citation2018; Villabruna et al. Citation2019). About a quarter of bird feces sampled in a Finnish city was detected HNV-positive at the minimum quantification cycle (Cq) values of 36–41 using RT-PCR and found to contain genogroup II HNV common in food poisoning (Summa et al. Citation2018). These feces were postulated to be from the gull (genus Larus) and crow (C. corone) using DNA barcoding. On the other hand, only 0–2% mammalian feces (rat and mice) were HNV-positive (Summa et al. Citation2018). Such a close relationship of seabirds and crows with HNV is consistent with our present results ( and ). A possibility that HNVs are brought by seabird immigration () seems to explain the large scale, simultaneous appearance of HNVs observed at coast-wide at the Miyagi Prefecture ().
Importantly in our data, most of the mammals showed no significant association with HNVs, except for domestic cats ( and ). This might be negative for human-origin model of HNV infection (), similarly as proposed by Hörman et al. (Citation2004). It is consistent with the current situation that pathogens including HNVs in sewage sludge are degraded by intense heating in developed countries including the Miyagi Prefecture, Japan. HNVs, however, cannot be analyzed directly using eDNA because they are RNA viruses. A lack of correlation between HNV and human eDNA detection does not exclude the human-mediated infection cycle of HNVs related to wastewater. Sterilization of sewage needs to be monitored continuously. The association between cats and HNVs may be related to the prey of stray cats including marine organisms and birds, but it is unclear whether the relationship is true or not at present.
Time lags from one to four weeks observed between bird eDNA appearance and HNV detection from oysters (, and ) imply that some booster animals may mediate the transfer of HNVs from bird feces to bivalves with amplification. HNVs can infect dolphins and sea dogs (de Graaf et al. Citation2017; Teng et al. Citation2018; Villabruna et al. Citation2019), and dolphins inhabit the coast of Miyagi Prefecture. We propose that the infection cycle of HNVs involves their delivery by seabird carriers to sea water and the accumulation in bivalves at low sea temperature of winter. Propagation of HNVs, derived to sea water by seabirds, in sea mammals might not be ruled out during this process.
Birds and sea mammals of coastal area may generally be asymptomatic hosts of HNVs. This explains how various animals are potential hosts of HNVs in each global region (Summa et al. Citation2018; Villabruna et al. Citation2019), while HNV is a cosmopolitan and common pathogen of humans worldwide (Liao et al. Citation2021). Humans have originated from inland Africa and rapidly dispersed at global scale in these several ten thousand years (Peyrégne et al. Citation2019). Therefore, humans have not developed tolerance to HNVs yet and thus suffer from food poisoning caused by them. This may be a fundamental basis of the common HNV disease. Additionally, considering that fresh fruits and vegetables are also identified as HNV contaminated foods (Ekundayo and Ijabadeniyi Citation2023), birds are attractive potential hosts of HNVs because they can migrate to inlands, fly over the vegetable fields, and may drop HNV contaminated excrements.
Of course, our eDNA methodology and results have several limitations. The mitochondrial DNAs, which is used for the taxonomic markers in eDNA metabarcoding analysis, varies in their copy number among animal species, tissues, and cells (Garesse and Vallejo Citation2001). In addition, it is practically difficult to know the origin of detected eDNA with regards to tissues or cells in general. Accordingly, results of the quantitative analysis of eDNA sequence numbers should be interpreted with caution, although the numbers are thought to be in proportion to the biomass approximately. Consequently, the insights from the present study should be validated by an experimental approach. This would include the HNV detection directly from the intestinal tissue or feces of the bird species suspected as hosts of HNVs. Since the present eDNA analysis only indicates presence of the suspected host animals in the study area, providing a direct evidence of relation of these animals ( and ) to the HNVs should be the next scope of this study. However, the present scheme may be applied to many other pathogens, including COVID-19, whose reservoir organisms remain to be discovered.
In summary, we identified several bird species of duck, pochard, swan, and crow that are significantly associated with HNV detection in MS coast of Japan by the first eDNA-based data-driven approach for this subject (, and ). These birds are the candidate source animals of HNVs in the wild. This view does not contradict with the established infection cycle of HVNs among gastroenteritis patients, sewage and river water, and oysters in the same region (Ueki et al. Citation2005; Kazama et al. Citation2017). This conventional model explains the HNV infection cycle, while it does not exclude the initial extra-source of HNVs such as birds/animals. In fact, in the data of Ueki et al. (Citation2005), detection of HNVs from river water preceded the appearance of HNVs from oyster and patients (Ueki et al. Citation2005; and Box 1 of the ). The present eDNA-based eco-epidemiological approach would be particularly useful to explore unknown host animals of important pathogens such as HVNs, potentially leading to an artificial propagation of pathogens using the host animal and the development of vaccine and small molecule drugs.
Author contributions
YS, JY, and MS conceived the study. MS conducted environmental water sampling. YS performed DNA experiments and sequencing. The bioinformatic data analysis was performed by YS. YS, JY, and MS wrote and edited the first draft of the manuscript. All authors discussed the results, contributed to subsequent manuscript drafts, and approved the final version of the manuscript.
Supplemental Material
Download Zip (699.8 KB)Acknowledgments
We thank the Fisheries Cooperative Association of Miyagi Prefecture for providing the data of norovirus self-testing. This research was supported by the Center for Research Advancement and Collaboration, the Center for Strategic Research Project, and the Spatiotemporal Genomics Project of the University of the Ryukyus. Part of the computations was performed on the NIG supercomputer at ROIS National Institute of Genetics, Japan.
Disclosure statement
No potential conflict of interest was reported by the author(s).
Data availability statement
The raw sequence reads generated by the MiSeq in the current study are available in the DDBJ Sequence Read Archive (DRA) under the accession number DRA014474 for vertebrate mitochondrial 12S rRNA metabarcoding data. All relevant data are within the manuscript and its Supplementary information files.
Additional information
Funding
References
- Bellou M, Kokkinos P, Vantarakis A. 2013. Shellfish-borne viral outbreaks: a systematic review. Food Environ Virol. 5(1):1–12. doi: 10.1007/s12560-012-9097-6.
- Bondad-Reantaso MG, Mackinnon B, Bin H, Jie H, Tang-Nelson K, Surachetpong W, Alday-Sanz V, Salman M, Brun E, Karunasagar I, et al. 2020. Viewpoint: SARS-CoV-2 (the cause of COVID-19 in humans) is not known to infect aquatic food animals nor contaminate their products. AFS. 33(2020):74–78. doi: 10.33997/j.afs.2020.33.1.009.
- Boylan S. 2011. Zoonoses associated with fish. Vet Clin North Am Exot Anim Pract. 14(3):427–438. doi: 10.1016/j.cvex.2011.05.003.
- Camacho C, Coulouris G, Avagyan V, Ma N, Papadopoulos J, Bealer K, Madden TL. 2009. BLAST+: architecture and applications. BMC Bioinformatics. 10(1):421. doi: 10.1186/1471-2105-10-421.
- Campos CJ, Lees DN. 2014. Environmental transmission of human noroviruses in shellfish waters. Appl Environ Microbiol. 80(12):3552–3561. doi: 10.1128/AEM.04188-13.
- Cox MP, Peterson DA, Biggs PJ. 2010. SolexaQA: at-a-glance quality assessment of Illumina second-generation sequencing data. BMC Bioinformatics. 11(1):485. doi: 10.1186/1471-2105-11-485.
- de Graaf M, Bodewes R, van Elk CE, van de Bildt M, Getu S, Aron GI, Verjans GM, Osterhaus AD, van den Brand JM, Kuiken T, et al. 2017. Norovirus infection in harbor porpoises. Emerg Infect Dis. 23(1):87–91. doi: 10.3201/eid2301.161081.
- Ducoli S, Zacco A, Bontempi E. 2021. Incineration of sewage sludge and recovery of residue ash as building material: a valuable option as a consequence of the COVID-19 pandemic. J Environ Manage. 282:111966. doi: 10.1016/j.jenvman.2021.111966.
- Duizer E, Schwab KJ, Neill FH, Atmar RL, Koopmans MPG, Estes MK. 2004. Laboratory efforts to cultivate noroviruses. J Gen Virol. 85(Pt 1):79–87. doi: 10.1099/vir.0.19478-0.
- Edgar RC. 2010. Search and clustering orders of magnitude faster than BLAST. Bioinformatics. 26(19):2460–2461. doi: 10.1093/bioinformatics/btq461.
- Ekundayo TC, Ijabadeniyi OA. 2023. Human norovirus contamination challenge in fresh produce: a global prevalence and meta-analytic assessment. J Appl Microbiol. 134(1):lxac009. doi: 10.1093/jambio/lxac009.
- Gamage CD, Sato Y, Kimura R, Yamashiro T, Toma C. 2020. Understanding leptospirosis eco-epidemiology by environmental DNA metabarcoding of irrigation water from two agro-ecological regions of Sri Lanka. PLOS Negl Trop Dis. 14(7):e0008437. doi: 10.1371/journal.pntd.0008437.
- Garesse R, Vallejo CG. 2001. Animal mitochondrial biogenesis and function: a regulatory cross-talk between two genomes. Gene. 263(1–2):1–16. doi: 10.1016/S0378-1119(00)00582-5.
- Hammer Ø, Harper DAT, Ryan PD. 2001. PAST: paleontological statistics software package for education and data analysis. Palaeontol Electron. 4(1):1–9. http://palaeo-electronica.org/2001_1/past/issue1_01.htm.
- Hassard F, Sharp JH, Taft H, LeVay L, Harris JP, McDonald JE, Tuson K, Wilson J, Jones DL, Malham SK. 2017. Critical review on the public health impact of norovirus contamination in shellfish and the environment: a UK perspective. Food Environ Virol. 9(2):123–141. doi: 10.1007/s12560-017-9279-3.
- Hörman A, Rimhanen-Finne R, Maunula L, von Bonsdorff CH, Torvela N, Heikinheimo A, Hänninen ML. 2004. Campylobacter spp., Giardia spp., Cryptosporidium spp., noroviruses, and indicator organisms in surface water in southwestern Finland, 2000-2001. Appl Environ Microbiol. 70(1):87–95. doi: 10.1128/AEM.70.1.87-95.2004.
- Hosmillo M, Chaudhry Y, Nayak K, Sorgeloos F, Koo BK, Merenda A, Lillestol R, Drumright L, Zilbauer M, Goodfellow I. 2020. Norovirus replication in human intestinal epithelial cells is restricted by the interferon-induced JAK/STAT signaling pathway and RNA polymerase II-mediated transcriptional responses. mBio. 11(2):e00215–20. doi: 10.1128/mBio.00215-20.
- Iwasaki W, Fukunaga T, Isagozawa R, Yamada K, Maeda Y, Satoh TP, Sado T, Mabuchi K, Takeshima H, Miya M, et al. 2013. MitoFish and MitoAnnotator: a mitochondrial genome database of fish with an accurate and automatic annotation pipeline. Mol Biol Evol. 30(11):2531–2540. doi: 10.1093/molbev/mst141.
- Katoh K, Standley DM. 2013. MAFFT multiple sequence alignment software version 7: improvements in performance and usability. Mol Biol Evol. 30(4):772–780. doi: 10.1093/molbev/mst010.
- Kazama S, Miura T, Masago Y, Konta Y, Tohma K, Manaka T, Liu X, Nakayama D, Tanno T, Saito M, et al. 2017. Environmental surveillance of norovirus genogroups I and II for sensitive detection of epidemic variants. Appl Environ Microbiol. 83(9):e03406–03416. doi: 10.1128/AEM.03406-16.
- Kimura M. 1980. A simple method for estimating evolutionary rates of base substitutions through comparative studies of nucleotide sequences. J Mol Evol. 16(2):111–120. doi: 10.1007/bf01731581.
- Kumar S, Stecher G, Li M, Knyaz C, Tamura K. 2018. MEGA X: molecular evolutionary genetics analysis across computing platforms. Mol Biol Evol. 35(6):1547–1549. doi: 10.1093/molbev/msy096.
- Liao Y, Hong X, Wu A, Jiang Y, Liang Y, Gao J, Xue L, Kou X. 2021. Global prevalence of norovirus in cases of acute gastroenteritis from 1997 to 2021: an updated systematic review and meta-analysis. Microb Pathog. 161(Pt A):105259. doi: 10.1016/j.micpath.2021.105259.
- Ludwig-Begall LF, Mauroy A, Thiry E. 2021. Noroviruses-the state of the art, nearly fifty years after their initial discovery. Viruses. 13(8):1541. doi: 10.3390/v13081541.
- Magoč T, Salzberg SL. 2011. FLASH: fast length adjustment of short reads to improve genome assemblies. Bioinformatics. 27(21):2957–2963. doi: 10.1093/bioinformatics/btr507.
- Mathijs E, Stals A, Baert L, Botteldoorn N, Denayer S, Mauroy A, Scipioni A, Daube G, Dierick K, Herman L, et al. 2021. A review of known and hypothetical transmission routes for noroviruses. Food Environ Virol. 4(4):131–152. doi: 10.1007/s12560-012-9091-z.
- Miya M, Sato Y, Fukunaga T, Sado T, Poulsen JY, Sato K, Minamoto T, Yamamoto S, Yamanaka H, Araki H, et al. 2015. MiFish, a set of universal PCR primers for metabarcoding environmental DNA from fishes: detection of more than 230 subtropical marine species. R Soc Open Sci. 2(7):150088. doi: 10.1098/rsos.150088.
- Peyrégne S, Slon V, Mafessoni F, de Filippo C, Hajdinjak M, Nagel S, Nickel B, Essel E, Le Cabec A, Wehrberger K, et al. 2019. Nuclear DNA from two early Neandertals reveals 80,000 years of genetic continuity in Europe. Sci Adv. 5(6):eaaw5873. doi: 10.1126/sciadv.aaw5873.
- R Core Team. 2022. R: a language and environment for statistical computing. Vienna, Austria: R Foundation for Statistical Computing
- Saitou N, Nei M. 1987. The neighbor-joining method: a new method for reconstructing phylogenetic trees. Mol Biol Evol. 4(4):406–425. doi: 10.1093/oxfordjournals.molbev.a040454.
- Sato Y, Miya M, Fukunaga T, Sado T, Iwasaki W. 2018. MitoFish and MiFish pipeline: a mitochondrial genome database of fish with an analysis pipeline for environmental DNA metabarcoding. Mol Biol Evol. 35(6):1553–1555. doi: 10.1093/molbev/msy074.
- Sato Y, Mizuyama M, Sato M, Minamoto T, Kimura R, Toma C. 2019. Environmental DNA metabarcoding to detect pathogenic Leptospira and associated organisms in leptospirosis-endemic areas of Japan. Sci Rep. 9(1):6575. doi: 10.1038/s41598-019-42978-1.
- Sayers EW, Bolton EE, Brister JR, Canese K, Chan J, Comeau DC, Connor R, Funk K, Kelly C, Kim S, et al. 2022. Database resources of the national center for biotechnology information. Nucleic Acids Res. 50(D1):D20–D26. doi: 10.1093/nar/gkab1112.
- Schmieder R, Lim YW, Rohwer F, Edwards R. 2010. TagCleaner: identification and removal of tag sequences from genomic and metagenomic datasets. BMC Bioinformatics. 11(1):341. doi: 10.1186/1471-2105-11-341.
- Summa M, Henttonen H, Maunula L. 2018. Human noroviruses in the faeces of wild birds and rodents-new potential transmission routes. Zoonoses Public Health. 65(5):512–518. doi: 10.1111/zph.12461.
- Ueki Y, Sano D, Watanabe T, Akiyama K, Omura T. 2005. Norovirus pathway in water environment estimated by genetic analysis of strains from patients of gastroenteritis, sewage, treated wastewater, river water and oysters. Water Res. 39(18):4271–4280. doi: 10.1016/j.watres.2005.06.035.
- Tan M. 2021. Norovirus vaccines: current clinical development and challenges. Pathogens. 10(12):1641. doi: 10.3390/pathogens10121641.
- Teng JLL, Martelli P, Chan WM, Lee HH, Hui SW, Lau CCY, Tse H, Yuen KY, Lau SKP, Woo PCY. 2018. Two novel noroviruses and a novel norovirus genogroup in California sea lions. J Gen Virol. 99(6):777–782. doi: 10.1099/jgv.0.001071.
- Thomsen PF, Willerslev E. 2015. Environmental DNA – an emerging tool in conservation for monitoring past and present biodiversity. Biol Conserv. 183:4–18. doi: 10.1016/j.biocon.2014.11.019.
- Villabruna N, Koopmans MPG, de Graaf M. 2019. Animals as reservoir for human norovirus. Viruses. 11(5):478. doi: 10.3390/v11050478.
- Woolhouse M, Scott F, Hudson Z, Howey R, Chase-Topping M. 2012. Human viruses: discovery and emergence. Philos Trans R Soc Lond B Biol Sci. 367(1604):2864–2871. doi: 10.1098/rstb.2011.0354.
- Zhu T, Sato Y, Sado T, Miya M, Iwasaki W. 2023. MitoFish, MitoAnnotator, and MiFish pipeline: updates in 10 years. Mol Biol Evol. 40(3):msad035. doi: 10.1093/molbev/msad035.