
Abstract
The riverbed and riparian zone are the hotspots of nitrogen removal in rivers. Denitrification plays an important role in the process of nitrogen removal. In this study, sediments from the straight channel riverbed and point bars were examined using indoor culture and acetylene inhibition techniques. The primary focus was to investigate the differences in denitrification rates between these sediments. The secondary focus was on the effects of temperature and carbon-nitrogen (C/N) ratios on the denitrification process. The results showed that denitrification rates were higher in point bar sediments compared to those in the straight channel bed. Denitrification rates were also higher in the near water area of the point bar than in the near bank area. Denitrification rates at 30 °C were significantly higher than at 10 °C for each sediment group as well as in samples having carbon and nitrogen amendments. Notably, when the C/N ratio was 2.5, the denitrification rate for samples with carbon and nitrogen additions was significantly higher than for samples without them. On average, denitrification rates increased by 2.56 times, 2.73 times and 2.87 times for sediments from the straight channel, inner part of the point bar, and near bank of the point bar, respectively. At the same time, the number of denitrifying bacteria was found to be higher in the point bar than in the straight channel. These findings highlight the beneficial role of point bars in accelerating sediment denitrification rates and emphasize the potential for increasing nitrogen removal capacity in rivers by optimizing temperature and C/N ratios. Changing the diversity of riverbed geomorphology, temperature and C/N can effectively enhance the nitrogen removal capacity of river ecosystems.
1. Introduction
Globally, about 30% of the nitrogen is exported from river to the ocean or inland basis, and streams and rivers may be important sinks for bioavailable nitrogen owing to their hydrological connections with terrestrial systems, high rates of biological activity and streambed sediment environments that favor microbial denitrification (Boyer et al. Citation2006; Mulholland et al. Citation2008). About 50% of the nitrogen in rivers is removed by denitrification (Ma et al. Citation2014). Denitrification is an important anaerobic nitrogen conversion process in the nitrogen biogeochemistry cycle, nitrate nitrogen (NO3−-N) or nitrite nitrogen (NO2−-N) is reduced to nitric oxide (NO), nitrous oxide (N2O) and nitrogen (N2) by different species of microorganisms. Some environmental factors influence denitrification, including temperature, dissolved oxygen (DO) levels, organic carbon (OC) content, and NO3−-N concentration (Ji et al. Citation2015; Saliling et al. Citation2007). Among these factors, temperature and C/N ratio are regarded as the important variables affecting denitrification rates (Mulholland et al. Citation2008; Shan et al. Citation2018). NH4+-N is closely related to the process of denitrification, in which NH4+-N is converted to NO3−-N by nitrification (Beeckman et al. Citation2018; Hayatsu et al. Citation2021). NO3−-N serves as a nitrogen source for the denitrification process, and the introduction of exogenous nitrogen has been shown to significantly enhance sediment denitrification processes (Ji et al. Citation2015). Liu et al. (Citation2021) investigated the effect of carbon source concentration on nitrate removal by heterotrophic anaerobic denitrification experiments and found that the denitrification rate was affected by dissolved organic carbon (DOC) when the NO3−-N concentration reached 300.8 mg/L.
Sediment OC serves as an electron donor for the denitrification process (Arango et al. Citation2007). Additionally, sediments with higher OC content often exhibit lower reduction potential, making carbon sources favorable for denitrification (Di Capua et al. Citation2019). Typically, liquid organic matrices as traditional carbon sources are used in laboratory studies of nitrate removal, and they include mainly low molecular organic substances (mainly ethanol, methanol and acetate) (Elefsiniotis and Wareham Citation2007; Gomez et al. Citation2003; Wang et al. Citation2009) and saccharides (mainly including fructose, sugar and glucose). (Ge et al. Citation2012; Karanasios et al. Citation2016; Lin et al. Citation2002). Xu et al. (Citation2018) used glucose and sodium acetate as carbon sources to study denitrification and found that these two carbon sources led to different dominant genera of microbes. Yang et al. (Citation2016) found that the optimal C/N ratio affecting denitrification rate was 2.3 when glucose was used as the carbon source in a study of denitrification rate in Yellow River sediments. It has also been noted that the C/N ratio is the crucial factor influencing the denitrification rate, rather than the absolute concentration of carbon or nitrogen (Silvennoinen et al. Citation2008; Knowles Citation1982). Temperature primarily influences enzyme activity, as well as the growth and reproduction rate of denitrifying microorganisms. It also governs the maximum rate of denitrification achievable under conditions of sufficient substrate.
For over a decade, researchers have discovered that topography plays a significant role in river denitrification. Variations in hydraulic conditions, sediment characteristics and OC retention within rivers with diverse geomorphological features can result in spatial disparities in nutrient processes, including denitrification (Opdyke et al. Citation2006; Song, Liu, et al. Citation2024; Song, Su, et al. Citation2024; Welsh et al. Citation2020). Gomez-Velez et al. (Citation2015) found that the denitrification potential within vertical hyporheic exchange under bedforms consistently exceeds the potential found in lateral exchange across river bars and meander banks. Several studies have investigated the influence of hydrogeomorphology on nutrients and trace metals (Hurst and Bruland Citation2008; Riedel et al. Citation2010; Su et al. Citation2023) and found that seawater percolated relatively quickly through sediments near the creek, exhibiting significant signs of alteration.
Point bars are created when sediment from a meandering channel is eroded on the outside and subsequently deposited on the inside of the meander, constituting fluvial facies (Willis and Tang Citation2010). The size and shape of the point bar varies with the size and curvature of the river. In smaller rivers, the point bar is relatively simple, lying on the convex side of the river bar and gently tilting toward the channel. At present, some studies have investigated the structure, hydrological morphology, grain-size variability and morphological dynamics of the point bar (Wang et al. Citation2022; Zhmykhova and Chalov Citation2014; Li, Vandenberghe, et al. Citation2020; Li, Qiao, et al. Citation2020). Song, Liu, et al. (Citation2024), Song, Su, et al. (Citation2024) developed a two-dimensional (2D) coupled flow-reactive transport model to study the effect of a point bar on the efficiency of nitrogen removal and found that the presence of a point bar significantly increases the pressure difference at the surface water-groundwater boundary; thus, improving the hyporheic exchange intensity, intensifying the chemical reactions, increasing the penetration depth of nutrients along the bank and accelerating the nitrogen conversion process. This increases the nitrate-removal process in the stream. However, the denitrification potential of point bar sediments and its influencing factors have not been thoroughly studied. Analyzing the geomorphic characteristics of point bars can facilitate the identification of areas with the highest potential for nitrogen removal. Therefore, it is of great significance to understand the differences between denitrification potential processes in point bars and straight channel, with the aim of enhancing nitrogen removal efficiency in rivers. This study focuses on investigating the denitrification of straight channel and point bars. Sediment samples were cultured using the acetylene inhibition method and analyzed using gas chromatography. The research objectives were to: 1) examine the disparities in denitrification between point bar and straight channel sediments, 2) examine the disparities among different sections of point bars; and 3) evaluate the effects of temperature and 4) evaluate the effects of C/N ratio on denitrification in point bars and straight channels. The findings of this research will provide a scientific basis for improving nitrogen removal efficiency in river restoration projects.
2. Materials and methods
2.1. Study site
The research was conducted in Xiagasi River (30° 58′ N ∼ 31° 03′ N, 114° 27′ E ∼ 114° 30′ E), a tributary of the Sheshui River and a first-class tributary of the Yangtze River, located in Huangpi District, Hubei Province, China. The study sites were a point bar and an adjacent straight channel in its upstream position ().
2.2. Study methods
2.2.1. Sediment sample collection
Sediment samples were collected in July 2021. In the point bar, we established three sampling points near bank and near water, respectively. The point bars extend a total length of 7.2 m from the water source to the riverbank. Sampling points in the near water area were taken within a zone 2 m closer to the water surface, while sampling points in the near bank area were taken within a zone 2 m from the river bank. Similarly, three sampling points were set up in the straight channel. Sediments were collected only at sampling points. Before collecting the sediment samples, any residual branches and leaves within 2 cm of the sediment surface were removed. The sediment samples were then collected from a depth of 0–30 cm using the STC-3D sediment sampling rig (Shandong Jiucun Machinery Co., Ltd., Jining, Shandong Province, China). Sediment samples were collected from 0 to 10, 10 to 20 and 20 to 30 cm depths below the water-sediment interface at each sampling point. A total of 9 sediment samples were individually collected; the collected samples were placed into a sterile plastic bag (Suzhou Hongwangda Plastic Packaging Co., Ltd., Suzhou, Jiangsu Province, China), flushed with high-purity nitrogen gas and sealed immediately. Under anaerobic conditions, the samples were mixed as thoroughly as possible by shaking and kneading the plastic bags and transported to the laboratory for denitrification analysis. Finally, the sediment samples were placed in a sealed and shaded incubator at 4 °C and, returned to the laboratory. Samples for chemical analysis were stored in a −20 °C refrigerator, and samples for biological analysis were stored in a −80 °C freezer. All samples were tested within one week. Placement in the refrigerator is to maximize the stability of the sample. Lucas et al. (Citation2020) found that preservation of soil samples brought back to the laboratory from the experimental site should be kept at sampling moisture in semi-open plastic bags under refrigeration at 4 °C. Sollen-Norrlin and Rintoul-Hynes (Citation2024) found that soil samples stored in a refrigerator had more stable nitrate levels compared to soil samples left out of the refrigerator. Lane et al. (Citation2022) found that storage conditions did not have a significant impact on enzymatic activity and bacterial communities, and −80 °C is best for preserving both enzyme activity and microbial α- and β-diversity.
2.2.2. Measurement of environmental indicators
During the experiment, the sediments samples were packed into sterilized plastic bags (Suzhou Hongwangda Plastic Packaging Co., Ltd., Suzhou, Jiangsu Province, China). These bags were thoroughly cleaned using high purity nitrogen gas and promptly sealed to preserve the anaerobic conditions within the sediments.
The physical and chemical factors of three sampling points were measured to analyze their difference and effects on denitrification rate. The ammonia nitrogen (NH4+-N), NO3−-N and NO2−-N contents of fresh sediments were determined through extraction-spectrophotometry using a 2 mol/L potassium chloride solution (MEPC Citation2012). The sediments soil water content (SWC) was determined using the stoving method (Forchino et al. Citation2018). Another part of the sediment sample was air-dried at 25 °C for a week, then ground and sifted to 0.15 mm particles. The dried sediment samples were then used to measure pH, reduction potential (ORP) and electrical conductivity (EC) through using the glass electrode method (Lu Citation1999). Total nitrogen (TN), total organic carbon (TOC), determined using the Kjeldahl method (Kjeldahl Citation1883) and potassium dichromate oxidation methods, respectively. The composition of sediment was determined by laser particle size analyzer (Topsizer Laser Particle Size Analyzer, Guangdong Province, China). Each parameter was measured three times and the mean value was subsequently utilized for analysis.
2.2.3. Measurement of denitrification rate
Based on the research of Yang et al. (Citation2016), the stream water received carbon, nitrogen and phosphorus amendments by adding glucose, sodium nitrate, potassium dihydrogen phosphate, respectively. Additionally, 0.5 mg/L of Potassium dihydrogen phosphate was added. shows the varying C/N ratios along with corresponding concentrations of glucose and sodium nitrate. The objective of this study was to simulate different of denitrification rates between summer and winter in an open water system. When the effect of temperature on denitrification was studied, no additional C/N ratio was added. When studying the effect of C/N on denitrification, the temperature was set at 30 °C.
Table 1. The concentrations of glucose and sodium nitrate added at different C/N ratios.
The denitrification potential rate of the sediment was determined using the acetylene inhibition method (Magalhães et al. Citation2005; Sørensen Citation1978; Zhong et al. Citation2009). Initially, the sediment samples underwent pre-culturing. Fresh samples were mixed as thoroughly as possible by shaking and kneading the plastic bags under anaerobic conditions. Subsequently, a 6 g of the mixed fresh sample was added to a 100 mL anaerobic culture bottle. (Sichuan Shubo (Group) Co., Ltd., Chengdu, Sichuan Province, China). The system was then flushed with nitrogen for 0.5 h before being pre-cultured in an anaerobic shaker (ZD-85, Changzhou Empe Instruments Manufacturing Limited, Changzhou, China) at 20 °C for 7 d. This pre-culturing process aimed to deplete the original NO3−-N and O2 in the sediment system.
After the pre-culture, add 20 mL of prepared water to each group. This prepared water includes 16 mL of pure water flushed with high-purity nitrogen for 20 min to remove oxygen from the water. Additionally, 4 mL of pure water have been flushed with high-purity acetylene gas for 20 min.
Each bottle was flushed with high-purity nitrogen for 20 s to remove oxygen from the top of the bottle, aim to maintaining an anaerobic environment (Christensen et al. Citation1987). Subsequently, each culture bottle was hermetically sealed to prevent gas leakage. A customized rubber ring of just the right size is placed between the glass cap and the mouth of the bottle as a way to ensure that no air leaks from the bottle. Three sets of anaerobic culture bottles, each with three replicates, were prepared for every sediment sample. The first set of anaerobic culture bottles was utilized for the collection of gas samples at the 0-h time point. The remaining two sets consisted of three anaerobic culture bottles each: one set underwent acetylene treatment after a 4-h incubation, while the other set was incubated for 4 h without acetylene treatment. Gas samples for the 0-h samples were collected immediately at the start of incubation. The rest of the samples were incubated for 4 h under constant temperature, gentle agitation and in darkness. Collection of gas samples at 0 h and after 4 h of incubation involved vigorous shaking of the anaerobic culture bottles to attain equilibrium in the headspace, followed by gas extraction using the liquid displacement method from the top of the culture bottles.
Referring to the experimental method of Joye et al. (Citation1996), a syringe was used to inject 20 mL of sterile water into the anaerobic culture bottle during sampling and to collect the gas sample. The collected 20 ml gas samples were stored at 4 °C and analyzed by gas chromatography in a week. The determination of N2O was performed using a Varian 9790 gas chromatograph equipped with an Electron Capture Detector (ECD) operating at 320 °C. The column temperature is set to 80 °C, using high-purity N2 as the carrier gas at a pressure of 0.4 Pa with an injection volume of 1 mL. The denitrification rate is calculated based on the amount of N2 generated per unit mass and time. The N2 production is determined by the difference in N2O produced after a 4-h period with and without the addition of acetylene treatment to the samples.
2.2.4. DNA extraction, PCR amplification and high-throughput sequencing
Total genomic DNA samples were extracted using the OMEGA Soil DNA Kit (M5635-02), and stored at −20 °C prior to further analysis. The concentration and quality of extracted DNAs were measured using a NanoDrop NC2000 spectrophotometer and agarose gel electrophoresis, respectively. PCR amplification was conducted using Q5 High-Fidelity DNA Polymerase from NEB (New England Biolabs, Beijing, China), with strict control over the number of amplification cycles to minimize them while ensuring consistent amplification conditions within the same batch of samples. PCR amplification of the bacterial 16S rRNA genes V3–V4 region was performed using the forward primer 338 F (5′-ACTCCTACGGGAGGCAGCA-3′) and the reverse primer 806 R (5′-GGACTACHVGGGTWTCTAAT-3′). Sample-specific 7-bp barcodes were incorporated into the primers for multiplex sequencing. The PCR components contained 5 μL of buffer, 0.25 μL of Fast pfu DNA Polymerase (5 U/μL), 2 μl (2.5 mM) of dNTPs, 1 μL (10 uM) of each Forward and Reverse primer, 1 μL of DNA Template and 14.75 μL of H2O. Thermal cycling consisted of initial denaturation at 98 °C for 5 min, followed by 25 cycles consisting of denaturation at 98 °C for 30 s, annealing at 53 °C for 30 s, and extension at 72 °C for 45 s, with a final extension of 5 min at 72 °C. The PCR products were then analyzed by 2% agarose gel electrophoresis, and the target fragments were excised and recovered from the gel. PCR amplification was performed separately for each sample. Gel recovery was performed using the Gel Recovery Kit from AXYGEN. Following preliminary quantification by gel electrophoresis, the PCR-amplified recovery products were further quantified using fluorescence. The fluorescence dye used was the Quant-iT PicoGreen dsDNA Assay Kit, and quantification was done using a Microplate reader (BioTek, FLx800, Beijing, China). Based on the fluorescence quantification results, PCR product samples were mixed in appropriate proportions according to the sequencing requirements of each sample. Taking Illumina MiSeq sequencing as an example, sequencing was prepared using the TruSeq Nano DNA LT Library Prep Kit from Illumina.
Sequence data analyses were primarily performed using QIIME2 and the R package version 3.2.0. The ASV table in QIIME2 was used to calculate the alpha diversity index, observed species, Shannon’s diversity index, Simpson’s index, Faith PD index, Pi uniformity and Good’s coverage at the ASV level.
2.3. Data analysis and statistics
Statistical analysis was conducted using IBM SPSS Statistics version 25.0 (IBM Corp., Armonk, NY). Differences among experimental treatments were examined using a one-way ANOVA test and post-hoc Duncan test. Normal distribution tests and analysis of variance were also performed. Data visualization and mapping were carried out using Origin 2021 and Microsoft Excel software.
3. Results
3.1. Characteristics of environmental indicators of the point bar and the straight channel
Significant differences (p < 0.05, n = 3) were found in the physical and chemical characteristics of sediments from the point bar and straight channel (), were observed among these locations. shows a positive correlation (p < 0.05) between denitrification rate and TOC. The concentrations of TOC, clay, silt, TN, NH4+-N and NO3N were all higher in the point bar sediments that in sediments from the the straight channel, with higher levels observed in the near water area than in the near bank area. In contrast, the straight channel exhibited higher levels of SWC and sand compared to the point bar. NH4+-N was the primary form of inorganic nitrogen in the sediments.
Table 2. Statistical characteristics of environmental factors in river sediments.
Table 4. Correlation results between denitrification rate and physio-chemistry properties of sediment (n = 3).
3.2. Effect of temperature on denitrification rate of sediment
The denitrification rates at the 10 °C and 30 °C were significantly different p < 0.05) (). The highest average denitrification rates were observed in the near water section of the point bar, followed by the near bank of the point bar, and then the straight channel. Compared to the 10 °C group, the average denitrification rate of the straight channel, near water and near bank sediments increased by 2.21, 9.42 and 13.78 times, respectively, at the culture temperature of 30 °C.
3.3. Effect of C/N ratio on denitrification rate of sediments
Increasing the C/N ratios significantly enhanced the denitrification rates of all three sediments. Compared to the control group without the addition of C/N ratios, the denitrification rate in the experimental group of sediment from the straight channel, with added C/N ratios, increased by 36.92%–252.04%. Similarly, the denitrification rate of the near water section of the point bar increased by 33.59%–332.97%, and the denitrification rate of the near bank section of the point bar sediment increased by 59.31%–285.35%. Overall, the denitrification rate demonstrated a positive correlation with the C/N ratio, indicating that a higher C/N ratio is more favorable for enhancing denitrification efficiency. The average denitrification rate among the different experimental groups from highest to lowest was as follows: near water section of the point bar, near bank section of the point bar, the straight channel ().
3.4. Abundance and diversity of nirS genes of different types of sediment microorganisms
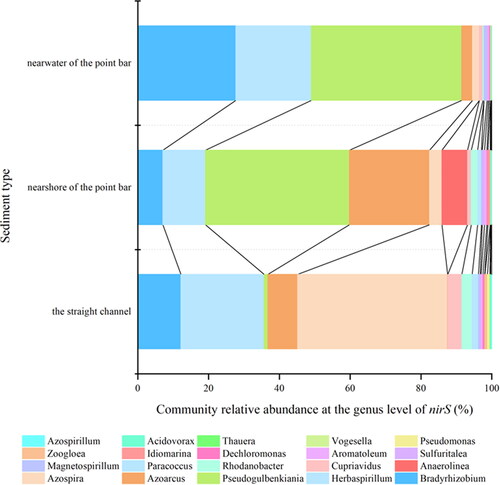
shows that the sediment denitrifying gene genera were consistent across different sediment types, but the relative abundance and abundance differed among them. As an Essential Biodiversity Variable, abundance can be used to describe how a population change across space and time (Kissling et al. Citation2017) and is critical to predicting population collapse (Cerini et al. Citation2023) andmea suring recovery (Grace et al. Citation2021). Relative abundance is also often assumed to show the relative differences among species (i.e. to indicate whether, and by how much, one species is more or less common than another species) (Gotelli et al. Citation2021). The dominant species of organisms with the nirS gene included Bradyrhizobium, Herbaspirillum and Pseudogulbenkiania. A dominant species is a species that prevails in an ecosystem, especially when they are the most numerous and have a high ecological impact. This means they constitute the majority of the biomass (Avolio et al. Citation2019). Among these, Bradyrhizobium and Herbaspirillum, are known nitrogen-fixing bacteria, while Pseudogulbenkiania plays a vital role in driving nitrate reduction. Specifically, Bradyrhizobium, Herbaspirillum, and Azoarcus were present in higher abundance in the near bank samples of the point bar and straight channel sediments. Additionally, the genus Pseudogulbenkiania displayed the highest abundance (0.256) and relative abundance (42%). In the near bank of the point bar sediments, the abundance and relative abundance of the Pseudogulbenkiania species were 0.1712 and 41%, respectively. Conversely, in the straight channel sediments, the abundance and relative abundance of the Pseudogulbenkiania species were 0.0019 and 1%, respectively. Overall, near water sediments the relative abundance of nirS genes exhibited (p < 0.05), higher relative abundance and abundance in key bacterial genra that often drive nitrate reduction compared to near bank sediments and straight channel sediments.
The α-diversity index of sediment denitrification function genes showed difference by Sediment in different locations (p < 0.05). Of the six indices of α-diversity, only the Good-coverage index was greatest in the straight channel, and the remaining five indices were greatest in near-water sediments. Specifically, the Simpson index was 1.15% higher compared to the near bank of the point bar sediment, the Shannon index was 6.29% higher, and the Chao1 index was 8.26% higher. These values were all significantly greater than those observed in the sediment and the straight channel sediment, with the Chao1 index being 19.37% higher compared to both sediment types ().
Table 3. Abundance and α-diversity of denitrification genes in sediments.
4. Discussion
4.1. Effect of physical and chemical properties of sediment on denitrification rate
In this study, we analyzed the correlation between denitrification rate and the physical and chemical properties of the sediment (). The results showed a positive correlation between denitrification rate and pH, SWC, TOC, Clay, TN, NH4+-N and NO3−-N. Among these factors, NO3−-N serves as an essential reactant in the denitrification process. Therefore, NO3−-N content was deemed the most influential factor affecting denitrification in sediment (Magalhaes et al. 2005). Notably, our study found that the sediment from the point bar exhibited higher NO3−-N content compared to the sediment from the straight channel, with even higher levels observed in the near water section of the point bar sediment. The average denitrification rates of the point bar sediments and the sediments from the straight channel reveal that the denitrification rates in the point bar sediments were higher compared to those in the straight channel sediments ( and ). Furthermore, within the point bar, the denitrification rate of the sediment near water was higher than that of the sediment near bank. The substrates for denitrification are usually NO3−-N and NO2−N. Saliling et al. (Citation2007) found that the rate of denitrification accelerated with increasing nitrate concentration in denitrification experiments at influent nitrate concentrations of 50, 120 and 200 mg/L, respectively.
Figure 1. (a) Map of the study area, showing the location of test sites in the catchment; (b) scene photograph of the straight channel; (c) scene photograph of the point bar; (d) schematic diagram of stratified sampling.
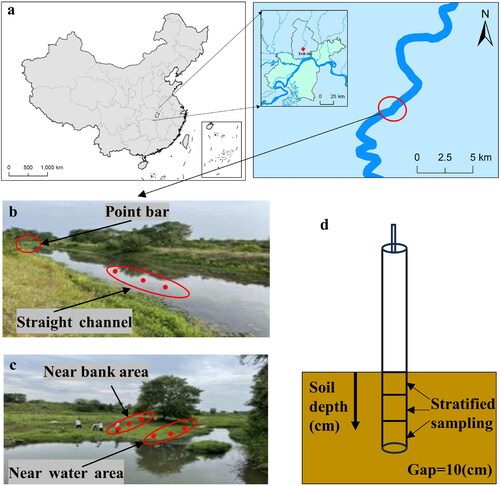
Figure 2. Denitrification rates of at two different temperatures measured in different sediment samples. Letters indicate significant differences between different temperatures at the same C/N ratio.
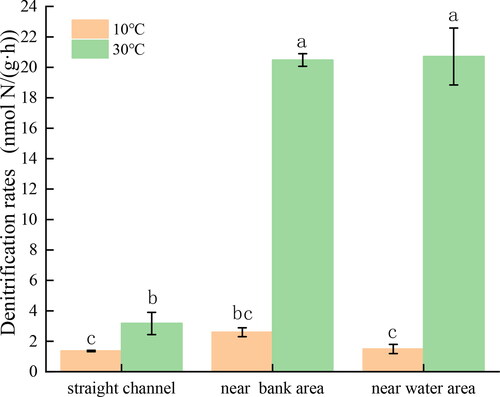
Figure 3. Measurment of denitrification potential at four different C/N ratios in sediment from the straight channel (a), near bank (b) and near water (c). Different letters indicate significant differences among different C/N ratios at the same temperature (α = 0.05).
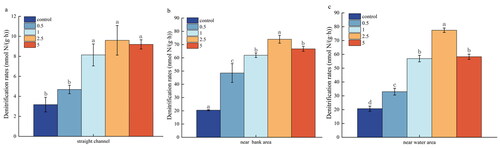
Figure 4. Relative abundance of microorganisms with different sediment nirS gene.
Denitrification in sediment was facilitated by microorganisms in anaerobic environments (Aulakh et al. Citation1992). Zhang et al. (Citation2021) measured the microbial community composition of 135 sediment samples by high-throughput sequencing and found that the potential denitrification rate was positively correlated with the abundance of nirS and nirK genes. Zhang, Fan, et al. (Citation2023), Zhang, Zha, et al. (Citation2023) studied 40 sediment samples and found that the Methanobrevibacter and mcrA gene played rather roles in indicating and promoting potential denitrification rates. Denitrification rate was significantly influenced by various environmental conditions, including temperature and the physical and chemical properties of the sediment (D’Haene et al. Citation2003).
Denitrifying bacteria were classified as heterotrophic bacteria, relying on available OC as a carbon source to serve as the electron donor during the denitrification process (Ma et al. Citation2020). The decomposition of OC consumes oxygen, creating an anaerobic environment. Higher concentrations of bioavailable OC stimulate denitrification and result in elevated denitrification rates. Consequently, sediment studies have generally observed a positive correlation between denitrification rate and OC content (Saunders and Kalff Citation2001; Zaghmouri et al. Citation2013).
Notably, sediments in the straight channel exhibit lower levels of TOC, Inadequate availability of TOC may be one of the reasons for lower denitrification rates in the straight channel. However, in point bar sediments, the carbon and nitrogen content is relatively high, influenced by point bar topography, such as sediment stratification, soil humus, preferential enrichment of river organic matter in the convex side of the point bar and frequent subsurface flow exchange. Consequently, the denitrification process is concentrated in this specific region.
There was positive correlation between denitrification rate and the clay particles (p < 0.05). The impact of point bar structure on denitrification is realized through various environmental factors, such as changes in hydraulic conditions (Shuai et al. Citation2017), undercurrent exchange paths (Gomez-Velez et al. Citation2015), sediment hierarchical deposition (Dong et al. Citation2021) and organic matter accumulation (Bartoli et al. Citation2020). Point bars played a significant role in the sediment characteristics, particularly in terms of texture composition. Point bar by generating localized in-stream accumulations of fine particulate sediments and benthic organic matter, will have finer particulate sediment content relative to a straight, homogeneous and flat channel. In turn, finer particulate sediments have greater denitrification rates relative to coarser particulate sediment content. These findings align with the research conducted by Pinay et al. (Citation2000), who observed the impact of alluvial soil composition and structure on denitrification in large-scale river alluvial plain field experiments. They also noted that denitrification is more likely to occur in soils with higher clay content, supporting the results of our study.
pH plays a crucial role in regulating denitrification rate by influencing enzyme activity and the abundance of denitrifying bacteria (Pan et al. Citation2023). ŠImek et al. (Citation2002) demonstrated that denitrification rate exhibited a linear increase with rising pH when soil pH is below 6.0, with a maximum soil pH of 8.2. In this study, the point bar was found to have sediment pH. pH affects denitrification by influencing the activity of denitrifying enzymes and the growth environment of denitrifying bacteria (Šimek et al. 2002). Richardson et al. (Citation2009) found that denitrifying enzymes become more active with increasing acidity when pH below 7.0. In applications, denitrification can be effectively promoted by adjusting the pH of sediments (Ding et al. Citation2023). When too much nitrogen enters a river, it can lead to some water ecological problems, such as algal blooms, water eutrophication and biodiversity decline (Grant et al. Citation2018; Liu et al. Citation2024; Shen et al. Citation2020;). Denitrification is an effective way to remove nitrogen (Qi and Liu, Citation2023; Zhang, Fan, et al. Citation2023; Zhang, Zha, et al. Citation2023). Point bars can accelerate denitrification potential rates. Incorporating structures, such as point bars into riverbeds enhances geomorphic diversity, thereby improving denitrification efficiency and contributing to river ecological restoration.
4.2. Effect of temperature on denitrification rate of sediment
The change in temperature mainly affects the rates of amination, nitrification and denitrification of organic nitrogen in the sediment, as well as the DO content in the interstitial water (Gardner et al. Citation2016; Kemp and Dodds Citation2002; Quick et al. Citation2019). It increases the activity of microorganisms in the sediment, thus promoting the release of organic nitrogen into the sediment and increasing the release of sediment nitrogen into the water above, consequently enhancing the denitrification rate.
This study demonstrates that an increase in temperature can promote the denitrification rate, which is consistent with previous studies (Rahman et al. Citation2019; Shan et al. Citation2018). Rahman et al. (Citation2019) discovered that temperature plays a vital role in regulating the denitrification process, specifically the reduction of NO3−-N to N2. This may also be related to the temperature increase for the growth of nitrate ammonifying bacteria. It is worth pointing out that the differences in sediment denitrification in response to temperature increases may be related to enhanced mineralization of available carbon and nitrogen in sediments, thereby leading to an increase in N2O emissions (Qiu et al. Citation2018). In this study, the denitrification rate significantly accelerated as the temperature rose from 10 °C to 30 °C, potentially due to the increased mineralization rate of the sediment. At lower temperatures, the availability of OC in the sediment is limited, resulting in an insufficient supply of carbon necessary for the denitrification process and subsequently reducing the denitrification rate. Conversely, higher temperatures result in a boosted denitrification rate. Although it is not practical to change the temperature of the river, by studying the effect of temperature on denitrification, it is known that the summer months, when temperatures are higher throughout the year, have higher rates of denitrification. Song, Liu, et al. (Citation2024) and Song, Su, et al. (Citation2024) through a series of simulation experiments, found that the denitrification rate at 19 °C was about 2.4 times that at 10 °C.
Because protein is the essential component of enzymes involved in the nitrogen conversion process in microorganisms, excessively high environmental temperatures will cause enzyme denaturation, while excessively low temperatures will significantly reduce the activity of bacterial enzymes, thereby impacting the nitrogen conversion efficiency of microorganisms (Bao et al. Citation2022; Deng et al. Citation2021). Zhang, Fan, et al. (Citation2023) and Zhang, Zha, et al. (Citation2023) investigated the denitrification performance of sulfur autotrophic denitrification filter at different temperatures, and found that the highest average TN removal efficiency was achieved at 14 °C −15 °C, and it was found that the sulfur autotrophic denitrification process was significantly inhibited when the temperature was lower than 9.8 °C. The most suitable temperature range for the growth of denitrification bacteria and nitrogen metabolism is generally considered to be between 25 °C and 37 °C (Qiu et al. Citation2018). For instance, Pseudomonas putida achieved a removal efficiency of 100% at 30 °C, but when the incubation temperature was adjusted to 10 °C, the NH4+-N removal efficiency dropped to only 14.55% (Yang et al. Citation2019). In this study, the variation in microbial abundance and the relative abundance of functional genes of denitrifies between the point bar and straight channel sediments resulted in different denitrification rates.
4.3. Effect of the C/N ratio on the sediment denitrification rate
The point bar condition promotes the acceleration of denitrification rates and achieves the highest nitrogen removal efficiency within the river when the C/N ratios were optimized. This study found that the denitrification rate increased significantly with the increasing C/N ratios. The denitrification rate peaked at C/N = 2.5 compared to the control treatment. Denitrification is a microbe-driven nitrogen conversion process, and most pertinent factors influencing microbial activities will consequently impact denitrification. NO3−-N serves as a nutrient essential for microbial growth and as a substrate for denitrification, thus the concentration of NO3−-N inevitably affects the denitrification rate. By studying 72 rivers in the United States (Mulholland et al. Citation2008), a similar pattern was observed, revealing that the denitrification rate decreases with an increase in nitrate concentration when the nitrate content becomes excessively high. Kreiling et al. (Citation2019) measured the denitrification rate of an entire river and proposed the existence of denitrification hotspots throughout the river network, with the location of these hotspots primarily determined by nitrate availability. When nitrate is abundant, the characteristics of the riverbed sediment impact the denitrification rate, with higher rates observed in areas with fine organic sediment. In this study, the preferential accumulation effect of the point bar resulted in higher levels of nitrogen and fine particles in the sediment compared to the straight channel, thereby providing ample nutrients for microorganisms and establishing it as a denitrification hotspot within the region.
Similarly, microbial nitrification and denitrification processes rely on both sediments matrix and energy. OC mineralization provides the necessary substrates and energy for microbial activities. Moreover, OC acts as an electron donor in the denitrification process, thereby influencing denitrification. Glucose has the characteristics of low cost and easy decomposition by microorganisms. Qin et al. (Citation2017) found that using glucose as a carbon source to measure denitrification rate, the optimal nitrogen removal was achieved at the influent glucose of 56.4 mg L−1. However, the use of glucose as a carbon source may also overestimate denitrification rates due to its ease of microbial decomposition. In this study, the preferential accumulation effect of the point bar resulted in higher OC content in the sediment compared to the straight channel. As a result, microorganisms in the point bar presumably had access to more abundant substrates and energy, leading to greater denitrification compared to the straight channel. Rahman et al. (Citation2019) founded a significant increase in the denitrification rate with the increase in OC in wetlands. Hence, environments with sufficient carbon sources were more favorable for improving denitrification rates. Li et al. (Citation2008) and Wang et al. (Citation2005) demonstrated that the release of N2O increases with an increased C/N ratio. Yang et al. (Citation2016) studied the influence of carbon and nitrogen concentration on the Yellow River sediment denitrification rate in fitting the best carbon and nitrogen ratio of 2.3, and in the condition of the best C/N ratio. Newcomer et al. (Citation2012) competed a series of denitrification experiments with naturally occurring carbon sources and showed that denitrification was significantly higher with grass clippings from home lawns than with naturally occurring carbon sources. The differences in denitrification rates observed in these studies may be attributed to the importance of the C/N ratio in controlling the denitrification rate.
It was found that the abundance and relative abundance of nirS gene community were significantly different in different sediment types. The abundance of nirS is influenced by nitrogen supply (Hao et al. Citation2022). For example, Xie et al. (Citation2022) demonstrated that the provision of exogenous nitrogen substrates had a significant impact on the abundance of nirS genes. In this study, the nitrogen content varied significantly among sediments from different river types that corresponded to a variation in the species diversity of nirS genes. The point bar condition in the experiment was more conducive to improving the α-diversity index of the nirS gene in the sediment. This could be attributed to the preferential accumulation of sediment on the side beach, leading to higher mucus content, better water retention and reduced loss of sediment nutrients (available carbon and nitrogen).
This study used indoor culture and acetylene inhibition method to explore the difference between the denitrification rate of the sediment and the influencing factors. The method has the advantages of simple, quick and low cost and a large number of samples can be measured simultaneously. However, due to the inhibition of the nitrification effect, and thus may therefore underestimate the denitrification rate, it is different from the in-situ results.
4.4. Effect of microbial nirS on sediment denitrification
Studying the dominant bacterial species in the nitrogen cycle can help us better understand the functional effects of microbial communities in rivers.
In this study, the dominant bacterial genera of sediment nirS genes were Bradyrhizobium, Herbaspirillum and Pseudogulbenkiania. The abundance of dominant bacterial genera Bradyrhizobium, Herbaspirillum and Pseudogulbenkiania in the point bar is higher than in the straight channel, with higher abundance observed in the nearwater zone compared to the nearshore zone.
Bradyrhizobium and Herbaspirillum belong to nitrogen-fixing bacterial genera. The relative abundance of nitrogen-fixing genera varies among different sampling points, indicating spatial heterogeneity of nitrogen-fixing genera. Although dominant genera in this study, such as Bradyrhizobium, there were significant differences in the composition of nitrogen-fixing bacterial communities compared to the results of other research (Cheung et al. Citation2016). Different environmental conditions, hydrological characteristics, and other factors at different locations are key reasons for these differences.
Pseudogulbenkiania are widely distributed denitrifying microorganisms in ecosystems and are key drivers of denitrification (Li, Vandenberghe, et al. Citation2020; Li, Qiao, et al. Citation2020). Research has shown that some strains of Pseudogulbenkiania possess complete genomes for denitrification processes, enabling them to gradually reduce N2O to N2 through multiple steps (Ishii et al. Citation2011), thereby promoting denitrification rates. Li et al. (Citation2019) founded that Pseudogulbenkiania genus possess the capability of coupling iron oxidation with nitrate reduction, making them key microorganisms driving nitrate reduction. In this study, it is suggested that the abundance of Pseudogulbenkiania in the near water area may be one of the reasons for the highest denitrification rates in this area.
The relative abundance and abundance of denitrifying microorganisms had an impact on the denitrification rate of sediments (Zhu et al. Citation2024; Song et al. Citation2011). Wang et al. (Citation2023) highlighted the crucial role of denitrifying microbial communities in potential denitrification rates, which may more important than the soil properties. In this study, the abundance of denitrifying bacteria was found to be greater in the near water area than in the nearshore area and in the straight channel of the river. This is consistent with the order of denitrification rates observed in this study, suggesting that the abundance of denitrifying bacteria may influence the distribution of nitrogen content, thereby affecting the magnitude of denitrification rates.
5. Conclusion
This study demonstrates that the denitrification rate in point bar sediments, corresponds to a high nitrogen removal rate when compared to the uniform riverbed of straight channel. This difference can be attributed to the preferential accumulation of fine particle matter, organic carbon, and other source substances in the near water area, gradually decreasing toward the river water. Consequently, the point bar serves as a denitrification ‘hot spot’ within river sediments. Whether within a local range or between different river types, the river landform plays a crucial role in determining spatial differences in sediment denitrification. Controlled indoor culture experiments further revealed that temperature and C/N ratios are key factors affecting denitrification. Denitrification rates increase with higher C/N ratios and are higher in environments with elevated temperatures. Denitrifying bacteria is also a factor affecting the rate of denitrification, the more the number of denitrifying bacteria, the more easy to accelerate the rate of denitrification.
Author contributions
All authors contributed to the study conception and design. Ying Liu: Conceptualization, Funding acquisition, Methodology, Supervision, Investigation, Writing – Original draft preparation. Weiping Jiang: Data curation, Investigation, Writing-Original draft preparation, Formal analysis. Jingwen Xiao: Data curation, Investigation. Jinhong Feng: Writing – Reviewing and Editing, Investigation, Methodology. Yuling Huang: Investigation, Funding acquisition. Ziyan Lu: Investigation, Methodology.
Acknowledgments
We would like to thank the editor and the reviewers for their constructive comments, which have greatly helped us to improve the article.
Disclosure statement
This manuscript has not been published or presented elsewhere in part or entirety and is not under consideration by another journal. There are no conflicts of interest to declare.
Availability of data and materials
The data for this work will be made available when needed and on request.
Additional information
Funding
References
- Arango CP, Tank JL, Schaller JL, Royer TV, Bernot MJ, David MB. 2007. Benthic organic carbon influences denitrification in streams with high nitrate concentration. Freshwater Biol. 52(7):1210–1222. doi: 10.1111/j.1365-2427.2007.01758.x.
- Aulakh MS, Doran JW, Mosier AR. 1992. Soil denitrification—significance, measurement, and effects of management. Advances in soil science. New Delhi, India: Elite Publishing House; p. 1–57.
- Avolio ML, Forrestel EJ, Chang CC, La Pierre KJ, Burghardt KT, Smith MD. 2019. Demystifying dominant species. New Phytol. 223(3):1106–1126. doi: 10.1111/nph.15789.
- Bao J, Lv Y, Qv M, Li Z, Li T, Li S, Zhu L. 2022. Evaluation of key microbial community succession and enzyme activities of nitrogen transformation in pig manure composting process through multi angle analysis. Bioresour Technol. 362:127797. doi: 10.1016/j.biortech.2022.127797.
- Bartoli M, Nizzoli D, Zilius M, Bresciani M, Pusceddu A, Bianchelli S, Sundbäck K, Razinkovas-Baziukas A, Viaroli P. 2020. Denitrification, nitrogen uptake, and organic matter quality undergo different seasonality in sandy and muddy sediments of a turbid estuary. Front Microbiol. 11:612700. doi: 10.3389/fmicb.2020.612700.
- Beeckman F, Motte H, Beeckman T. 2018. Nitrification in agricultural soils: impact, actors and mitigation. Curr Opin Biotechnol. 50:166–173. doi: 10.1016/j.copbio.2018.01.014.
- Boyer EW, Howarth RW, Galloway JN, Dentener F, Green PA, Vörösmarty CJ. 2006. Riverine nitrogen export from the continents to the coasts. Global Biogeochem Cycles. 20(1):BS191-1–BS191-9. doi: 10.1029/2005GB002537.
- Cerini F, Childs DZ, Clements CF. 2023. A predictive timeline of wildlife population collapse. Nat Ecol Evol. 7(3):320–331. doi: 10.1038/s41559-023-01985-2.
- Cheung S, Xia X, Guo C, Liu H. 2016. Diazotroph community structure in the deep oxygen minimum zone of the Costa Rica Dome. J Plankton Res. 38(2):380–391. , doi: 10.1093/plankt/fbw003.
- Christensen JG, Smethie WM, Devol AH. 1987. Benthic nutrient regeneration and denitrification on the Washington continental shelf. Deep-Sea Res. 34(5–6):1027–1047. doi: 10.1016/0198-0149(87)90051-3.
- Deng L, Zhao M, Bi R, Bello A, Uzoamaka Egbeagu U, Zhang J, Li S, Chen Y, Han Y, Sun Y, et al. 2021. Insight into the influence of biochar on nitrification based on multi-level and multi-aspect analyses of ammonia-oxidizing microorganisms during cattle manure composting. Bioresour Technol. 339:125515. doi: 10.1016/j.biortech.2021.125515.
- D’Haene K, Moreels E, De Neve S, Chaves Daguilar B, Boeckx P, Hofman G, Van Cleemput O. 2003. Soil properties influencing the denitrification potential of Flemish agricultural soils. Biol Fertil Soils. 38(6):358–366. doi: 10.1007/s00374-003-0662-x.
- Di Capua F, Pirozzi F, Lens PNL, Esposito G. 2019. Electron donors for autotrophic denitrification. Chemical Engineering Journal. 362:922–937. doi: 10.1016/j.cej.2019.01.069.
- Ding X, Li G, Zhao X, Lin Q, Wang X. 2023. Biochar application significantly increases soil organic carbon under conservation tillage: an 11-year field experiment. Biochar. 5(1):90. doi: 10.1007/s42773-023-00226-w.
- Dong Y, Wang D, Chen S, Ding Y, Gao Y, Tian H, Cai R, Yu L, Deng H, Chen Z. 2021. Denitrification in urban river sediment and the contribution to total nitrogen reduction. Ecol Indic. 120:106960. doi: 10.1016/j.ecolind.2020.106960.
- Elefsiniotis P, Wareham DG. 2007. Utilization patterns of volatile fatty acids in the denitrification reaction. Enzym. Microb. Technol. 41(1–2):92–97. doi: 10.1016/j.enzmictec.2006.12.006.
- Forchino AA, Brambilla F, Rimoldi S, Saroglia M, Terova G. 2018. The application of two benthic indices to investigate the effects of land-based fish farms in coastal transitional ecosystems: two case studies in Tuscany region (Italy). Aquacult Int. 26(2):543–555. doi: 10.1007/s10499-017-0224-0.
- Gardner JR, Fisher T, Jordan TE, Knee KL. 2016. Balancing watershed nitrogen budgets: accounting for biogenic gases in streams. Biogeochemistry. 127(2–3):231–253. doi: 10.1007/s10533-015-0177-1.
- Ge S, Peng Y, Wang S, Lu C, Cao X, Zhu Y. 2012. Nitrite accumulation under constant temperature in anoxic denitrification process: the effects of carbon sources and COD/NO(3)-N. Bioresour Technol. 114:137–143. doi: 10.1016/j.biortech.2012.03.016.
- Gomez MA, Galvez JM, Hontoria E, González-López J. 2003. Influence of ethanol concentration on biofilm bacterial composition from a denitrifying submerged filter used for contaminated groundwater. J. Biosci. Bioeng. 95(3):245–251. doi: 10.1263/jbb.95.245.
- Gomez-Velez JD, Harvey JW, Cardenas MB, Kiel B. 2015. Denitrification in the Mississippi River network controlled by flow through river bedforms. Nature Geosci. 8(12):941–945. doi: 10.1038/ngeo2567.
- Gotelli NJ, Booher DB, Urban MC, Ulrich W, Suarez AV, Skelly DK, Russell DJ, Rowe RJ, Rothendler M, Rios N, et al. 2021. Estimating species relative abundances from museum records. Methods Ecol Evol. 14(2):431–443. doi: 10.1111/2041-210X.13705.
- Grace MK, Akçakaya HR, Bennett EL, Brooks TM, Heath A, Hedges S, Hilton-Taylor C, Hoffmann M, Hochkirch A, Jenkins R, et al. 2021. Testing a global standard for quantifying species recovery and assessing conservation impact. Conserv Biol. 35(6):1833–1849. doi: 10.1111/cobi.13756.
- Grant SB, Azizian M, Cook P, Boano F, Rippy MA. 2018. Factoring stream turbulence into global assessments of nitrogen pollution. Science. 359(6381):1266–1269. doi: 10.1126/science.aap8074.
- Hao J, Feng Y, Wang X, Yu Q, Zhang F, Yang G, Ren G, Han X, Wang X, Ren C. 2022. Soil microbial nitrogen-cycling gene abundances in response to crop diversification: a meta-analysis. Sci Total Environ. 838(Pt 4):156621. doi: 10.1016/j.scitotenv.2022.156621.
- Hayatsu M, Katsuyama C, Tago K. 2021. Overview of recent researches on nitrifying microorganisms in soil. Soil Sci Plant Nutr. 67(6):619–632. doi: 10.1080/00380768.2021.1981119.
- Hurst MP, Bruland KW. 2008. The effects of the San Francisco Bay plume on trace metal and nutrient distributions in the Gulf of the Farallones. Geochim Cosmochim Acta. 72(2):395–411. doi: 10.1016/j.gca.2007.11.005.
- Ishii S, Tago K, Nishizawa T, Oshima K, Hattori M, Senoo K. 2011. Complete genome sequence of the denitrifying and N 2 O-reducing bacterium Pseudogulbenkiania sp. strain NH8B. J Bacteriol. 193(22):6395–6396. doi: 10.1128/JB.06127-11.
- Ji B, Yang K, Zhu L, Jiang Y, Wang H, Zhou J, Zhang H. 2015. Aerobic denitrification: a review of important advances of the last 30 years. Biotechnol Bioproc E. 20(4):643–651. doi: 10.1007/s12257-015-0009-0.
- Joye SB, Smith SV, Hollibaugh JT, Paerl HW. 1996. Estimating denitrification rates in estuarine sediments: a comparison of stoichiometric and acetylene based methods. Biogeochemistry. 33(3):197–215. doi: 10.1007/BF02181072.
- Karanasios KA, Vasiliadou IA, Tekerlekopoulou AG, Akratos CS, Pavlou S, Vayenas DV. 2016. Effect of C/N ratio and support material on het-erotrophic denitrification of potable water in bio-filters using sugar as carbon source. Int Biodeterior Biodegrad. 111:62–73. doi: 10.1016/j.ibiod.2016.04.020.
- Kemp MJ, Dodds WK. 2002. The influence of ammonium, nitrate, and dissolved oxygen concentrations on uptake, nitrification, and denitrification rates associated with prairie stream substrata. Limnol Oceanograph. 47(5):1380–1393. doi: 10.4319/lo.2002.47.5.1380.
- Kissling WD, Ahumada JA, Bowser A, Fernandez M, Fernández N, García EA, Guralnick RP, Isaac NJB, Kelling S, Los W, et al. 2017. Building essential biodiversity variables (EBVs) of species distribution and abundance at a global scale. Biol Rev Camb Philos Soc. 93(1):600–625. doi: 10.1111/brv.12359.
- Kjeldahl J. 1883. New method for the determination of nitrogen. Sci Am. 16(405):6470–6470. doi: 10.1038/scientificamerican10061883-6470bsupp.
- Knowles R. 1982. Denitrification. Microbiol Rev. 46(1):43–70. doi: 10.1128/mr.46.1.43-70.1982.
- Kreiling RM, Richardson WB, Bartsch LA, Thoms M, Christensen VG. 2019. Denitrification in the river network of a mixed land use watershed: unpacking the complexities. Biogeochemistry. 143(3):327–346. doi: 10.1007/s10533-019-00565-6.
- Lane JM, Delavaux CS, Van Koppen L, Lu P, Cade-Menun BJ, Tremblay J, Bainard LD. 2022. Soil sample storage conditions impact extracellular enzyme activity and bacterial amplicon diversity metrics in a semi-arid ecosystem. Soil Biol Biochem Soil Biol Biochem. 175:108858. doi: 10.1016/j.soilbio.2022.108858.
- Li J, Vandenberghe J, Mountney NP, Luthi SM. 2020. Grain-size variability of point-bar deposits from a fine-grained dryland river terminus, Southern Altiplano, Bolivia. Sediment Geol. 403:105663. doi: 10.1016/j.sedgeo.2020.105663.
- Li Q, Li P, Zhu P, Wu J, Liang S. 2008. Effects of exogenous organic carbon substrates on nitrous oxide emissions during the denitrification process of sequence batch reactors. Environ Eng Sci. 25(8):1221–1228. doi: 10.1089/ees.2007.0172.
- Li X, Mou S, Chen Y, Liu T, Dong J, Li F. 2019. Microaerobic Fe(II) oxidation coupled to carbon assimilation processes driven by microbes from paddy soil. Sci China Earth Sci. 62(11):1719–1729. doi: 10.1007/s11430-018-9329-3.
- Li X, Qiao J, Li S, Häggblom MM, Li F, Hu M. 2020. Bacterial communities and functional genes stimulated during anaerobic arsenite oxidation and nitrate reduction in a paddy soil. Environ Sci Technol. 54(4):2172–2181. doi: 10.1021/acs.est.9b04308.
- Lin YF, Jing SR, Wang TW, Lee DY. 2002. Effects of macrophytes and external carbon sources on nitrate removal from groundwater in constructed wetlands. Environ Pollut. 119(3):413–420. doi: 10.1016/s0269-7491(01)00299-8.
- Liu R, Xia L, Liu M, Gao Z, Feng J, You H, Qu W, Xing T, Wang J, Zhao Y. 2021. Influence of the carbon source concentration on the nitrate removal rate in groundwater. Environ Technol. 43(22):3355–3365. doi: 10.1080/09593330.2021.1921053.
- Liu X, Beusen AHW, Van Grinsven HJM, Wang J, Van Hoek WJ, Ran X, Mogollón JM, Bouwman AF. 2024. Impact of groundwater nitrogen legacy on water quality. Nat Sustain. 7:891–900. doi: 10.1038/s41893-024-01369-9.
- Lu RK. 1999. Analytical methods of soil agrochemistry. Beijing, China: China Agricultural Science and Technology Press; p. 85–96.
- Lucas Y, Santin RC, Da Silva WTL, Merdy P, Melfi AJ, Pereira OJR, Montes CR. 2020. Soil sample conservation from field to lab for heterotrophic respiration assessment. MethodsX. 7:101039. doi: 10.1016/j.mex.2020.101039.
- Ma L, Jiang X, Liu G, Yao L, Liu W, Pan Y, Zuo Y. 2020. Environmental factors and microbial diversity and abundance jointly regulate soil nitrogen and carbon biogeochemical processes in Tibetan wetlands. Environ Sci Technol. 54(6):3267–3277. doi: 10.1021/acs.est.9b06716.
- Ma P, Li X, Wang H, Wang J, Yan W. 2014. Denitrification and its role in cycling and removal of nitrogen in river. J Agro-Environ Sci. 33(4):623–633.
- Magalhães C, Joye SB, Moreira RM, Wiebe WJ, Bordalo AA. 2005. Effect of salinity and inorganic nitrogen concentrations on nitrification and denitrification rates in intertidal sediments and rocky biofilms of the Douro River estuary. Portugal. Water Res. 39(9):1783–1794. doi: 10.1016/j.watres.2005.03.008.
- MEPC. 2012. Soil-determination of ammonium, nitrite and nitrate by extraction with potassium chloride solution-spectrophotometric methods HJ 634-2012. London: MEPC.
- Mulholland PJ, Helton AM, Poole GC, Hall RO, Hamilton SK, Peterson BJ, Tank JL, Ashkenas LR, Cooper LW, Dahm CN, et al. 2008. Stream denitrification across biomes and its response to anthropogenic nitrate loading. Nature. 452(7184):202–205. doi: 10.1038/nature06686.
- Newcomer TA, Kaushal SS, Mayer PM, Shields AR, Canuel EA, Groffman PM, Gold AJ. 2012. Influence of natural and novel organic carbon sources on denitrification in forest, degraded urban, and restored streams. Ecol Monogr. 82(4):449–466. doi: 10.1890/12-0458.1.
- Opdyke MR, David MB, Rhoads BL. 2006. Influence of geomorphological variability in channel characteristics on sediment denitrification in agricultural streams. J Environ Qual. 35(6):2103–2112. doi: 10.2134/jeq2006.0072.
- Pan Y, She D, Shi Z, Cao T, Xia Y, Shan J. 2023. Salinity and high pH reduce denitrification rates by inhibiting denitrifying gene abundance in a saline-alkali soil. Sci Rep. 13(1):2155–2155. doi: 10.1038/s41598-023-29311-7.
- Pinay G, Black VJ, Planty‐Tabacchi A, Gumiero B, Décamps H. 2000. Geomorphic control of denitrification in large river floodplain soils. Biogeochemistry. 50(2):163–182. doi: 10.1023/A:1006317004639.
- Qi H, Liu Y. 2023. Nitrogen removal through denitrification in China’s aquatic system. Sci Total Environ. 891:164317–164378. doi: 10.1016/j.scitotenv.2023.164317.
- Qin Y, Cao Y, Ren J, Wang T, Han B. 2017. Effect of glucose on nitrogen removal and microbial community in anammox-denitrification system. Bioresour Technol. 244(Pt 1):33–39. doi: 10.1016/j.biortech.2017.07.124.
- Qiu Y, Jiang Y, Guo L, Burkey KO, Zobel RW, Shew HD, Hu S. 2018. Contrasting warming and ozone effects on denitrifiers dominate soil N2O emissions. Environ Sci Technol. 52(19):10956–10966. doi: 10.1021/acs.est.8b01093.
- Quick AM, Reeder WJ, Farrell TB, Tonina D, Feris KP, Benner SG. 2019. Nitrous oxide from streams and rivers: a review of primary biogeochemical pathways and environmental variables. Earth Sci Rev. 191:224–262. doi: 10.1016/j.earscirev.2019.02.021.
- Rahman M, Grace M, Roberts KL, Kessler AJ, Cook PLM. 2019. Effect of temperature and drying-rewetting of sediments on the partitioning between denitrification and DNRA in constructed urban stormwater wetlands. Ecol Eng. 140:105586. doi: 10.1016/j.ecoleng.2019.105586.
- Richardson D, Felgate H, Watmough N, Thomson A, Baggs E. 2009. Mitigating release of the potent greenhouse gas N2O from the nitrogen cycle – could enzymic regulation hold the key? Trends Biotechnol. 27(7):388–397. doi: 10.1016/j.tibtech.2009.03.009.
- Riedel T, Lettmann K, Schnetger B, Beck M, Brumsack H. 2010. Rates of trace metal and nutrient diagenesis in an intertidal creek bank. Geochim Cosmochim Acta. 75(1):134–147. doi: 10.1016/j.gca.2010.09.040.
- Saliling WJB, Westerman PW, Losordo TM. 2007. Wood chips and wheat straw as alternative biofilter media for denitrification reactors treating aquaculture and other wastewaters with high nitrate concentrations. Aquacult Eng. 37(3):222–233. doi: 10.1016/j.aquaeng.2007.06.003.
- Saunders DL, Kalff J. 2001. Denitrification rates in the sediments of Lake Memphremagog, Canada-USA. Water Res. 35(8):1897–1904. doi: 10.1016/s0043-1354(00)00479-6.
- Shan J, Yang P, Shang X, Rahman MM, Yan X. 2018. Anaerobic ammonium oxidation and denitrification in a paddy soil as affected by temperature, pH, organic carbon, and substrates. Biol Fertil Soils. 54(3):341–348. doi: 10.1007/s00374-018-1263-z.
- Shen LQ, Amatulli G, Sethi T, Raymond P, Domisch S. 2020. Estimating nitrogen and phosphorus concentrations in streams and rivers, within a machine learning framework. Sci Data. 7(1):161. doi: 10.1038/s41597-020-0478-7.
- Shuai P, Cardenas MB, Knappett PSK, Bennett PC, Neilson BT. 2017. Denitrification in the banks of fluctuating rivers: the effects of river stage amplitude, sediment hydraulic conductivity and dispersivity, and ambient groundwater flow. Water Resour Res. 53(9):7951–7967. doi: 10.1002/2017WR020610.
- Silvennoinen H, Liikanen A, Torssonen J, Florian Stange C, Martikainen PJ. 2008. Denitrification and nitrous oxide effluxes in boreal, eutrophic river sediments under increasing nitrate load: a laboratory microcosm study. Biogeochemistry. 91(2–3):105–116. doi: 10.1007/s10533-008-9262-z.
- Šimek M, Ová LJ, Hopkins DW. 2002. What is the so-called optimum pH for denitrification in soil? Soil Biol Biochem. 34(9):1227–1234. doi: 10.1016/S0038-0717(02)00059-7.
- Sollen-Norrlin M, Rintoul-Hynes NLJ. 2024. Soil sample storage conditions affect measurements of pH, potassium, and nitrogen. Soil Sci Soc Am J. 88(3):930–941. doi: 10.1002/saj2.20653.
- Song K, Lee JY, Kang H. 2011. Denitrification rates and community structure of denitrifying bacteria in newly constructed wetland. Eur J Soil Biol. 47(1):24–29. doi: 10.1016/j.ejsobi.2010.10.003.
- Song X, Liu Y, Liu D, Feng J, Li L, Guo Y, Luo J, Jiang W. 2024. Influence of point bars on nitrogen transport and reaction in riparian zones. J Hydrol. 637:131388. doi: 10.1016/j.jhydrol.2024.131388.
- Song Y, Su X, Che Q, Dong W, Wan Y, Lyu H, Song T. 2024. Nitrate denitrification rate response to temperature gradient change during river bank infiltration. Environ Geochem Health. 46(5):151. doi: 10.1007/s10653-024-01941-4.
- Sørensen J. 1978. Denitrification rates in a marine sediment as measured by the acetylene inhibition technique. Appl Environ Microbiol. 36(1):139–143. doi: 10.1128/aem.36.1.139-143.1978.
- Su H, Jiang S, Wei X, Jin J, Chang Y, Jiang S, Shi X, Liu ZB, Zhang J. 2023. Trace metals and nutrients in tropical volcanic island rivers: insights on chemical weathering and anthropogenic influences of Pohnpei, Micronesia. Limnologica. 101:126087. doi: 10.1016/j.limno.2023.126087.
- Wang H, Lu Y, Yao S, Zuo L, Liu H. 2022. Bank and point bar morphodynamics in the lower Jingjiang reach of the Yangtze river in response to the three gorges project. J Geogr Sci. 32(8):1530–1556. doi: 10.1007/s11442-022-2009-2.
- Wang L, Cai Z, Yang L, Meng L. 2005. Effects of disturbance and glucose addition on nitrous oxide and carbon dioxide emissions from a paddy soil. Soil Tillage Res. 82(2):185–194. doi: 10.1016/j.still.2004.06.001.
- Wang LS, He Z, Wang C, Chen L, Yang R. 2023. Cultivation increased soil potential denitrification rates by modifying denitrifier communities in desert‐oasis ecotone. Eur J Soil Science. 74(6):e13425. doi: 10.1111/ejss.13425.
- Wang Q, Feng C, Zhao Y, Hao C. 2009. Denitrification of nitrate contaminated groundwater with a fiber-based biofilm reactor. Bioresour Technol. 100(7):2223–2227. doi: 10.1016/j.biortech.2008.07.057.
- Welsh MK, McMillan SK, Vidon PG. 2020. Impact of riparian and stream restoration on denitrification in geomorphic features of agricultural streams. Trans ASABE. 63(5):1157–1167. doi: 10.13031/trans.13777.
- Willis BJ, Tang H. 2010. Three-dimensional connectivity of point-bar deposits. J Sediment Res. 80(5):440–454. doi: 10.2110/jsr.2010.046.
- Xie W, Wang Y, Ji H, Huang X, Xu Y, Ji Y, Feng Y. 2022. Effects of returned straw type on N2O emission, nitrification and denitrification microorganisms from paddy field. Soils. 54(4):769–778.
- Xu Z, Dai X, Chai X. 2018. Effect of different carbon sources on denitrification performance, microbial community structure and denitrification genes. Sci Total Environ. 634:195–204. doi: 10.1016/j.scitotenv.2018.03.348.
- Yang L, Lei K, Meng W, Fu G, Yu T. 2016. Impact of C and N concentrations on sediments denitrification rate of the Yellow River. Marine Environ Sci. 35(6):868–881.
- Yang L, Wang X, Cui S, Ren Y, Yu J, Chen N, Xiao Q, Guo L-K, Wang R. 2019. Simultaneous removal of nitrogen and phosphorous by heterotrophic nitrification-aerobic denitrification of a metal resistant bacterium Pseudomonas putida strain NP5. Bioresour Technol. 285:121360. doi: 10.1016/j.biortech.2019.121360.
- Zaghmouri I, Michotey V, Guasco S, Raimbault P, Garcia N, Bernard G, Bonin P. 2013. Trends in salinity and inorganic nitrogen compounds in the Berre lagoon (1994–2011) bacterial activities and nitrogen budgets. Mar Pollut Bull. 67(1–2):55–65. doi: 10.1016/j.marpolbul.2012.11.046.
- Zhang J, Fan C, Zhao M, Wang Z, Jiang S, Jin Z, Bei K, Zheng X, Wu S, Lin P, et al. 2023. A comprehensive review on mixotrophic denitrification processes for biological nitrogen removal. Chemosphere. 313:137474. doi: 10.1016/j.chemosphere.2022.137474.
- Zhang M, Daraz U, Sun Q, Chen P, Wei X. 2021. Denitrifier abundance and community composition linked to denitrification potential in river sediments. Environ Sci Pollut Res Int. 28(37):51928–51939. doi: 10.1007/s11356-021-14348-w.
- Zhang M, Zha J, Dong Y, Zhang Q, Pang S, Tian S, Sun Q. 2023. Regulation of potential denitrification rates in sediments by microbial-driven elemental coupled metabolisms. J Environ Manage. 348:119320–119373. doi: 10.1016/j.jenvman.2023.119320.
- Zhmykhova T, Chalov RS. 2014. Point bars on the Upper Ob: typization, morphology, and hydrologo-morphometric analysis. Geogr Nat Resour. 35(4):343–351. doi: 10.1134/S1875372814040064.
- Zhong J, Liu G, Fan C, Bai X, Li B, Zhang L, Ding S. 2009. Environmental effect of sediment dredging in lake: III. Influence of dredging on denitrification in sediments. J Lake Sci. 21(4):465–473. doi: 10.18307/2009.0403.
- Zhu Y, Su P, Zhang D, Yuan S, Zhang J, Liu Y. 2024. The characteristics of denitrification in soil and the effect of dissolved organic matter for the typical area of water-level-fluctuating zone of the three gorges reservoir. China Environ Sci. 6:1–9. doi: 10.19674/j.cnki.issn1000-6923.20240024.001.