
ABSTRACT
Purpose: To identify the relative positions of geometrical and visual axes of the eye and present a method to locate the visual center when the geometrical axis is taken as a reference.
Methods: Topography elevation data was collected using a Pentacam HR ® topographer from 2040 normal eyes of 1020 healthy participants in Brazil, China and Italy. A three-dimensional, rotation algorithm, a first-order Zernike polynomial fit and a nonlinear least-squares error function was used within an optimization function to locate the geometrical axis and the visual center of each eye.
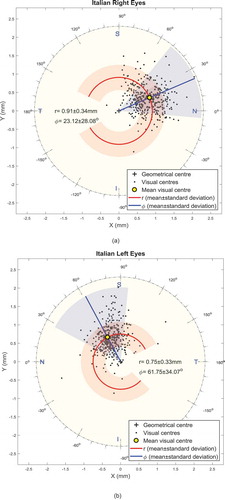
Results: The right eyes of participants were significantly more tilted than left eyes throughout the topography scanning process (p < 0.001). The visual centers were always located in the nasal-superior quadrant, although the visual centers of fellow eyes were not symmetrically located. Mean distances between the visual center and the geometrical center in right eyes were 0.8 ± 0.29 mm, 0.56 ± 0.18 mm and 0.91 ± 0.34 mm among Brazilian, Chinese and Italian participants, respectively, and located at angular positions of 38.7 ± 24.5°, 23.0 ± 29.8° and 23.1 ± 28.1° from the nasal side. However, in left eyes, mean distances were 0.76 ± 0.33 mm, 0.45 ± 0.12 mm and 0.75 ± 0.33 mm at polar angles from the nasal side of 59.3 ± 29.0°, 50.6 ± 44.5° and 61.8 ± 34.1°, respectively.
Conclusions: Fellow eyes do not perform similarly during the fixation process, with right eyes tending to tilt more than left eyes, and the visual centers of the fellow eyes positioned differently relative to the geometrical centers.
Introduction
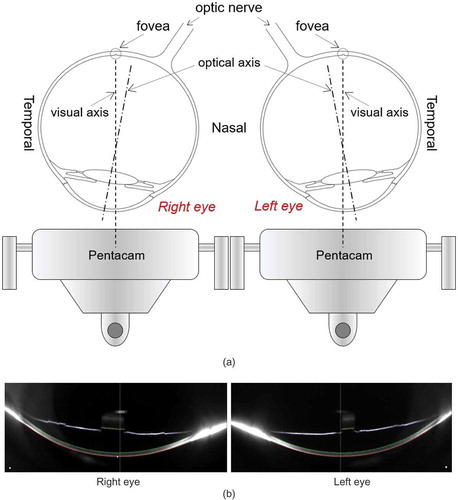
As the visual acuity is tested by Snellen chart at a six-meter distance to simulate the focus on distant objects at infinity while keeping the fellow eyes parallel,Citation1 this is not the case when scanning corneal topography. When the surface of the eye is being reconstructed by a videokeratography topographer, the target fixation target is positioned within the device’s head close to the eye, which stimulate accommodation and convergence. Some modern eye scanners have limited adjustable virtual fixation target systems. The Pentacam HR, as an example, has a red blinking Light Emitting Diode (LED) that virtually serves as a movable fixation target that moves virtually in half dioptre steps, but with limited range of 2.0 to −5.0 dioptres,Citation2 which is still insufficient to stimulate accommodation and convergence. Therefore, fixation on an object, such as a topographer’s focusing target, at a short distance requires a response from the ocular system to achieve a clear focused vision.Citation3 Besides the convergence, another source of misalignment between the optical and the visual axis, is foveal position, its center is not placed on the optical axis, but located around 3.4 mm temporal to the optic disk edge,Citation4 2.5 mm temporal to the optical axisCitation5 and slightly inferior. The eye has to rotate to a tilted position in relation to the optical axis to allow the refracted light rays to fall on the fovea (see ). Consequently, the eye becomes oriented in such a way that its visual axis aligns with the topographer’s axis, resulting in tilted Scheimpflug images and tilted topography maps in relation to its geometrical center,Citation6 . Accurately compensating for this induced tilt is challenging as the eye’s surface has few distinguishable features.Citation7
Figure 1. (a) The tilted eye position to allow focused light rays to fall on the fovea during the topography scanning process. (b) Pentacam HR Scheimpflug images for an Italian participant, 75 years old female, showing horizontal cross-sectional views of right and left eyes during the topography scan.
While the optical axis could be considered as a perfect representation of the geometrical axis of the eye as it represents, in theory, the path of a light ray that enters and leaves the optical system of the eye along the same line,Citation8 such a path may never exist in actual eyes. Even if there is a unique optical axis for a human eye, the fact that this axis meets the retina nasally below the fovea, missing its central sensitive zone,Citation9 makes it difficult to be identified clinically.Citation10 However, while the eye’s optical axis may be a theoretical construct, which does not exist in the real-world,Citation11 the axis remains an important reference line for the measurement and analysis of ocular shape. Its applications include being a geometrical axis for spectaclesCitation12 and other corrective lenses that are manufactured in processes that require a unique geometrical centerline like a lathe centered on its spindlesCitation13 or an injection moulding machine where centring the two halves of the mould around a geometrical axis is an essential process.Citation14 Another application is in computer-based eye modeling systems that trace light rays through the ocular system.Citation15 These systems reconstruct the eye shape while relying on a coordinate system based on a common axis.Citation16 As in these models, the angle between the visual axis and the optical axis is relatively small, it is common to treat these two axes equally,Citation17 even though this treatment can lead to alignment errors in vision-correction products like multifocal contact lenses, where centration over the patient’s visual axis is essential for adequate optical performance.Citation18
Accepting the argument that the eye possibly has no perfect axis of symmetryCitation19 and no true optical axis,Citation20 this study considers the geometrical axis of the eye as (a) the optimal line that minimizes the asymmetric shape deviation of the ocular system’s anterior components; (b) the line that offers the most satisfactory axis adopted in manufacturing spectacles and contact lenses; and (c) the centerline that can be used as a reference in modeling applications in computer-aided design (CAD) or finite element (FE) modeling packages. The study presents a methodology to level the eye’s topography data, making it normal to its optimal geometrical axis, thus providing a specific engineering design information regarding human ocular shape. Hence, the study presents the geometrical axis that passes through the geometric center of the cornea and the mean distance between this axis and the visual axis in fellow eyes for three different populations.
Subjects and methods
Clinical data
The ethics committee of the Federal University of São Paulo (Brazil) approved this retrospective research study, which was conducted in accordance with the standards set in the 1964 Declaration of Helsinki, and its revisions till Fortaleza 2013. Due to the reported topographical and anatomical differences between ethnic groups,Citation21–Citation23 it was decided that the study should look at different populations and investigate if results were attached to a certain population. The study involved scanning both eyes of 181 Brazilian (aged 35.6 ± 15.8), 500 Chinese (aged 24.2 ± 5.7) and 343 Italian (aged 37.6 ± 13.5) participants selected from referrals to Instituto de Olhos Renato Ambrósio (Rio de Janeiro, Brazil), the Wenzhou Eye Hospital (Wenzhou, China) and Vincieye Srl Eye Clinic (Milan, Italy), respectively.
Before being anonymized, clinical topography data has been collected from both eyes of normal participants from three populations in three different countries using the Pentacam HR Ⓡ (OCULUS Optikgeräte GmbH, Wetzlar, Germany). Participants from Brazil, China and Italy, with no history of ocular disease, trauma, or ocular surgery, were selected. Those with intraocular pressure (IOP) higher than 21 mmHg as measured by the Goldmann Applanation Tonometer, soft contact lens wear until less than two weeks before measurement, or rigid gas-permeable (RGP) contact lens wear until less than four weeks before measurements were excluded. Pentacam HR elevation data for the anterior surface were exported in comma-separated values (CSV) format and analyzed using custom-built Matlab ® (MathWorks, Natick, USA) codes.
Determination of corneal tilt
Corneal topography data collected by a topographer usually have the eye’s visual axis aligned with the topography machine’s axis, with the eye becoming tilted because of this alignment. This tilt is compensated such that the geometrical axis becomes the reference line of the data instead of the visual axis.
The process of leveling the topography data starts with considering the raw Pentacam HR elevation data, which is available in a Cartesian form:
From the X and Y coordinate data, the polar radius of each point () is obtained as:
which is then normalized to fit within a unit circle by dividing for each point by the maximum polar radius value across the measured corneal surface:
On the other hand, the polar angular position array, is calculated from the inverse trigonometric function
using the right-hand rule, which defines the positive direction of the angle θ.
With this manipulation, the cornea’s elevation data ( and
) is fitted to first-order Zernike polynomial,Citation24
, in the form
where Zernike coefficients ,
and
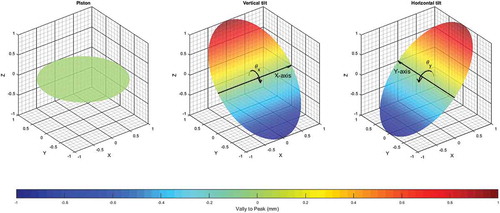
represent the respective contribution of the piston, vertical tilt and horizontal tilt to the fitted corneal surface,Citation25 . The Zernike polynomials were first described by ZernikeCitation26 and widely used to describe the complex shape of the human corneal surface through the values of their terms and coefficients.Citation27 They are sets of polynomials function of two variables, radius (r) and angular position (θ) that are orthogonal inside a unit circle (circle with a radius of one). Through using Zernike polynomials, the eye surface can be constructed from the combination of terms that have a physical meaning directly commented to the ocular surface characteristics. The first term in a typical first-order (maximum power of r equals one) Zernike polynomial (Equation 7) is called the piston. The piston is a term represents the mean value of the fitted corneal surface and, as appeared from its name, performs like an engine piston moving up and down according to the topography of each individual eye. The next two terms of the Zernike polynomial are representing the vertical tilt of the fitted surface around the X-axis (superior-inferior) and the horizontal tilt around the Y-axis (nasal-temporal), where the Z-axis is considered as the line coming out from the corneal apex perpendicular to its surface. Therefore, fitting a corneal surface to a first-order Zernike polynomial enables the determination of the tilt coefficients around the X-axis (
) and the Y-axis (
), . The leveling strategy adopted was to rotate the corneal surface around X-axes and Y-axes by angles
and
, respectively, in order to minimize the Zernike tilt coefficients
and
. The three-dimensional rotation was achieved by adopting the following three rotation matrices,Citation28 in which the rotation angle about Z-axis,
, was set to zero.
Figure 2. Graphical representation of first-order Zernike polynomial terms.
Following the elemental rotation rule, the rotated coordinates ,
and
were calculated as:
The optimization looping procedure was set to end when the absolute values of both of Zernike coefficients, and
became close to zero. This process was carried out by the Levenberg-Marquardt nonlinear least squares algorithm (LMA)Citation29 via the Matlab Optimization Toolbox.
LMA is a standard iterative procedure process rediscovered by Marquardt and published by Levenberg.Citation30 It is a robust technique for solving nonlinear curve fitting problems by searching for a solution (tilt angles and
) that minimize the values of Zernike coefficients,
and
to a pre-set value. In this study, the LMA algorithm was set to stop the optimization process when both Zernike coefficients are below
. The optimization process for each eye’s topography produced the optimal values of the rotation angles
and
that can be used to level the topography map such that its geometrical axis became parallel to the Z-axis, . Tilt angles
around X-axis and
around Y-axis were then compared statistically for each of the three populations involved in the presented study where the significance of the differences between the tilt in different directions was calculated, . Using the geometrical axis (Z-axis) as a reference, the position of the visual axis of the anterior corneal surface (visual center) was located and plotted graphically in –. To allow an efficient comparison between the right and left eyes among the participants of this study, the zero-angular position was located on the nasal side of each eye. The polar coordinate angular nil position was taken at the 3 O’clock position for the right eyes with counter clockwise positive direction, and 9 O’clock position for left eyes with clockwise positive direction.
Figure 3. Determining corneal tilt by first-order Zernike polynomial fit (Same participant as in ).
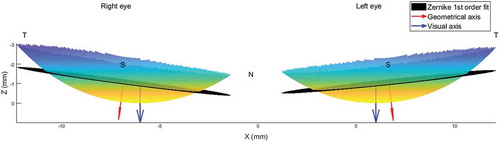
Figure 4. Left eye an Italian participant, same participant as in and . (a) As measured by the Pentacam HR where the first-order Zernike fitted surface shown in black. (b) After being leveled by Zernike first-order fit. In this case rotation angles were and
.
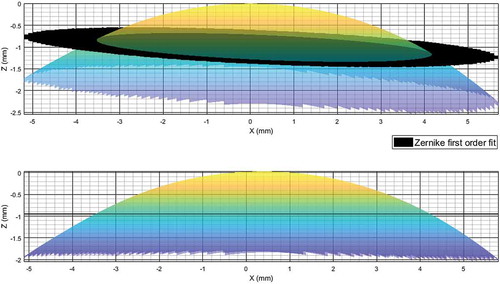
Figure 5. Vertical and horizontal tilt angles among participants involved in this study.
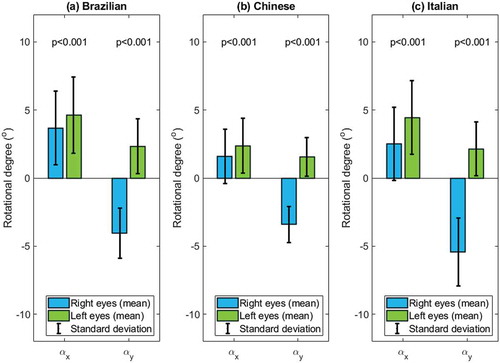
Figure 6. Brazilian corneal visual center position. (a) Right eyes; (b) left eyes.
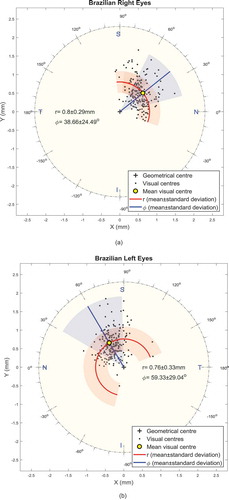
Figure 7. Chinese corneal visual center position. (a) Right eyes (b) left eyes.
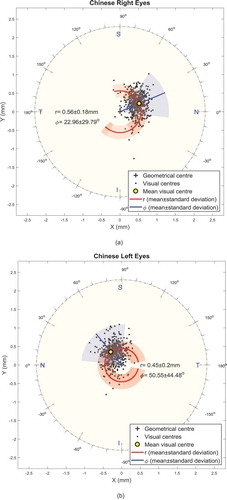
Figure 8. Italian corneal visual center position. (a) Right eyes (b) left eyes.
Statistical analysis
Statistical analysis was performed using Matlab Statistics and Machine Learning Toolbox (MathWorks, Natick, USA). The null hypothesis probability (p) at 95% at confidence level was calculated. Two sample t-test was used to investigate the significance between pairs of data sets to check whether the results represent independent record. The probability p is an element of the period [0, 1], where values of p higher than 0.05 indicates the validity of the null hypothesis.Citation31
Results
The current study results showed that topography leveling values for the data taken with the Pentacam HR were significantly different in right and left eyes as can be seen in . Statistical analysis showed that the differences between the vertical and horizontal tilt angles () were significant among Brazilian, Chinese and Italian participants (p < 0.001). Likewise, comparing the tilt angles between fellow eyes of individuals in each group showed significant differences between right and left eyes (p < 0.001) among the three investigated groups, . Vertical and horizontal average difference absolute values between right and left eyes were −0.90 ± 2.24° and 1.45 ± 1.71° among Brazilian participants, −0.57 ± 1.68° and 1.69 ± 1.27° among Chinese participants, −1.63 ± 2.14° and 3.00 ± 2.33° in Italian participants. The mean absolute differences in the vertical tilt angles between the Chinese and the Brazilian participants were 2.1°, 2.2° for right and left eyes respectively, however, these mean absolute differences were 0.9°, 2.0° between the Chinese and the Italian participants. The trend of mean absolute differences in horizontal tilt angles was the same as absolute differences in horizontal tilt angles but with less variation. Mean absolute differences were 0.7°, 0.8° for right and left eyes respectively between the Chinese and the Brazilian participants and 2.0°, 0.6° between the Chinese and the Italian participants.
Table 1. Position of the visual center relative to the geometrical axis in the three participant groups.
Table 2. Eye’s vertical and horizontal tilts in the three participant groups.
Using polar coordinates, the radial distance, , and the angular position,
, between the geometrical axis and the visual center, varied significantly between right and left eyes of participants within the same population. As can be seen in , the visual centers of right eyes were slightly farther from the geometrical centers than left eyes in all three groups. The mean distances varied from 0.02 mm in Brazilian participants to 0.11 mm in Chinese participants and 0.16 mm in Italian participants. On the other hand, the angular positions of the visual axes of right eye were consistently lower than left eyes with differences of 20.7°, 27.6° and 38.6° among Brazilian, Chinese and Italian participants, respectively. – show the mean positions of visual centers in Brazilian participants (), Chinese participants () and Italian participants ().
Discussion
The challenges in determining corneal topography tilt and the position of the visual axis include the accurate determination of the geometrical axis. This challenge was met in this study by using a three-dimensional rotation technique combined with a topography fit to first-order Zernike polynomials and a nonlinear least-squares optimization function. This methodology was adopted despite uncertainty with respect to the existence of a true rotational symmetry axis in the human eyeCitation32 since an optimal geometrical axis is needed for practical reasons, such as design and fitting of prescription glasses and contact lenses.
Using this methodology, the results revealed some consistent characteristics related to the position of the human eye’s visual center. In all eyes considered, the visual center was located in the nasal-superior direction relative to the geometrical axis. This finding matches the temporal-inferior location of the human foveaCitation33 and the fact that opposite direction rotation is required for a clear vision of a short-distance target. It is also in line with evidence that the pupil center is located temporally and frequently infero-temporally relative to the coaxially sighted corneal light reflex.Citation34
However, the data pointed at different performance of right and left eyes during the fixation process – with right eyes tending to rotate more than left eyes, the differences in tilt angles between fellow eyes were significant in all three participant groups (p < 0.001). Again, this finding is compatible with the facts that (a) right and left eyes commonly differ in their dioptric powers and astigmatic axes; (b) two-thirds of the population are believed to be right-eye dominantCitation32,Citation35–Citation38; (c) the vision field of right eyes is different from that of left eyesCitation38; and (d) the image merging processes carried out within the brain for the two eyes are different.Citation39,Citation40 These differences effectively require different performance of the two eyes during the fixation processCitation41 and help explain why our data suggests that the participants’ right eyes were more dynamic during the fixation process and therefore, the distance between the visual center and geometrical axis in the right eyes were longer than in the left eyes.
It should also be considered that the human eye sees objects upside-down with a blind spot caused by the optic nerve head connection to the retina.Citation42 Correcting the orientation of the images produced by the eyes, and merging them in a way that bridges the gap caused by the blind spot, may require slightly different orientation of the two eyes to achieve the best results.
As simplified representations of the human eye usually ignore the effect of hemispheric division of the brain on the eye position,Citation43 some of the outcomes of such representations do not reflect the eye’s behavior in the real-world.Citation44,Citation45 Therefore, the leveling method presented in this paper should provide an effective way for eye modelers to adopt the correct orientation of topography data in their eye mathematical models. The method should further support multifocal contact lenses designers who are interested in making the center of their lenses’ optical axis aligned with the eye’s visual axis.
The study showed that the average eye tilt was varying less between the Brazilian and the Italian populations for both right and left eyes however, it was notably less among Chinese population compared to the other two populations. It was also clear from the results that position of the visual center is more close to the geometrical center among the Chinese population compared to the Brazilian and the Italian populations. These results were in-line with the reported topographical and anatomical differences between Caucasian and Chinese ethnic groups,Citation21–Citation23 were the majority of the Brazilian and the Italian participants in this study could be considered as Caucasian.
In conclusion, the study presented a method based on using first order Zernike polynomial fitting and an optimization technique to level corneal topography data normal to the cornea’s geometrical axis. By achieving this goal, the study demonstrated that right eyes tend to rotate temporally by 2 ± 2° and inferiorly by 1 ± 2° more than left eyes during the fixation process. The study also showed that the visual centers of fellow eyes are not symmetrically located – the centers were slightly farther from the geometrical center (0.12 ± 0.26 mm) and more nasally oriented (30 ± 40°) in right eyes compared to the left eyes. The study showed that the eye tilt during the topography scan was a general trend among participants from the three investigated populations, the phenomena among the Chinese population was slightly less compared to the Brazilian and the Italian populations.
The findings of the study can be used to improve the quality of applications that rely on the use of corneal topography data, such as contact lenses fitting, corneal implant design and refractive surgery planning. The positioning of the geometrical axis can further improve accuracy in locating the keratoconus cone or orientating the astigmatism axis for individual patients.
Declaration of interest
The authors report no conflicts of interest. The authors alone are responsible for the content and writing of the paper.
References
- Cox C. Physical assessment for nurses. UK: John Wiley & Sons; 2009. 418.
- Yao N, Liu X-L, Ming-Xing W, Lin Y, Sun Y-Y, Chang H, Liu Y-Z. Objective evaluation of the changes in the crystalline lens during accommodation in young and presbyopic populations using Pentacam HR system. Int J Ophthalmol. 2011;4(6):611–15. doi:10.3980/j.issn.2222-3959.2011.06.07.
- Applegate RA, Thibos LN, Twa MD, Sarver EJ. Importance of fixation, pupil center, and reference axis in ocular wavefront sensing, videokeratography, and retinal image quality. J Cataract Refract Surg. 2009;35(1):139–52. doi:10.1016/j.jcrs.2008.09.014.
- Kolb HFE, Nelson R. Facts and figures concerning the human Retina. Salt Lake City (UT): University of Utah Health Sciences Center; 1995. System WTOotRaV, editor.
- Gross H. Handbook of optical systems. Vol. 4, Baden-Württemberg: Wiley-VCH; 2005.
- De Castro A, Rosales P, Marcos S. Tilt and decentration of intraocular lenses in vivo from Purkinje and Scheimpflug imaging: validation study. J Cataract Refract Surg. 2007;33(3):418–29. doi:10.1016/j.jcrs.2006.10.054.
- Harris WF. Optical axes of catadioptric systems including visual, Purkinje and other nonvisual systems of a heterocentric astigmatic eye. S Afr Optom. 2010;69:152–60.
- Arba Mosquera S, Verma S, McAlinden C. Centration axis in refractive surgery. Eye Vis (Lond). 2015;2:4. doi:10.1186/s40662-015-0014-6.
- Yang Q, Cho KS, Chen H, Yu D, Wang WH, Luo G, Pang LH, Guo W, Chen DF. Microbead-induced ocular hypertensive mouse model for screening and testing of aqueous production suppressants for glaucoma. Invest Ophthalmol Vis Sci. 2012;53(7):3733–41. doi:10.1167/iovs.12-9814.
- Thibos LN, Bradley A, Still DL, Zhang X, Howarth PA. Theory and measurement of ocular chromatic aberration. Vision Res. 1990;30:33–49.
- Schwiegerling JT. Eye axes and their relevance to alignment of corneal refractive procedures. J Refract Surg. 2013;29(8):515–16. doi:10.3928/1081597X-20130719-01.
- Rosenthal JW. Spectacles and other vision aids: A history and guide to collecting. USA: Norman Pub; 1996.
- Hmt HMTB. Production Technology. India: McGraw-Hill Education (India) Pvt Limited; 2001.
- Goodship V. Arburg. Practical Guide to Injection Moulding. UK: Rapra Technology; 2004.
- Ng EYK, Tan JH, Acharya UR, Suri JS. Human eye imaging and modeling. Florida, USA: Taylor & Francis; 2012.
- Komzsik L. What every engineer should know about computational techniques of finite element analysis. Vol. 2, USA: CRC Press; 2016.
- Ward NJ, Ho KW, Lambert WS, Weitlauf C, Calkins DJ. Absence of transient receptor potential vanilloid-1 accelerates stress-induced axonopathy in the optic projection. J Neurosci. 2014;34(9):3161–70. doi:10.1523/JNEUROSCI.4089-13.2014.
- Davis RL. Determining Multifocal Parameters for a Better Fit. Rev Optom. 2016;153:50–55.
- Navarro R. The optical design of the human eye: a Critical review. J Optom. 2009;2(1):3–18. doi:10.3921/joptom.2009.3.
- Harris WF. Optical axes of eyes and other optical systems. Optom Vis Sci. 2009;86(5):537–41. doi:10.1097/OPX.0b013e31819fa8d8.
- Hickson-Curran S, Brennan NA, Igarashi Y, Young G. Comparative evaluation of Asian and white ocular topography. Optom Vis Sci. 2014;91(12):1396–405. doi:10.1097/OPX.0000000000000413.
- Hickson-Curran S, Young G, Brennan N, Hunt C. Chinese and Caucasian ocular topography and soft contact lens fit. Clin Exp Optom. 2016;99(2):149–56. doi:10.1111/cxo.12336.
- Lam CSY, Loran DFC. Designing contact lenses for oriental eyes. Cont Lens Anterior Eye. 1991;14:109–14.
- Malacara D. Optical Shop Testing. USA: Wiley; 2007.
- Jagerman LS. Ophthalmologists, Meet Zernike and Fourier! Canada: Trafford Publishing; 2007. 99.
- Zernike F. Beugungstheorie des schneidenver-fahrens und seiner verbesserten form, der phasenkontrastmethode. Physica. 1934;7-12(1):689–704. doi:10.1016/S0031-8914(34)80259-5.
- Thibos LN, Applegate RA, Schwiegerling JT, Webb R. VSIA standards taskforce members. Vision science and its applications. J Refract Surg. 2002;18:652–60.
- Arvo J. Fast random rotation matrices. In: David K, editor. Graphics Gems III. USA: Academic Press Professional, Inc.; 1992. p. 117–20.
- Guyon F, Riche RL. Least squares parameter estimation and the levenberg-Marquardt Algorithm: deterministic analysis, sensitivities and numerical experiments. France: INSA de Rouen; 1999.
- Levenberg KA. Method for the solution of certain non-linear problems in least squares. Quart Appl Math. 1944;2:164–68. doi:10.1090/qam/10666.
- Everitt BS, Skrondal A. The Cambridge dictionary of statistics. Cambridge (UK): Cambridge University Press; 2010.
- Dai G. Wavefront Optics for Vision Correction. In: Dai G-M, editor. USA: Society of Photo Optical; 2008.
- Jonas RA, Wang YX, Yang H, Li JJ, Xu L, Panda-Jonas S, Jonas JB. Optic Disc - Fovea Angle: the Beijing Eye Study 2011. PLoS One. 2015;10(11):e0141771. doi:10.1371/journal.pone.0141771.
- Erdem U, Muftuoglu O, Gundogan FC, Sobaci G, Bayer A. Pupil center shift relative to the coaxially sighted corneal light reflex under natural and pharmacologically dilated conditions. J Refract Surg. 2008;24:530–38.
- Chaurasia BD, Mathur BB. Eyedness. Acta Anat (Basel). 1976;96:301–05.
- Reiss MR. Ocular dominance: some family data. Laterality. 1997;2(1):7–16. doi:10.1080/713754254.
- Ehrenstein WH, Arnold-Schulz-Gahmen BE, Jaschinski W. Eye preference within the context of binocular functions. Graefes Arch Clin Exp Ophthalmol. 2005;243(9):926–32. doi:10.1007/s00417-005-1128-7.
- Eser I, Durrie DS, Schwendeman F, Stahl JE. Association between ocular dominance and refraction. J Refract Surg. 2008;24:685–89.
- Lefebvre E. Advances and challenges in multisensor data and information processing. Netherlands: IOS Press; 2007. 401.
- Barro S, Marin R. Fuzzy logic in medicine. Spain: Physica-Verlag HD; 2013.
- Bergamin O, Straumann D. Three-dimensional binocular kinematics of torsional vestibular nystagmus during convergence on head-fixed targets in humans. J Neurophysiol. 2001;86(1):113–22. doi:10.1152/jn.2001.86.1.113.
- Cai Y. Instinctive Computing. London, UK: Springer-Verlag; 2017.
- Polpitiya AD, Dayawansa WP, Martin CF, Ghosh BK. Geometry and control of human eye movements. IEEE Trans Automat Contr. 2007;52(2):170–80. doi:10.1109/TAC.2006.887902.
- Davelaar EJ. Connectionist models of neurocognition and emergent behavior: from theory to applications. Singapore: World Scientific Publishing Company; 2012.
- London A, Benhar I, Schwartz M. The retina as a window to the brain - from eye research to CNS disorders. Nat Rev Neurol. 2013;9(1):44–53. doi:10.1038/nrneurol.2012.227.