
 ?Mathematical formulae have been encoded as MathML and are displayed in this HTML version using MathJax in order to improve their display. Uncheck the box to turn MathJax off. This feature requires Javascript. Click on a formula to zoom.
ABSTRACT
Purpose: This study developed and evaluated a deep learning ensemble method to automatically grade the stages of glaucoma depending on its severity.
Materials and Methods: After cross-validation of three glaucoma specialists, the final dataset comprised of 3,460 fundus photographs taken from 2,204 patients were divided into three classes: unaffected controls, early-stage glaucoma, and late-stage glaucoma. The mean deviation value of standard automated perimetry was used to classify the glaucoma cases. We modeled 56 convolutional neural networks (CNN) with different characteristics and developed an ensemble system to derive the best performance by combining several modeling results.
Results: The proposed method with an accuracy of 88.1% and an average area under the receiver operating characteristic of 0.975 demonstrates significantly better performance to classify glaucoma stages compared to the best single CNN model that has an accuracy of 85.2% and an average area under the receiver operating characteristic of 0.950. The false negative is the least adjacent misprediction, and it is less in the proposed method than in the best single CNN model.
Conclusions: The method of averaging multiple CNN models can better classify glaucoma stages by using fundus photographs than a single CNN model. The ensemble method would be useful as a clinical decision support system in glaucoma screening for primary care because it provides high and stable performance with a relatively small amount of data.
Introduction
Glaucoma is one of the leading causes of blindness, is found in approximately 3.54% of the global adult population, or approximately 64.3 million people. This is expected to have increased to 76 million by 2020.Citation1 According to a global report in 2010, glaucoma may be related to blindness in 2.1 million people and the severe loss of visual acuity in 4.2 million people.Citation2 From an economic viewpoint, the disease results in substantial financial costs on both individuals and society, and these burdens increases as disease severity increases.Citation3
Due to its chronic and irreversible nature, early detection of glaucoma is important, so early management can slow the progression. Treatment is relatively good in the early stages, whereas advanced glaucoma often has a poor prognosis.Citation4 Glaucoma screening has its limitations, including the cost and the motivating factor of subjective symptoms that most patients lack until later stages of the disease.Citation5 The cost factor comes from the need for advanced expertise and experience in reading the relatively inexpensive and accessible fundus photographs, or it comes from the expensive optical coherence tomography (OCT) and standard automated perimetry.
There are fundamental shortcomings of fundus photography and standard automated perimetry in glaucoma screening beyond the economic aspects. The interpretation of disc photographs is inherently subjective because of the broad range of normal optic nerve appearance and its overlap with pathological findings.Citation6 Furthermore, the major difficulty in detecting glaucoma, classifying stage and identifying progression of disease comes from the high variability and low disease signal in standard automated perimetryCitation7,Citation8 and there have been several attempts to integrate of retinal structure and visual function.Citation9,Citation10 Although combining structural and functional assessments have been shown to provide improved sensitivity and specificity than either modality alone,Citation11 it is impossible to undertake as many tests as clinicians would like within a reasonable period of time in glaucoma screening. To overcome these limitations, several studies suggest that deep learning algorithms based on clinical image data show potential for being used in early screening.Citation12–17
Since Xiangyu et al.Citation12 have demonstrated a method to classify glaucoma and normal groups automatically by combining the fundus photographs and convolutional neural networks (CNN), review of fundus photographs using CNN, one of the deep learning technologies that is prominent in image pattern recognition field could be useful in glaucoma screening. Liu et al.Citation18 have established a large-scale database of fundus images (241,032) for glaucoma diagnosis and developed from the fundus images glaucoma diagnosis with CNN, as an advanced deep learning system would be used in different settings with images of varying quality, patient ethnicity, and population sources. An et al.Citation19 have built a machine learning classification model that combines the information of color fundus images and OCT data to classify glaucomatous and healthy eyes and this system should help to improve the diagnostic accuracy of detecting early glaucoma.
However, most previous studies have focused their deep learning techniques on either fundus photographsCitation12,Citation15–19 or OCT scansCitation13,Citation19 and presented their results in terms of whether or not glaucoma was present, omitting the stage of the disease. The assessment of glaucoma needs to include the structural and functional changes in the eye as the disease progresses. The purpose of this study is to propose and evaluate the performance of a new cost-effective glaucoma screening test for primary care using a deep learning ensemble method with fundus photographs and CNN, considering various stages and structure-function correlations of the disease.
Materials and methods
This study employed a retrospective case-control design. Subjects from the Glaucoma Clinic of Konyang University Hospital and Kim’s Eye Hospital were enrolled between March 2016 and June 2018. The study followed the tenets of the World Medical Association’s Declaration of Helsinki. The Institutional Review Board of the Konyang University Hospital and Kim’s Eye Hospital reviewed and approved the study protocol and exempted informed consent for this study.
The fundus images were acquired by color imaging with a digital fundus camera (Nonmyd 7, Kowa Optimed, Tokyo, Japan) without pupil dilation. Glaucomatous structural changes were defined as images with any of the following conditions: enlargement of the cup-to-disc ratio of 0.7 or greater, cup-to-disc ratio asymmetry of >0.2 between fellow eyes, neuroretinal rim thinning, notching or excavation, disc hemorrhages, and RNFL defects in red-free images with edges being present at the optic nerve head margin. Subjects with the following conditions were excluded from this study: astigmatism with cylinder correction < – 3.0 D or > + 3.0 D, poor-quality conditions of fundus images that could interfere with glaucoma evaluation such as media opacities and motion artifacts, other optic neuropathies induced via inflammatory, ischemic, compressive, and hereditary factors, and other retinal pathologies such as retinal detachment, age-related macular degeneration, myopic chorioretinal atrophy, diabetic retinopathy, macular hole, retinal vascular obstruction, and epiretinal membrane.
Standard automated perimetry using the Swedish interactive thresholding algorithm (SITA-Standard) of central 24–2 perimetry (Humphrey field analyzer II, Carl Zeiss Meditec, Dublin, CA, USA) was performed from each subject with selected fundus photographs. A visual field (VF) was considered to be reliable when the fixation loss was less than 20% and the false positive was less than 33%. Only reliable VF data were included in the analysis, and test data were conducted on fundus photographs that were less than six months old. A glaucomatous VF defect was defined as the threshold of three or more adjacent points in the pattern deviation chart, that have a deviation with less than 5% probability of being due to chance with at least one point less than 1%, or that the pattern standard deviation index is less than 5%.
Cross-sectional data of each eye from 2,801 subjects including all fundus photographs (1 to 13) and single field analysis of VF tests (1 to 7) between March 2016 and June 2018 were distributed to four glaucoma specialists (The Korean Glaucoma Society members). Only one fundus image per eye, a total of 4,445 fundus photographs were selected that were compatible with the ophthalmologic criteria of the CNN model. Reliable VF data within 6 months in which the selected fundus photo was acquired were split into folds at the eye level. In cases wherein both eyes of glaucoma or unaffected control subject were eligible for the study, data from both eyes were chosen for inclusion. Based on the results of the structural and VF testing, the fundus photographs were labeled preliminarily according to the following five stages: unaffected control, preperimetric, mild, moderate, and severe glaucoma. Unaffected controls did not have any glaucomatous structural change or any VF defect. The preperimetric grade was defined as a definite structural glaucomatous change without any VF defects, and perimetric glaucoma was defined as a definite structural glaucomatous change with a corresponding VF defect. Perimetric glaucoma was graded on the MD value from the VF testing according to the Hodapp-Parrish-Anderson classification system.Citation20 The mild group had a MD value greater than or equal to – 6 dB, the moderate group had an MD value of – 6 to – 12 dB, and the severe group had an MD value of less than – 12 dB.
Cross-validation of the preliminary label classifications was performed to maximize the efficiency of the CNN models. The pairing of fundus photograph and VF test results of each eye was reviewed by three other glaucoma specialists who did not participate in preliminary labeling. Each specialist labeled fundus photographs according to the previous structural and functional criteria without the results of preliminary label classification. The results of the cross-validation were added to the data collection. Finally, each photograph for which all glaucoma specialists agreed upon was included in a final dataset. The resolutions of the final dataset consisted of the average pixel of 2,270 (SD; 391, 95% CI; 2,257–2,283) in the height and 3,412 (SD; 596, 95% CI; 2,144–3,432) in the width.
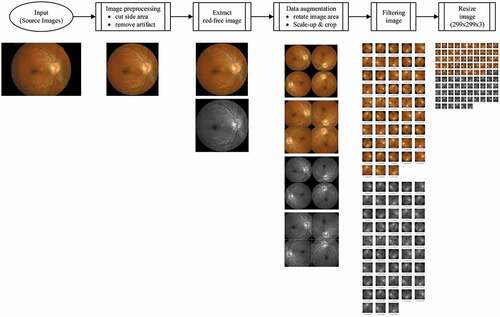
The flow of the image processing in the current study is shown in . Image preprocessing was undertaken to clean-up the photographs of marks that do not affect the reading, such as words, patient numbers, and the black area around the edges of the photograph. Red-free channel from the original color fundus image was taken to obtain a high-resolution image for RNFL. Data augmentation was performed to reduce overfitting and to maximize the training effect of the CNN models. The preprocessed images were rotated (90°, 180°, 270°) and enlarged by 25% with centering on the mid-points of the original image. Finally, the image resolution of each photograph was converted to 299 × 299 × 3 (R × G × B) to input into the CNN architecture after filtering and resizing of the image. To optimize the parameters of the CNN architectures, the processed fundus photographs were passed through various image filters (bilateral, Gaussian, histogram equalization, median, and sharpening), and the results were used as input.
Figure 1. An overview of the image processing flow in the current study. The final image for convolutional neural network architecture of each photograph was prepared by image preprocessing, red-free channel extraction, data augmentation, filtering, and resizing process
shows a total of 56 CNN models comprised of the combined two color types of the fundus photograph (original and red-free images), seven types of image filters including a bypass and filter with all the rest, and four types of CNN architectures. For increasing the diversity of the CNN models, we simulated architectures with one or three fully connected layers of InceptionNet-V3Citation21 conversion (ICFC1 or ICFC3) and InceptionResNet-V2Citation22 (IRFC1 or IRFC3). The final output stage of a total of four types of CNN architectures was composed of a softmax layer with three output nodes. The details of CNN architectures used in this study can be found in Supplementary Fig. S1. A graphic processing unit that supports TensorFlow 1.8, CUDA 9.0, and 5,120 CUDA cores was used in the process of training the 56 CNN models. The computer language used for system development was Python version 3.5. OpenCV version 3.1 was used for the image processing of the fundus photographs. As this study applied 10-fold cross-validation, 90% of the whole dataset was used for training on CNN models and the rest was allocated for validation.
Figure 2. Concept diagram of ensemble method to combine 56 convolutional neural network models. The combination of two color channels of the fundus photograph, seven types of image filters, and four types of CNN architectures resulted in a total of 56 CNN models. The probability of each model was averaged for the final decision on the grading of the fundus photographs
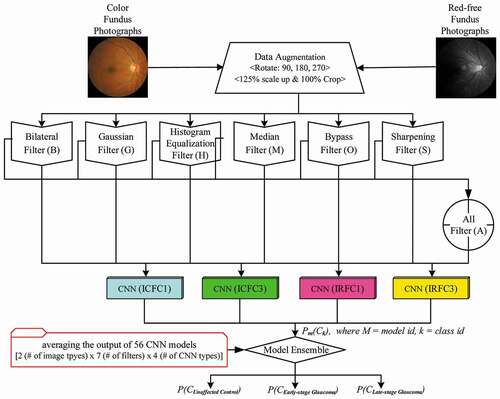
The final decision on the grading of the fundus photographs was performed by averaging the probabilities of each class, which became the output of 56 CNN models. The class with the highest probability was selected as a grade. The ensembled output for each class is calculated using the equation:
where PF(Ck) is the final probability of Ck, k is class identifier, Ps(Ck) is the output from, a single CNN model, which is the probability of Ck on its model. N is the number of models used in the ensemble method.
The accuracy and the area under the receiver operating characteristic (AUROC) were used to compare the diagnostic performance between the best single CNN model, which showed the best performance out of 56 models and the ensemble method, and the AUROC for each of the three classes (C0, C1, and C2) were evaluated as a performance index to classify the stage of glaucoma.
The performance of the best single CNN model and the system combination of 56 CNN models were assessed and compared using the Shapiro-Wilk test and the paired t-test. The algorithms were run a total of 10 times to evaluate the performance using 10-fold cross-validation and the test number was less than 30, the Shapiro-Wilk test was performed to verify the normality in the data distribution. If the data satisfied normal distribution, then the paired t-test was used to compare the model performance, otherwise, the Mann-Whitney U test was performed. Data were recorded and analyzed using R version 3.4.1 (R Foundation for Statistical Computing, Vienna, Austria), based upon a 5% probability of statistical significance.
Availability of materials and data
The datasets generated during and/or analyzed during the current study are not publicly available due to the research employs a retrospective case-control design with a waiver of informed consent, but are available from the corresponding author on reasonable request and with permission of The Institutional Review Board of the Konyang University Hospital. Some representative fundus images in the current study can be found in Supplementary Fig. S2.
Results
The final dataset consists of 3,460 fundus photographs from 2,204 subjects. The distribution and quantity per grade of the datasets before and after the data cross-validation are shown in . The number of images among some of the subgroups, which consisted of the five glaucoma grades, was insufficient to optimize CNN models, and the final dataset was reclassified into three classes. Three classes were the unaffected controls (C0), the early-stage glaucoma (the merged grades of preperimetric and mild grade; C1), and late-stage glaucoma (C2). As described in , in each experiment, the data were randomly sampled so that the training dataset and the validation dataset were equally distributed for each class, and the ratio of training to validation was 9:1.
Table 1. Demographic of the dataset
Table 2. Distribution of the final dataset
The performance evaluation results of the all 56 CNN models and the ensemble method are documented in supplementary Tables S1-5 and box plots are plotted in supplementary Fig. S3-7. The best single CNN model was different depending on the performance index and classification. The model that used a single InceptionResNet-V2 and sharpening filter (S_C_IRFC1) was the best in accuracy and AUROC of C0, and the model that used a single InceptionResNet-V2 and all filters (A_C_IRFC1) was the best in AUROC of average, C1, and C2.
As shown in and , the ensemble results of 56 models had higher mean scores of accuracy and AUROC, and lower variance of AUROC compared to the best single model. The average accuracy and AUROC value of the all classes were 0.852 (95% CI, 0.835–0.869) and 0.950 (95% CI, 0.940–0.961) in the best single model and 0.881 (95% CI, 0.856–0.907) and 0.975 (95% CI, 0.967–0.984) in the ensemble method, respectively. The AUROC and curves for the best single model and the ensemble method according to the glaucoma stages are reported in and . The AUROC of C1 has remarkably increased from 0.905 (95% CI, 0.888–0.922) in the best single model to 0.951 (95% CI, 0.937–0.965) in the ensemble method. The analysis results of the performance of both methods were confirmed to have statistically significant differences (P < .05) in accuracy and AUROC. For a demonstration of the variance in performance, receiver operating characteristic curves of individual folds are presented in supplementary Fig. S8-11.
Figure 3. Comparison of diagnostic performance between the best single CNN model and the ensemble method. The red and green box indicate the best single CNN model in accuracy and average AUROC, respectively, and the blue box indicates the ensemble method
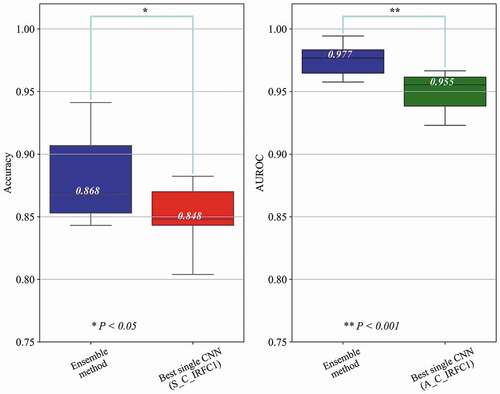
Figure 4. Receiver operating characteristic curves for the best single CNN model and the ensemble method according to the glaucoma stages. The red and blue line indicate receiver operating characteristic curves for the best single CNN model and the ensemble method, in the unaffected controls (a), the early-stage glaucoma (b), and the late-stage glaucoma (c). The ensemble method achieved significantly higher area under the receiver operating characteristic compared to the baseline model in all glaucoma stages, especially in the early-stage glaucoma (B)
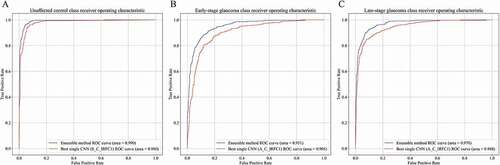
Table 3. Comparison of diagnostic performance between the best single CNN model and the ensemble method
Table 4. Comparison of the AUROC between the best single CNN model and the ensemble method according to the glaucoma stages
The agreement between the predicted class by the algorithms and the final dataset is summarized in . In most misprediction cases, the algorithms predicted the adjacent class such as C1 was incorrectly predicted as C2, followed by C2 as C1, C0 as C1, and C1 as C0 by the best single CNN model (S_C_IRFC1) and the ensemble method, respectively. In comparison of the two algorithms, the ensemble method had higher proportions in all correct prediction cases and lower proportions in misprediction cases, except only one case that C2 was incorrectly predicted as C0 (0.2% in the best single CNN model and 0.4% in the ensemble method).
Table 5. Proportion of the predicted class according to the algorithms compared to the final dataset
Discussion
In this study, we investigated the performance of a newly developed deep learning ensemble method to classify glaucoma stages using fundus photographs and CNN. The ensemble method demonstrated significantly better performance and accuracy than the baseline model. Using this approach, the AUROC value of the early-stage glaucoma (0.951) suggested the promising potential for glaucoma screening in primary care.
Traditionally, fundus photograph is an essential tool for glaucoma evaluation, because of convenience, affordability, and the clinical impact that has proven useful for documentation of the nerve’s appearance at a given time, allowing more detailed scrutiny then, and later comparison for change.Citation6 Glaucoma screening by using fundus photography has not been recommended to the general populationCitation23,Citation24 in part due to the fact that the optic nerve head has inter-individual variability and due to the detection of structural change at its early stages is usually dependent on subjective interpretation.Citation25,Citation26 However, computer-aided diagnosis of fundus images has shown promise in the diagnosis of glaucoma which can overcome the inter-intra variability. Raghavendra et al.Citation27 have achieved the highest accuracy of 98.13% using only 18 layers of CNN. Rogers et al.Citation28 have evaluated the performance of a deep learning-based artificial intelligence software for detection of glaucoma from stereoscopic optic disc photographs in the European Optic Disc Assessment Study, and the system has obtained a diagnostic performance and repeatability comparable to that of a large cohort of ophthalmologists and optometrists. Shibata et al.Citation16 have validated the diagnostic ability of the deep residual learning algorithm in highly myopic eyes which makes the detection of glaucoma a challenging task because of the morphological difference from those of non-highly myopic eyes. Kim et al.Citation29 have developed a publicly available prototype web application for computer-aided diagnosis and localization of glaucoma in fundus images, integrating their predictive model.Citation12–19,Citation27–29
Although most of recent studies have been suggested numerous potential and vision in this field, various stages and structure-function correlations of the glaucoma have received little attention. The results of our study show agree with those found in earlier investigations with an accuracy of 83.4–98.1%Citation13,Citation17,Citation27–29 and an AUROC of 0.887–0.996,Citation12,Citation14–19 and moreover this study enhanced the research by applying a third classification grade to the glaucoma severity based on functional tests. That third level of diagnostics can provide primary care with greater detail at an earlier stage improving the disease management, reducing the chances of blindness, and ultimately reducing the overall medical costs to the patient. Binary classification, such as normal versus glaucoma suspect or normal versus glaucoma is not suitable for a screening test of glaucoma, since the disease is irreversible and shows different structural changes at the early and advanced stages. Even though the current study adopted the ternary (C0, C1, C2) approach to classify the severity of glaucoma, the performance (the averaged AUROC, 0.975) was equal to, or superior to the results of previous studies that adopted binary classification.Citation12,Citation13,Citation15,Citation16,Citation18,Citation19 As a screening tool, the fatal false negatives are the least adjacent mispredictions, and even that are less in the ensemble method than in the best single CNN model in the current study (). The AUROC of C1 (0.951) in our study may have particular implications for the combination of deep learning technique and fundus photographs in glaucoma screening test.
Weak coordination between structure and function is another limitation of previous studies. Clinical data is often labeled by focusing only on structural tests including fundus photographsCitation12,Citation15–19,Citation27–29and OCT scans,Citation13,Citation19 although, glaucoma is a chronic progressive optic neuropathy with corresponding glaucomatous VF defects. In addition, the results of the current study were not inferior to an attempt to use deep learning for analysis of functional test (AUROC 0.926) that preperimetric glaucomatous VF could be distinguished from normal controls.Citation30 Datasets reviewed by the combination of the fundus photographs, which is the most accessible test, and the Humphrey VF test, which is a functional test mainly used for the diagnosis of glaucoma and grading of stages will enhance the performance of a deep learning model.
The second main feature of this study is using the ensemble method. Major of the previous studies used one CNN model.Citation12,Citation15–19,Citation27 The experiments of this study confirmed that the performance in individual CNN models such as InceptionNet-V3 and InceptionResNet-V2 was not significantly different (supplementary Tables S1-5). On the other hand, the results obtained by assembling the learning of multiple CNN models by diversifying the conditions and characteristics of model learning were found to be more advanced than when using only one CNN model in all aspects of bias and variance of the performance evaluation results ( and Fig. S3-7). In fact, the single CNN model that used all filters showed higher AUROC of average, C1, and C2 than that of a single filter, but were not superior to the ensemble method (supplementary Tables S1-5). By verifying each model that used the processed fundus photographs, we found that the readings of some fundus photographs were different than others. We hypothesized these readings could be improved by combining several CNN models with diversity, and that were supposed to advantages of the ensemble method despite its architectural complexity.
Christopher et al.Citation14 recently published their results of the performance of deep learning architectures and transfer learning for detecting glaucomatous optic neuropathy in fundus photographs. They stratified glaucomatous optic neuropathy by the degree of functional loss into two groups: a mild group with a VF mean deviation (MD) better than or equal to – 6 dB and moderate-to-severe group with a VF MD worse than – 6 dB. Their deep learning model achieved an AUROC of 0.89 in identifying glaucomatous optic neuropathy with mild functional loss. It is difficult to directly compare the diagnostic performance of the present CNN algorithm with those in Christopher et al. because their dataset contains a greater number of fundus photographs (n = 14,822) from a racially and ethnically diverse group of individuals than the current study. However, our ensemble method may help account for better diagnostic accuracy in identifying the mild-stage glaucoma (C1).
The third major feature of this study is the superior quality of the fundus photographs used in the CNN model. Li et al.Citation15 used the dataset contained approximately 40,000 fundus photographs in identifying glaucomatous optic neuropathy, and their AUROC was 0.986. Interestingly, the proposed ensemble method with less than 10% of the dataset achieved an AUROC of 0.990 in distinguishing unaffected control (C0) from glaucoma cases. As stated previously, classifying the stage of glaucoma was conducted by reviewing the fundus photographs with reliable VF test data, and the final dataset was decided by the glaucoma specialists unanimously. Actually the model using the dataset after the cross-validation revealed an excellent performance compared to before the cross-validation, even though the data size of total fundus images decreased from 4,445 to 3,460 (77.8%) after the cross-validation. Although the detailed data were not shown, this was probably because ambiguous cases in the assessment of glaucoma such as retinal changes due to high myopia, fundus photographs unrelated to VF tests, and vice versa were excluded after the cross-validation.
Nonetheless, this study has some limitations that need to be considered. First, the findings were obtained from a highly population-specific (Korean) subjects. Furthermore, good classifying performance using the entire area in fundus images, not limited to the optic disc area may be related to the that the RNFL defect is much easier to be identified in Asians, who have more pigment in the retinal pigment epithelium layer, as compared to Caucasians.Citation31 However, additional data acquisition and verification in different racial groups will be needed for a more generalizable model. Second, it is necessary to investigate the CNN models that can classify the grade of glaucoma in more detail. In particular, patients with glaucoma may be co-morbid for many conditions of exclusion criteria in our study such as high myopia and discrepancy between structure and function test. Although it may be difficult to approach fundamentally, further research on the challenging cases is expected to provide more information and generalizability to help in real clinical practice. Third, extra studies for comparing the performance of the deep learning ensemble system against a panel of practicing fundus photographs including glaucoma specialists, general ophthalmologist, residents in ophthalmology, and non-ophthalmological physicians may clarify its necessity and clinical effectiveness in primary care. Fourth, in order to collect enough fundus images, the cut-off value for the false-positive rate (33%) in this study is higher than the standard cut-off value (20%) in other studies. The proportion of the false-positive rate exceed 20% are higher in unaffected control and preperimetric glaucoma groups, and that may be related to a retrospective study design. Finally, additional studies on the image processing and the optimization of the ensemble method considering whether to average or to add weighted values per individual model are needed for enhancing the performance.
In conclusion, this study demonstrated a newly developed deep learning ensemble method and confirmed the possibility of classifying the severity of glaucoma using fundus photographs. It is suggested that the key to high performance may be improving the quality of the dataset and combining multiple CNN models. The CNN ensemble method proposed in this study can be used as a tool for a clinical decision support system to screen the early stages and to monitor the progression of glaucoma.
Competing interests
The authors declare that we have no competing interests with the contents of this article.
Supplemental Material
Download PDF (2.3 MB)Supplementary material
Supplemental data for this article can be accessed on the publisher’s website.
Additional information
Funding
References
- Tham YC, Li X, Wong TY, Quigley HA, Aung T, Cheng CY. Global prevalence of glaucoma and projections of glaucoma burden through 2040: a systematic review and meta-analysis. Ophthalmology. 2014;121(11):2081–90. doi:https://doi.org/10.1016/j.ophtha.2014.05.013.
- Bourne RR, Taylor HR, Flaxman SR, Keeffe J, Leasher J, Naidoo K, Pesudovs K, White RA, Wong TY, Resnikoff S, et al. Number of people blind or visually impaired by glaucoma worldwide and in world regions 1990-2010: a meta-analysis. PLoS One. 2016;11(10):e0162229. doi:https://doi.org/10.1371/journal.pone.0162229.
- Varma R, Lee PP, Goldberg I, Kotak S. An assessment of the health and economic burdens of glaucoma. Am J Ophthalmol. 2011;152(4):515–22. doi:https://doi.org/10.1016/j.ajo.2011.06.004.
- Lee PP, Walt JG, Doyle JJ, Kotak SV, Evans SJ, Budenz DL, Chen PP, Coleman AL, Feldman RM, Jampel HD, et al. A multicenter, retrospective pilot study of resource use and costs associated with severity of disease in glaucoma. Arch Ophthalmol. 2006;124(1):12–19. doi:https://doi.org/10.1001/archopht.124.1.12.
- Gupta P, Zhao D, Guallar E, Ko F, Boland MV, Friedman DS. Prevalence of glaucoma in the United States: the 2005-2008 national health and nutrition examination survey. Invest Ophthalmol Vis Sci. 2016;57(6):2905–13. doi:https://doi.org/10.1167/iovs.15-18469.
- Myers JS, Fudemberg SJ, Lee D. Evolution of optic nerve photography for glaucoma screening: a review. Clin Exp Ophthalmol. 2018;46(2):169–76. doi:https://doi.org/10.1111/ceo.13138.
- Chauhan BC, Garway-Heath DF, Goni FJ, Rossetti L, Bengtsson B, Viswanathan AC, Heijl A. Practical recommendations for measuring rates of visual field change in glaucoma. Br J Ophthalmol. 2008;92(4):569–73. doi:https://doi.org/10.1136/bjo.2007.135012.
- Rountree L, Mulholland PJ, Anderson RS, Garway-Heath DF, Morgan JE, Redmond T. Optimising the glaucoma signal/noise ratio by mapping changes in spatial summation with area-modulated perimetric stimuli. Sci Rep. 2018;8(1):2172. doi:https://doi.org/10.1038/s41598-018-20480-4.
- Bizios D, Heijl A, Bengtsson B. Integration and fusion of standard automated perimetry and optical coherence tomography data for improved automated glaucoma diagnostics. BMC Ophthalmol. 2011;11:20. doi:https://doi.org/10.1186/1471-2415-11-20.
- Russell RA, Malik R, Chauhan BC, Crabb DP, Garway-Heath DF. Improved estimates of visual field progression using bayesian linear regression to integrate structural information in patients with ocular hypertension. Invest Ophthalmol Vis Sci. 2012;53(6):2760–69. doi:https://doi.org/10.1167/iovs.11-7976.
- Malik R, Swanson WH, Garway-Heath DF. ‘Structure-function relationship’ in glaucoma: past thinking and current concepts. Clin Exp Ophthalmol. 2012;40(4):369–80. doi:https://doi.org/10.1111/j.1442-9071.2012.02770.x.
- Xiangyu C, Yanwu X, Damon Wing Kee W, Tien Yin W, Jiang L. Glaucoma Detection Based on Deep Convolutional Neural Network. Conf Proc IEEE Eng Med Biol Soc. 2015;2015:715–18.
- Muhammad H, Fuchs TJ, De Cuir N, De Moraes CG, Blumberg DM, Liebmann JM, Ritch R, Hood DC. Hybrid deep learning on single wide-field optical coherence tomography scans accurately classifies glaucoma suspects. J Glaucoma. 2017;26(12):1086–94. doi:https://doi.org/10.1097/IJG.0000000000000765.
- Christopher M, Belghith A, Bowd C, Proudfoot JA, Goldbaum MH, Weinreb RN, Girkin CA, Liebmann JM, Zangwill LM. Performance of deep learning architectures and transfer learning for detecting glaucomatous optic neuropathy in fundus photographs. Sci Rep. 2018;8(1):16685. doi:https://doi.org/10.1038/s41598-018-35044-9.
- Li Z, He Y, Keel S, Meng W, Chang RT, He M. Efficacy of a deep learning system for detecting glaucomatous optic neuropathy based on color fundus photographs. Ophthalmology. 2018;125(8):1199–206. doi:https://doi.org/10.1016/j.ophtha.2018.01.023.
- Shibata N, Tanito M, Mitsuhashi K, Fujino Y, Matsuura M, Murata H, Asaoka R. Development of a deep residual learning algorithm to screen for glaucoma from fundus photography. Sci Rep. 2018;8(1):14665. doi:https://doi.org/10.1038/s41598-018-33013-w.
- Liu S, Graham SL, Schulz A, Kalloniatis M, Zangerl B, Cai W, Gao Y, Chua B, Arvind H, Grigg J. A deep learning-based algorithm identifies glaucomatous discs using monoscopic fundus photographs. Ophthalmol Glaucoma. 2018;1(1):15–22. doi:https://doi.org/10.1016/j.ogla.2018.04.002.
- Liu H, Li L, Wormstone IM, Qiao C, Zhang C, Liu P, Li S, Wang H, Mou D, Pang R. Development and validation of a deep learning system to detect glaucomatous optic neuropathy using fundus photographs. JAMA Ophthalmol. 2019;137(12):1353. doi:https://doi.org/10.1001/jamaophthalmol.2019.3501.
- An G, Omodaka K, Hashimoto K, Tsuda S, Shiga Y, Takada N, Kikawa T, Yokota H, Akiba M, Nakazawa T. Glaucoma diagnosis with machine learning based on optical coherence tomography and color fundus images. J Healthc Eng. 2019;2019:4061313. doi:https://doi.org/10.1155/2019/4061313.
- Hodapp E, Parrish RK, Anderson DR. Clinical decisions in glaucoma. St. Louis, (MO): Mosby; 1993.
- Szegedy C, Vanhoucke V, Ioffe S, Shlens J, Wojna Z. Rethinking the inception architecture for computer vision. Paper presented at: CVPR 2016. Proceedings of the IEEE conference on computer vision and pattern recognition. Las Vegas (NV); 2016; 27–30.
- Szegedy C, Ioffe S, Vanhoucke V, Alemi AA. Inception-v4, inception-resnet and the impact of residual connections on learning. Paper presented at: AAAI-17. Proceedings of the AAAI Conference on Artificial Intelligence. San Francisco (CA); 2017 Feb 4–9.
- Moyer VA, Force USPST. Screening for glaucoma: U.S. preventive services task force recommendation statement. Ann Intern Med. 2013;159(7):484–89. doi:https://doi.org/10.7326/0003-4819-159-6-201309170-00686.
- Pizzi LT, Waisbourd M, Hark L, Sembhi H, Lee P, Crews JE, Saaddine JB, Steele D, Katz LJ. Costs of a community-based glaucoma detection programme: analysis of the Philadelphia Glaucoma detection and treatment project. Br J Ophthalmol. 2018;102(2):225–32. doi:https://doi.org/10.1136/bjophthalmol-2016-310078.
- Gaasterland DE, Blackwell B, Dally LG, Caprioli J, Katz LJ, Ederer F. Advanced glaumoca intervention Study I. The Advanced Glaucoma Intervention Study (AGIS): 10. Variability among academic glaucoma subspecialists in assessing optic disc notching. Trans Am Ophthalmol Soc. 2001;99:177–84. discussion 184–5.
- Jampel HD, Friedman D, Quigley H, Vitale S, Miller R, Knezevich F, Ding Y. Agreement among glaucoma specialists in assessing progressive disc changes from photographs in open-angle glaucoma patients. Am J Ophthalmol. 2009;147(1):39–44 e1. doi:https://doi.org/10.1016/j.ajo.2008.07.023.
- Raghavendra U, Fujita H, Bhandary SV, Gudigar A, Tan JH, Acharya UR. Deep convolution neural network for accurate diagnosis of glaucoma using digital fundus images. Inf Sci (Ny). 2018;441:41–49. doi:https://doi.org/10.1016/j.ins.2018.01.051.
- Rogers TW, Jaccard N, Carbonaro F, Lemij HG, Vermeer KA, Reus NJ, Trikha S. Evaluation of an AI system for the automated detection of glaucoma from stereoscopic optic disc photographs: the European Optic Disc Assessment Study. Eye (Lond). 2019;33(11):1791–97. doi:https://doi.org/10.1038/s41433-019-0510-3.
- Kim M, Han JC, Hyun SH, Janssens O, Van Hoecke S, Kee C, De Neve W. Medinoid: computer-aided diagnosis and localization of glaucoma using deep learning. Appl Sci. 2019;9(15):3064. doi:https://doi.org/10.3390/app9153064.
- Asaoka R, Murata H, Iwase A, Araie M. Detecting preperimetric glaucoma with standard automated perimetry using a deep learning classifier. Ophthalmology. 2016;123(9):1974–80. doi:https://doi.org/10.1016/j.ophtha.2016.05.029.
- Jonas JB, Dichtl A. Evaluation of the retinal nerve fiber layer. Surv Ophthalmol. 1996;40(5):369–78. doi:https://doi.org/10.1016/S0039-6257(96)80065-8.