
ABSTRACT
Purpose
To investigate amphiregulin (AREG) expression in the sclera during the development of form-deprivation myopia (FDM) and after the recovery of FDM in guinea pigs.
Methods
Sixty-four 2-week-old guinea pigs were randomly divided into the control and FDM groups. The right eyes of animals in FDM group were covered for 2 weeks (2 W) and 4 weeks (4 W), or were covered for 4 weeks and then uncovered for the subsequent 2 weeks (6 W). The diopters and axial lengths (AL) in the right eyes of guinea pigs were measured. Reverse transcription polymerase chain reaction (RT-PCR), immunofluorescence, and western blotting assays were used to detect the relative mRNA and protein expressions of AREG in the sclera of guinea pigs.
Results
Before masking (0 W), the refraction and AL in the right eyes of guinea pigs in the control and FDM groups did not differ significantly (both p > .05). Myopic shift was induced in guinea pigs with the diopters gradually decreased and AL increased in the FDM group. While no significant difference was found in control group at different time points, the relative AREG mRNA and protein expression levels in the FDM group were significantly increased in 2 W and 4 W and then decreased after 4 weeks of covering followed by uncovering for 2 weeks (all p < .05).
Conclusions
AREG was expressed in the sclera of guinea pigs. Moreover, the expression levels of AREG increased during the development of FDM and downregulated after recovery of FDM. Therefore, AREG may be involved in the regulation of scleral remodeling in myopia.
Introduction
Myopia is a global public health problem with the highest incidence among refractive diseases, which may cause irreversible visual impairment. In East and Southeast Asia, the incidence of myopia among young people is as high as 80–90%, of which the incidence of high myopia is 10–20%.Citation1,Citation2 With the increasing incidence of myopia, the demand for medical resources and economic burden are also increasing, which makes myopia a global challenge. A meta-analysis showed that in 2015, the global potential economic loss associated with myopia and myopic macular degeneration was as high as $244 billion, with East Asia bearing the greatest potential economic burdens.Citation3 Thus, it is urgent to study the pathogenesis of myopia and seek the effective control for the development of myopia.
Nowadays, both genetic and environmental factors were found to be associated with the occurrence of myopia. Human amphiregulin (AREG) is a glycoprotein of 84 amino acids, expressed in various organs and tissues such as breast, bone tissue, and ovocyte, mediating various of pathophysiological procedures such as cell survival, proliferation, differentiation, and movement.Citation4,Citation5 In recent years, it was reported that AREG may participate in the eye elongation of myopia. A meta-analysis of 40036 European adults and 10315 Asians found that the genetic polymorphisms were significantly associated with the educational backgrounds in Asians but not for Europeans.Citation6 These results reflect the complex interactions between environment and genes may lead to different incidence of myopia in different areas around the globe. The frequency of mutation of AREG genetic polymorphisms (rs12511037) significantly increased in high myopic patients, indicating its possibility as a high myopic gene.Citation7 Jonas et al.Citation8 found that injection of AREG antibody into the vitreous body in guinea pigs with lens-induced myopia (LIM) could suppress the eye elongation and increase the thickness of posterior choroidal and scleral thickness. Another evidence was that AREG antibodies could also inhibit the development of primary myopia in guinea pigs.Citation9 These studies imply that AREG expressions may be associated with eye elongation and AREG antibodies may be promising for myopia control. However, whether AREG is involved in the development of form-deprivation myopia (FDM), the classic and typical axial myopic model, has rarely been reported.
Current researches have revealed that axial elongation caused by scleral remodeling was the main pathological mechanism for the development of myopia. After receiving the abnormal visual signal through the retinal photoreceptor cells, the external visual signal is transmitted through a series of signal pathways through the retina and choroid, and eventually leads to scleral remodeling.Citation10,Citation11 Changes in the scleral thickness, fiber arrangement, and biological stress are significantly related to the increase of the axial length as a result of which the external parallel light fall in front of the retina rather than on the retina and thus myopia is formed.Citation12,Citation13 Therefore, sclera is the ultimate target tissue during the process of eye elongation. Lately, AREG was found to express in the retinal pigment epithelium and the inner nuclear layer of retina. However, whether AREG exists in the sclera and whether there are changes in its mRNA and protein levels during the development of FDM remain unclear.
Therefore, this study was designed to investigate the changes in AREG expression in the sclera of myopic eyes on the basis of FDM guinea pigs. The mRNA and protein expression levels of AREG at different time points over the course of FDM establishments and during recovery of FDM were measured to explore the possible role of AREG in myopia development.
Materials and methods
Animals
Two-week-old guinea pigs (English short-hair stock, tricolour strain, obtained from Songlian Biological Co., Ltd) with body weights of 100–120 g were raised in an environment with the temperature at 25–27°C, with a relative humidity of 55–65%, and with free access to a plentiful supply of food, water, and daily supplied fresh vegetables. All animal treatments were in accordance with the ARVO Statement for the Use of Animals in Ophthalmic and Vision Research and complied with the ARRIVE guideline. This study was approved by Shanghai Public Health Clinical Center Laboratory Animal Welfare & Ethics Committee (2020-A029-01).
Experimental design
Sixty-four 2-week-old guinea pigs were randomly divided into control group and FDM group (n = 8). The right eyes of the guinea pigs in FDM group were covered with translucent latex balloons, with their left eyes, noses, lips, and ears exposed. The right eyes were covered for 2 and 4 weeks, or were uncovered for 2 weeks after being covered for 4 weeks. Animals in the control group were raised in natural lighting without eye-covering.
Diopter and axial length measurements
Diopter was measured with streak retinoscopy (YZ24; 66 Vision Technology Co., Ltd.) in the dark room. Before measurement, tropicamide eye drops were used every 5 min for 4 times to fully dilate the pupils. Diopters were accurate to 0.01D and the mean average of 3 readings was considered the ultimate SE. A-scan ultrasound (OD1-AP, Kaixin Electronic Instrument Co., Ltd., Xuzhou, China) was used to measure the axial length (AL) after one drop of 0.5% proparacaine hydrochloride (Alcon, Belgium) being administered for anesthesia. The ultimate obtained value was the average of 10 separate measurements and was accurate to 0.01 mm. All measurements were taken from eight guinea pigs from two groups at different time points (before eye-covering (0 W), 2 and 4 weeks after eye-covering (2 W and 4 W), and following uncovering for 2 weeks after 4 weeks of coverage (6 W)). All the measurements were performed monocularly on the right eyes.
Tissue preparation
Guinea pigs were sacrificed after anesthesia with an overdose of pentobarbital sodium; then, the right eyes were removed, the anterior segment discarded, and the samples were placed on ice. The posterior sclera was excised with the head of the optic nerve discarded. Then, the tissues were fixed for 24 h in specialized fixation solutions for eyeballs provided by the EYE & ENT Hospital of Fudan University. Subsequently, the tissues were embedded in paraffin. For mRNA and protein detection, the collected posterior sclera was immediately frozen in liquid nitrogen and subsequently stored at −80°C until further analysis.
RNA extraction and reverse transcription quantitative PCR (RT-PCR)
Total RNA was extracted from the tissues of posterior sclera using the TRIzol reagent (Sangon Biotech Co., Ltd.) and a tissue RNA purification kit (ES-RN002plus; Yishan Biotechnology Co., Ltd.). Subsequently, the RNA was reverse transcribed to cDNA using the PrimeScriptTM RT Master Mix Kit (Takara Bio, Inc.) according to the manufacturer’s instructions. RT-qPCR analysis was performed using a real-time fluorescence quantitative PCR instrument (Applied Biosystems; Thermo Fisher Scientific, Inc.). The primer sequences used for the PCR are shown in . The PCR conditions were as follows: 95°C for 30 sec, followed by 40 cycles of 95°C for 5 sec and 60°C for 31 sec. The melting curves were used to assess and confirm the specificity of the products generated for each set of primers. Following amplification, the 2-ΔΔCt comparative method was used to analyze gene expression levels. The experiments were performed in triplicate. GAPDH was used as an internal control.
Table 1. The primer sequences
Immunofluorescence study
The sections were dewaxed and rehydrated, blocked, first incubated with the primary antibody against AREG (1:150, bs-3847 R, Bioss, China) overnight at 4°C and then with the secondary antibody (1:200, Alexa Fluor 594-conjugated donkey anti-rabbit, A-21207, Life Technologies, USA) for 60 minutes. After cell nuclei were stained with DAPI (D1714-QB04, Southern Biotech, China), the slides were covered with cover glasses. Finally, sections were analyzed using respective filters of a Leica SP5 confocal laser-scanning microscope (Leica, Germany) at the magnification of 63× and overlaid to generate a bicolor image. The primary antibody was omitted in a single-labeling study as the negative control. Z-wide pattern was used in the microscope to scan 4 layers within a certain height along the Z-axes. Four representative fields of each paraffin embedded tissue were imaged and the mean gray values of the AREG expression were measured by Image J software using Turlejski’sCitation14 procedure: (1) images were captured and converted to 8-bit scale; (2) grey scale images were then transformed into binary images using the threshold function; (3) set measurements limited to threshold and measure the mean gray value of each image. All images were captured by a blind investigator during the same session and using the same camera settings. Data are expressed as average pimonidazole labelling in arbitrary units (a.u.).
Western blotting
The frozen scleral tissues were mixed with 100 μL RIPA lysis buffer with PMSF according to the proportion of scleral tissue (20 mg) and were homogenized on ice with a tissue homogenizer. The suspension was left on ice for 15 min and then were centrifuged at 10000 rpm for 20 min at 4°C. Subsequently, the protein concentration was quantified by BCA method and the sample was boiled at 100°C for 10 min with a loading buffer (9173, Takara Bio, USA). Protein samples (20 μg) were separated by SDS-PAGE (10% gel) and transferred onto a polyvinyl difluoride (PVDF) membrane with 250 mA constant current for 70 min. After blocking with 5% non-fat diary milk in Tris-buffered saline containing 0.05% Tween-20 (TBST) for 1 h at room temperature, the PVDF membranes were incubated with the diluted anti-AREG antibody (1:500, bs-3847 R, Bioss, China) at 4°C overnight and then combined with the diluted second antibody (HRP-conjugated goat anti-rabbit IgG, 1:5000; 01334/10146, CoWin Biosciences, USA) at room temperature for 1 h. The signal was detected with an ECL detection system (ECL‑Plus; Merck KGAa). GAPDH served as an internal standard. The gray values of each band were calculated and for statistical analysis.
Statistical analysis
The SPSS 22.0 software was used to analyze the data. All the data were expressed as the mean±SEM. Differences at different time points in the same group were assessed by one-way ANOVA, followed by Bonferroni’s multiple comparison test. Differences between the control group and FDM group were performed by independent Student t-tests. P value <.05 was considered statistically significant.
Results
Diopter and axial length
Before onset of eye-covering (0 W), no significant difference was found between the control group and FDM group in diopter (p = .984) or AL (p = .868). In control group, the diopter slightly changed from hyperopia to emmetropia and the AL slightly increased. With form-deprivation, the diopter of the guinea pigs was gradually changed to myopia, with gradually increased myopic degree and AL. In comparison with control group, the difference in diopter and AL in FDM group was statistically significant at 2 W, 4 W, and 6 W (diopter: 2 W: p < .001; 4 W: p < .001; 6 W: p < .001; AL: 2 W: p = .003; 4 W: p = .003; 6 W: p = .001, n = 8) (Shown in ).
Table 2. Diopter and axial length in the right eyes of the two groups
AREG mRNA level in the posterior sclera
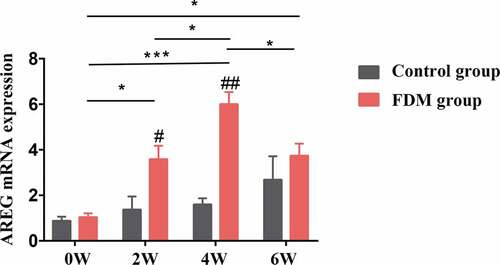
AREG mRNA in the posterior sclera was detected using RT-PCR assay (n = 4). As for FDM group, in comparison with that in 0 W, the mRNA level of AREG in the posterior sclera was gradually upregulated in 2 W (p = .025), 4 W (p < .001), and 6 W (p = .012) and the level decreased in 6 W(p = .037) in comparison with that in 4 W. Moreover, significant differences in AREG mRNA were found between FDM group and control group in 2 W (p = .036) and 4 W (p < .001), whereas there was no significant difference in 0 W and 6 W (p = .362, and p = .400, respectively) (). On the other hand, AREG mRNA slightly increased in control group while no significant difference was found at different time points in control group (all p > .05).
Figure 1. Expression of AREG mRNA in the posterior sclera by RT-PCR. AREG mRNA expression in FDM group was upregulated in 2 W, 4 W and slightly decreased after 2 weeks of recovery (6 W) (all p < .05), while no significant difference was found in AREG expression at different time points in control groups (all p > .05); AREG mRNA expression in FDM group was higher than that in control group in 2 W and 4 W (p = .036 and p < .001) but not in 0 W (p = .544) or 6 W (p = .364). AREG expression was normalized to GAPDH (n = 4); *p < .05 and ***p < .001: comparison between the two group, #p < .05 and ##p < .05 compared with the control group at the same time-point
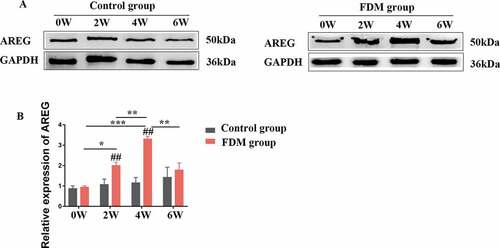
Expression of AREG protein in the posterior sclera
Expression of AREG protein in posterior sclera was detected by western blotting and immunofluorescence assay (both n = 4). In the sclera tissue of guinea pigs, AREG expressed in the cytoplasm and nuclear of fibroblasts, including the nuclei and cell membrane. Immunofluorescence semi-quantitative analysis showed that with the extension of eye-covering time, expression of AREG in posterior sclera gradually upregulated at 2 W, 4 W, and 6 W compared with 0 W (all p < .001). After 2 weeks of uncovering (6 W), the average gray value of AREG expression was downregulated compared to that in 4 W (p < .001) (), and was downregulated compared to the eyes with continuous covering for 6 weeks (Supplementary material). On the other hand, as for control group, AREG expression slightly increased over the course of the experiment, but no significant difference was found at different time points (All p > .05). Compared with control group, AREG expression was higher in FDM group in 2 W (p = .002), 4 W (p < .001), and 6 W (p = .004) but not in 0 W (p = .607). AREG expression was detected by western blotting in all groups (). With the prolongation of covered time, the protein expressions of AREG in the FDM group were gradually up-regulated at 2 W, 4 W, and 6 W compared to 0 W (p = .019, p < .001, p = .05, n = 4). After 2 weeks of uncovering (6 W), the protein expression of AREG was downregulated compared to that in 4 W (p = .001). On the other hand, as for control group, AREG expression slightly increased over the course of the experiment, but no significant difference was found at different time points (All p > .05, n = 4). Compared with control group, AREG expression was higher in FDM group in 2 W (p = .015), 4 W (p = .009) but not in 0 W (p = .456) or 6 W (p = .734).
Figure 2. Immunofluorescence and semi-quantification analysis of AREG expression in posterior sclera. Photographs of AREG protein expression in control group (a) and in FDM group (b) at each time point were shown. Blue staining is DAPI and red staining is AREG (scale bar: 25 μm). AREG was mainly located in the cytoplasm (white arrow) and nuclear (green arrow) of the fibroblasts, including the cytomembrane and nuclear membrane. (c) shows the average gray value of AREG expression at different time points in the two group. The data was expressed as mean±standard error. AREG protein expression in FDM group was upregulated in 2 W and 4 W and slightly downregulated after 2 weeks of recovery (6 W) (all p < .05), while no significant difference was found in AREG expression at the different time points in the control groups (all p > .05). AREG expression was higher in the FDM group than in the control group in 2 w, 4 w, and 6 W (all p < .05) but not in 0 W (p = .607). ***p < .001, comparison between the two groups; ##p < .01 and ###p < .001 compared with the control group at the same time-point
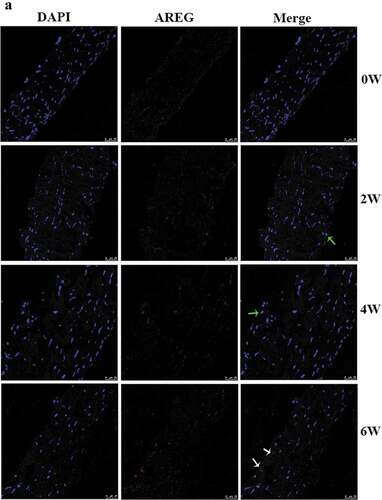
Figure 2. Continued
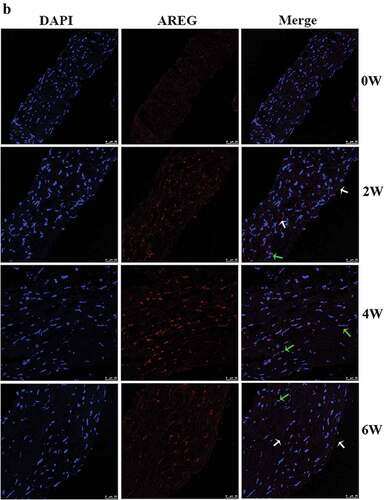
Figure 2. Continued
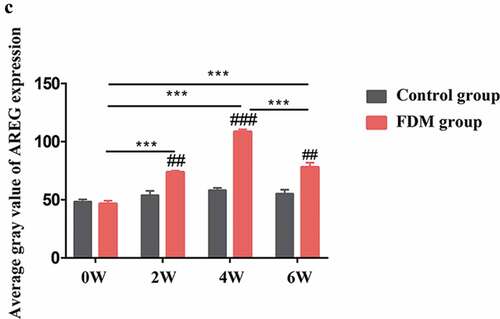
Figure 3. Expression of AREG protein in the posterior sclera by western blotting. (a): Representative western blot images; (b): Relative expression of AREG at different time points. The data was expressed as mean±standard error. AREG protein expression in FDM group was upregulated in 2 W, 4 W and slightly decreased after 2 weeks of recovery (6 W) (all p < .05, n = 4), while no significant difference was found in AREG expression at different time points in control groups (all p > .05, n = 4). AREG expression was higher in the FDM group than in the control group in 2 w and 4 w (both p < .05) but not in 0 W or 6 W (p = .456, p = .734). *p < .05, **p < .01 and ***p < .001, comparisons between the two groups; ##p < .01 compared with control group at the same time-point
Discussion
In this study, FDM was induced at different time points by masking the right eye with translucent latex balloons. The results showed that the degrees of myopia and AL significantly increased with elongation of the masking time and then slightly recovered after removal of eye-covering, which was in accordance with previous studies.Citation15,Citation16 One single eye-deprivation will induce anisometropia and interruption of binocular fusion, which may result in an interfering effect between experimental eyes and fellow eyes.Citation17 Therefore, only the right eyes of the guinea pigs were used in the present study to minimize the auto interference.
Nowadays, experimental evidences indicate that myopia is a common ocular condition manifested by excessive extension of the axial length and that sclera remodeling plays a crucial role in ocular elongation.Citation15,Citation18 Axial elongation is the most important changes during the progression of myopia.Citation19 Previous studies have found that AREG is of great importance in relative to eye elongation in lens-induced myopia (LIM) and primary myopia.Citation8,Citation9 Although the early experiments suggested that AREG may have a functional relationship with the molecular mechanisms in the retina and choroid, the regulatory mechanisms of scleral remodeling associated with AREG still need to be investigated. As shown by our results, scleral AREG expression was upregulated in FDM eyes and was related to the masking duration and recovery of FDM. To our knowledge, it is the first time to confirm AREG expression in scleral tissues of guinea pigs and its potential role in the development of FDM.
AREG is a ligand for epidermal growth factor receptor (EGFR) synthesized as a membrane-anchored precursor protein that behaves as an autocrine or paracrine factor.Citation5 It expressed on the cell surface with an extracellular EGF-like domain and an intracellular domain.Citation20 After AREG binding to the EGFR, the ectodomain activates the intracellular signal cascade reaction, and concomitantly induces migration of unshed proAREG from the plasma membrane to the nucleus, which mediates cell survival, proliferation, differentiation and movement and participates in various of physiological processes such as axonal and neuronal growth.Citation9,Citation21,Citation22 Similar to the previous reports, in this study, AREG was found located in the cytoplasm and the nuclei, as well as the membrane element of these two parts. However, how AREG functions on the downstream molecules and whether the nuclei translocation rate of AREG was associated with FDM requires further studies.
Jonas’sCitation9 study found AREG protein expression in retinal pigment epithelium and ciliary pigment epithelium in the eyes with LIM were upregulated compared with the normal eyes. Both retina AREG mRNA and EGFR mRNA were increased in LIM group. Furthermore, AREG antibody inhibited eye elongation in dose-dependent manner, indicating AREG antibody a potential treatment for myopia. In accordance with the tendency, both AREG mRNA and protein expression increased during the eye-covering time but slightly downregulated after removal of eye-covering, which implies AREG may be involved in the formation of FDM. Possible mechanisms may be relative to the dynamic changes of AREG. Firstly, AREG is known to regulate inflammation through the interaction with regulatory T cells and may be involved in the myopia progression in an animal model of allergic conjunctivitis-induced retinal inflammation.Citation23,Citation24 Thus, form-deprivation may induce many different factors produced by the retina and choroid such as inflammatory lipids, cytokines, and growth factors that acting as the stimuli to upregulate the transcription of AREG gene and its release.Citation9 Secondly, binding of AREG to EGFR may activate the extracellular signal-regulated kinase (ERK) signaling pathway, which is involved in many diseases such as chronic obstructive pulmonary diseases (COPD).Citation25 ERK was important in collagen synthesis in sclera. It was reported that ERK could be activated by cyclic adenosine monophosphate (cAMP), regulating the collagen synthesis in human scleral fibroblasts.Citation26 Our previous study indicated that ERK1/2 was involved in the formation of flickering-light induced myopia, another typical axial myopic model. Therefore, a reasonable assumption was that the increased AREG may participate in the ocular elongation via activation of ERK pathway. Finally, Christopher’sCitation27 study suggested AREG increased intracellular matrix metalloprotease-2 (MMP-2) levels via EGFR, regulating cell deaths. Since MMP-2 is a target molecule regulating scleral remodeling and axial length,Citation28 it deserves further exploration to reveal whether increased AREG expression has influence on MMP-2 level in the sclera.
In summary, this study discovered that AREG was expressed in the sclera of guinea pigs with FDM, and it was upregulated during development of FDM and a slightly downregulation after removal of the eye-covering. Based on these and the previous findings, it can be hypothesized that AREG is involved in myopia development, especially in ocular elongation. AREG may be a potential target for preventing and treating scleral remodeling in myopia. However, further studies investigating the mechanisms and functions of AREG in different experimental myopic models are necessary to clarify the role of AREG in myopia.
Supplemental Material
Download TIFF Image (10.2 MB)Disclosure statement
No potential conflict of interest was reported by the author(s).
Supplementary material
Supplemental data for this article can be accessed on the publisher’s website.
Correction Statement
This article has been republished with minor changes. These changes do not impact the academic content of the article.
Additional information
Funding
Related Research Data
References
- Morgan IG, French AN, Ashby RS, Guo X, Ding X, He M, Rose KA. The epidemics of myopia: aetiology and prevention. Prog Retin Eye Res. 2018;62:134–49. doi:10.1016/j.preteyeres.2017.09.004.
- Wu PC, Huang HM, Yu HJ, Fang PC, Chen CT. Epidemiology of Myopia. Asia-Pacific J Ophthalmol. 2016;5(6):386–93. doi:10.1097/APO.0000000000000236.
- Read SA, Collins MJ, Vincent SJ. Light exposure and eye growth in childhood. Investig Ophthalmol Vis Sci. 2015;56(11):6779–87. doi:10.1167/iovs.14-15978.
- Shoyab M, McDonald VL, Bradley JG, Todaro GJ. Amphiregulin: a bifunctional growth-modulating glycoprotein produced by the phorbol 12-myristate 13-acetate-treated human breast adenocarcinoma cell line MCF-7. Proc Natl Acad Sci USA. 1988;85(17):6528–32. doi:10.1073/pnas.85.17.6528.
- Berasain C, Avila MA. Amphiregulin. Semin Cell Dev Biol. 2014;28:31–41. doi:10.1016/j.semcdb.2014.01.005.
- Fan Q, Verhoeven VJ, Wojciechowski R, Barathi VA, Hysi PG, Guggenheim JA, Höhn R, Vitart V, Khawaja AP, Yamashiro K, et al. Meta-analysis of gene-environment-wide association scans accounting for education level identifies additional loci for refractive error. Nat Commun. 2016;7:11008. doi:10.1038/ncomms11008.
- Shaoyu L. The effect and molecular mechanism of amphiregulin on binocular lens induced and congenital myopia eye axial growth. Shandong: Shandong University of Traditional Chinese Medicine; China, 2018.
- Dong L, Shi XH, Kang YK, Wei WB, Wang YX, Xu XL, Gao F, Yuan LH, Zhen J, Jiang WJ, et al. Amphiregulin and ocular axial length. Acta Ophthalmol. 2019;97(3): e460-e470. doi: 10.1111/aos.14080.
- Jiang WJ, Song HX, Li SY, Guo B, Wu JF, Li GP, Guo DD, Shi L, Bi HS, Jonas JB. Amphiregulin antibody and reduction of axial elongation in experimental myopia. EBioMedicine. 2017;17:134–44. doi:10.1016/j.ebiom.2017.02.021.
- Harper AR, Summers JA. The dynamic sclera: extracellular matrix remodeling in normal ocular growth and myopia development. Exp Eye Res. 2015;133:100–11. doi:10.1016/j.exer.2014.07.015.
- Wu H, Chen W, Zhao F, Zhou Q, Reinach PS, Deng L, Ma L, Luo S, Srinivasalu N, Pan M, et al. Scleral hypoxia is a target for myopia control. Proc Natl Acad Sci USA. 2018;115(30): e7091-e7100. doi: 10.1073/pnas.1721443115.
- Metlapally R, Wildsoet CF. Scleral mechanisms underlying ocular growth and myopia. Prog Mol Biol Transl Sci. 2015;134:241–48.
- Meng B, Li SM, Zhan SY, Wang NL. Research advances in sclera-remodeling relevant gene polymorphisms related to myopia. Zhonghua Yan Ke Za Zhi. 2016;52:876–80.
- Turlejski T, Humoud I, Desai R, Smith KJ, Marina N. Immunohistochemical evidence of tissue hypoxia and astrogliosis in the rostral ventrolateral medulla of spontaneously hypertensive rats. Brain Res. 2016;1650:178–83. doi:10.1016/j.brainres.2016.09.012.
- Jiang B, Shi CS. Dynamic changes of periostin and collagen I in the sclera during progressive myopia in Guinea pigs. Arq Bras Oftalmol. 2020;83:190–95.
- Jiang B, Wu ZY, Zhu ZC, Ke GJ, Wen YC, Sun SQ. Expression and role of specificity protein 1 in the sclera remodeling of experimental myopia in Guinea pigs. Int J Ophthalmol. 2017;10:550–54.
- Smith EL 3rd, Hung LF, Arumugam B, Wensveen JM, Chino YM, Harwerth RS. Observations on the relationship between anisometropia, amblyopia and strabismus. Vis Res. 2017;134:26–42. doi:10.1016/j.visres.2017.03.004.
- Li M, Yuan Y, Chen Q, Me R, Gu Q, Yu Y, Sheng M, Ke B. Expression of Wnt/beta-Catenin signaling pathway and its regulatory role in type I collagen with TGF-beta1 in scleral fibroblasts from an experimentally induced myopia guinea pig model. J Ophthalmol. 2016;2016:5126560. doi:10.1155/2016/5126560.
- Moriyama M, Ohno-Matsui K, Modegi T, Kondo J, Takahashi Y, Tomita M, Tokoro T, Morita I. Quantitative analyses of high-resolution 3D MR images of highly myopic eyes to determine their shapes. Invest Ophthalmol Vis Sci. 2012;53(8):4510–18. doi:10.1167/iovs.12-9426.
- Tanaka H, Nishioka Y, Yokoyama Y, Higashiyama S, Matsuura N, Matsuura S, Hieda M. Nuclear envelope-localized EGF family protein amphiregulin activates breast cancer cell migration in an EGF-like domain independent manner. Biochem Biophys Res Commun. 2012;420(4):721–26. doi:10.1016/j.bbrc.2012.03.045.
- Shoyab M, Plowman GD, McDonald VL, Bradley JG, Todaro GJ. Structure and function of human amphiregulin: a member of the epidermal growth factor family. Science. 1989;243(4894 Pt 1):1074–76. doi:10.1126/science.2466334.
- Modrell B, McDonald VL, Shoyab M. The interaction of amphiregulin with nuclei and putative nuclear localization sequence binding proteins. Growth Factors. 1992;7(4):305–14. doi:10.3109/08977199209046413.
- Wei CC, Kung YJ, Chen CS, Chang CY, Lin CJ, Tien PT, Chang HY, Chen HJ, Huang YS, Lin HJ, et al. Allergic conjunctivitis-induced retinal inflammation promotes myopia progression. EBioMedicine. 2018;28:274–86. doi:10.1016/j.ebiom.2018.01.024.
- Zaiss DMW, Gause WC, Osborne LC, ArtisD. Emerging functions of amphiregulin in orchestrating immunity, inflammation, and tissue repair. Immunity. 2015;42(2):216–26. doi:10.1016/j.immuni.2015.01.020.
- Rumelhard M, Ramgolam K, Auger F, Dazy AC, Blanchet S, Marano F, Baeza-Squiban A. Effects of PM2.5 components in the release of amphiregulin by human airway epithelial cells. Toxicol Lett. 2007;168(2):155–64. doi:10.1016/j.toxlet.2006.11.014.
- Tao Y, Pan M, Liu S, Fang F, Lu R, Lu C, Zheng M, An J, Xu H, Zhao F, et al. cAMP level modulates scleral collagen remodeling, a critical step in the development of myopia. PloS One. 2013;8(8):e71441. doi:10.1371/journal.pone.0071441.
- Platen C, Dreschers S, Reiss LK, Wappler J, Orlikowsky TW. Amphiregulin regulates phagocytosis-induced cell death in monocytes via EGFR and matrix metalloproteinases. Mediators Inflamm. 2018;2018:4310419. doi:10.1155/2018/4310419.
- Zhao F, Wu H, Reinach PS, Wu Y, Zhai Y, Lei Y, Ma L, Su Y, Chen Y, Li F, et al. Up-regulation of matrix metalloproteinase-2 by scleral monocyte-derived macrophages contributes to myopia development. Am J Pathol. 2020;190(9):1888–908. doi:10.1016/j.ajpath.2020.06.002.