
Abstract
Purpose
To investigate the optic nerve head (ONH) blood flow, retinal vessel diameters, and retinal ganglion cell (RGC) loss after systemic administration of aldosterone in rats.
Methods
Aldosterone (80 µg/kg/day) or vehicle was administered using an osmotic minipump in Brown Norway rats. The mean blur rate in the vessel (MV) and tissue (MT) regions and retinal vessel diameters in the ONH were measured by laser speckle flowgraphy before and 1, 2, and 4 weeks after administration of aldosterone or vehicle. Intraocular pressure (IOP), blood pressure, and heart rate were recorded. The retrogradely labeled RGCs were counted in the retinal flatmounts prepared 5 weeks after treatment.
Results
The MV and MT in the aldosterone group significantly decreased at 2 and 4 weeks (MV: 2 weeks, p = 0.001, 4 weeks, p < 0.001; MT: 2 weeks, p = 0.02, 4 weeks, p = 0.03). The artery and vein diameters significantly decreased at 1, 2, and 4 weeks in the aldosterone group (all p < 0.001). The MV, MT, and vessel diameters remained unchanged in the vehicle group. Other parameters did not change over time in either group. RGC counts were significantly lower in the aldosterone group than in the vehicle group (p < 0.001).
Conclusions
ONH blood flow decreased following retinal vessel constriction without changes in IOP or blood pressure in a possible rat model of RGC loss by systemic administration of aldosterone.
Introduction
In recent years, many studies have shown that aldosterone exposure deteriorates pathological changes in various disease models, including ocular diseases and nervous system disorders. In rodent models for choroidal and retinal vascular diseases, the intraocular injection of aldosterone caused choroidal vasodilationCitation1 and increased retinal thickness.Citation2 Moreover, systemic aldosterone administration caused severe retinal edema and extensive hemorrhage in a rodent model of retinal vein occlusionCitation3 and exacerbated angiogenesis in a rodent model of oxygen-induced retinopathy.Citation4 Aldosterone plays a major role in the control of extracellular volume homeostasis and vascular tone.Citation5 However, the effects of aldosterone administration on retinal blood flow remain unknown.
Recently, intravitreal injection or systemic administration of aldosterone was shown to cause a decrease in the number of retinal ganglion cells (RGCs)Citation6–8 without changes in other retinal layers and intraocular pressure (IOP).Citation8 Therefore, aldosterone administration in rats may be a model of loss of RGCs mimicking normal tension glaucoma.Citation8 Our group reported that patients with primary aldosteronism, the most common form of secondary hypertension due to excess production of aldosterone from the adrenal glands, had more retinal nerve fiber layer defects, a characteristic glaucoma-related fundus abnormality due to RGC loss, than normal controls.Citation9 Since IOP is the primary determinant of glaucomatous optic neuropathy (GON), eyes with higher IOP should have more advanced glaucomatous damage than the fellow eyes in patients with bilateral glaucoma. In these cases, we demonstrated that blood flow in the optic nerve head (ONH) was comparable between fellow eyes. In contrast, in patients with more advanced visual field defects in the eyes with lower IOP, but not in those with higher IOP, blood flow in the ONH was even more reduced in eyes with higher visual field damage.Citation10 These results indicate blood flow impairment as an IOP-independent determinant of GON, although another unknown causative factor may be involved in the findings. Aldosterone may cause RGC loss by compromising blood flow in the ONH. However, intraocular blood flow changes have not been addressed in a possible rat model of RGC loss by aldosterone administration.
In the current study, we investigated the effects of aldosterone on ONH blood flow in a possible rat model of RGC loss by systemic administration of aldosterone using laser speckle flowgraphy (LSFG).
Materials and methods
Animals
Male pigmented Brown Norway (BN) rats, 20 weeks of age, were used in this experiment (Total; n = 22). The rats were permitted free access to food and water and were maintained in cages under environmentally controlled conditions (12-h light–dark cycle). All animals were treated in accordance with the ARVO Statement for the Use of Animals in Ophthalmic and Vision Research. The experimental procedures were approved by the Committee on Animal Experimentation of Kanazawa University (approval number: 183922).
Experimental protocols
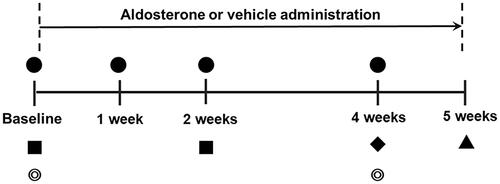
An overview of the experimental schedule is presented in . At baseline and at 1, 2, and 4 weeks after systemic administration of aldosterone or vehicle, the MBR, vessel diameter, IOP, blood pressure, and heart rate were measured, starting at 15:00. Fundus photographs (VersaCam DS-10; NIDEK Co., Ltd. Aichi, Japan) were taken immediately before the LSFG measurements at baseline and 4 weeks after treatment. In each session, blood pressure and heart rate were measured, and the rats were anesthetized with intraperitoneal pentobarbital injection (65 mg/kg; Somnopentil; Schering-Plough Animal Health, Omaha, NE, USA). The right eye was dilated with 0.4% tropicamide ophthalmic solution (Mydrin-M; Santen Pharmaceuticals Co., Ltd., Osaka, Japan). The rats were then placed on a heating pad (Hoonnkunn; Midori-Shoukai, Tokyo, Japan). The MBR, vessel diameter, and IOP were measured 20 min after induction of general anesthesia. After the last measurement session, dye injections for retrograde staining of RGCs were performed in both the eyes. One week later, the rats were sacrificed, and RGC density was assayed using flat-mounted retinas. Plasma aldosterone concentrations were measured before and 2 weeks after the systemic administration of aldosterone.
Figure 1. Time schedule of the experimental protocol. ●: Measurements of blood pressure, heart rate, intraocular pressure and laser speckle flowgraphy. ■: Measurement of plasma aldosterone concentrations. ◎: Fundus photography. ♦: Injection of Fast Blue into the superior colliculus. ▲: Retinal flatmount preparation for quantification of retinal ganglion cells.
Systemic administration of aldosterone and measurement of plasma aldosterone
Osmotic minipumps were implanted subcutaneously to deliver aldosterone or vehicle after baseline LSFG measurements. Aldosterone (Sigma-Aldrich, St. Louis, MO, USA) was administered using a subcutaneous osmotic minipump (Alzet model 2004, DURECT Corporation, Cupertino, CA, USA). The minipumps were implanted subcutaneously in the dorsum of the neck region for 4 weeks to deliver an aldosterone dose of 80 µg/kg/d (n = 13) or vehicle (n = 9). The concentration of plasma aldosterone (pg/mL) in rats was determined by a solid-phase radioimmunoassay (ALP Inc. Ishikawa, Japan) at baseline and 2 weeks after starting aldosterone treatment (n = 7).
Measurement of blood flow in the Optic Nerve Head (ONH) and diameter of blood vessels with LSFG
Blood velocity in the ONH was assessed using an LSFG-Micro device (Softcare Co., Ltd., Fukutsu, Japan). LSFG is a noninvasive imaging technique that assessed in vivo blood flow using the laser speckle phenomenon; it was approved for clinical use in Japan in 2008. The LSFG-Micro was developed for rodent experiments in 2016. We previously reported that LSFG-Micro provided reliable measurements of ONH circulation in rats.Citation11 Briefly, the system uses an ordinary charge-coupled device (600 × 480 pixels) camera equipped with a diode laser (wavelength 830 nm). The images of the mean blur rate (MBR) and the relative velocity index of erythrocyte movements, were acquired continuously at a rate of 30 frames per second over a 4-s period, and a composite map of ocular blood flow was created. Measurements were performed three times consecutively, and the average MBR was calculated. In the ONH area, within a 1.37 mm diameter circle centered on the ONH, the LSFG software automatically segmented out the vessel region using the definitive threshold for the MBR (). Thus, the MBR was determined separately for the vessel area (MV, mean value in the vessel area) and tissue area (MT, mean value in the tissue area).
Figure 2. Representative images of rat fundus around the optic nerve head and measurements of retinal vessel diameters using LSFG-Micro. (A) Representative color-coded blood flow map produced by LSFG-Micro. The white circle shows a rubber band – the region of interest to measure MBR by LSFG in the optic nerve head. (B) Binary image for automated segmentation between the visible vessel area (white) and tissue area (black), using LSFG analysis software. (C) Representative fundus photographs of a normal rat used in this study. (D) Total retinal artery and vein analysis in the same rat retina as (C). The rectangular areas were set semiautomatically to the vessels. (E,F) show the vessel diameter index in rectangles 1 and 2, respectively. A: Artery; LSFG: laser speckle flowgraphy; MBR: mean blur rate; V: Vein.
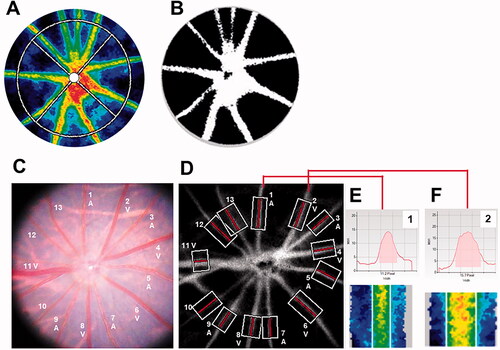
Total retinal artery and vein analysis (TRAVA) provides parameters of major retinal vessels around the ONH semiautomatically. The principles and procedures of TRAVA have been published in detailCitation12 and showed good reproducibility in rodents.Citation13 The rectangular area was set for individual major vessels around the ONH automatically, and we selected the vessels that were straight and clearly visible in all experimental sessions. The retinal vessels were divided into arteries and veins by referring to the color and diameter of vessels in the fundus photographs (). TRAVA measurements were repeated three times consecutively, and the average values were determined for each vessel.
Measurement of IOP and blood pressure
The IOP was measured using a handheld tonometer (TonolabTV02, M.E. Technica, Tokyo) in the right eye of each animal (mean of three measurements per eye) before MBR measurement (prior to the application of hydroxyethyl cellulose gel and a cover glass). Mean blood pressure and heart rate were measured at the tail using an automatic sphygmomanometer (BP-98; Softron, Tokyo, Japan) without anesthesia. Ocular perfusion pressure (OPP) was calculated using the following formula: OPP = 2/3 mean blood pressure – IOP.
Retrograde labeling of RGCs and preparation of retinal flatmounts
Retrograde labeling of RGCs was achieved by injecting a fluorescent dye into the superior colliculus. The skull was exposed by a dental drill, and Fluorogold 3% (Wako Pure Chemical Corporation, Osaka, Japan) was injected at a point 6.8 mm caudal to the bregma and 1.5 mm lateral to the midline on both sides to a depth of 3.6 mm from surface of the skull. One week after Fluorogold application (5 weeks after administration of aldosterone), the rats were sacrificed by intraperitoneal injection of an overdose of pentobarbital (200 mg/kg). After the eyes were enucleated, the retina was flattened on a glass slide, covered with an anti-fade mounting solution (VECTASHIELD; Vector Laboratories, Inc., Burlingame, CA) and a glass coverslip, and kept in the dark at 4 °C until microscopic observation (aldosterone group, n = 9; vehicle, n = 7). The retinal flatmounts were viewed using a fluorescence microscope (BZ-9000, Keyence, Osaka, Japan). Fluorogold-labeled RGCs were manually counted in a masked fashion by the same investigator in areas of 2000 µm from the center of the optic disc in each quadrant (4 areas per eye, 1.58 mm2 each).
Statistical analysis
Data are expressed as mean ± standard deviation as all variables met normality per the Shapiro–Wilk test. Statistical analyses were performed using Stata software (version 17.0; StataCorp, TX, USA). Differences in the temporal changes in MV, MT, IOP, mean arterial pressure, heart rate, OPP, and vessel diameters were analyzed as repeated measures by mixed effects models for comparisons between different time points in each group or between aldosterone and vehicle groups. A mixed effects model includes both fixed and random effects, which represent population-average and subject-specific effects, respectively. The model accounts for the correlation between repeated measurements or between different vessels in the same eye. The differences in retrogradely labeled RGCs in retinal flatmounts were compared using a two-sample t-test between aldosterone and vehicle groups. The differences in average plasma aldosterone concentrations before and after systemic administration of aldosterone were compared using a paired t-test. The association between an increase in plasma aldosterone and changes in various measurements was analyzed using linear regression or mixed-effects models. Differences were considered statistically significant at p < 0.05. The adjusted p-values by Bonferroni correction were used for multiple comparisons.
Results
Effects of aldosterone on ONH blood flow and vessel diameters in rats
The changes in the MBR and fundus images are shown in and . The mean baseline MBR values were 14.15 ± 1.48 and 13.68 ± 1.56 (MV), 3.39 ± 0.71 and 3.51 ± 0.78 (MT), in the aldosterone-treated and vehicle groups, respectively (). There was no significant difference in the baseline MBR values between the two groups. The MV and MT in the aldosterone-treated rats significantly decreased at 2 and 4 weeks (MV: 2 weeks, p = 0.001, 4 weeks, p < 0.001; MT: 2 weeks, p = 0.02, 4 weeks, p = 0.03). The MV in the aldosterone group at 4 weeks was significantly lower than that at 1 week (p < 0.001). The MV and MT in the aldosterone group were significantly lower than those in the vehicle group (MV: 2 weeks, p = 0.006, 4 weeks, p = 0.011; MT: 2 and 4 weeks, p = 0.04). There were no significant changes in the MV and MT over time in the vehicle group.
Figure 3. Representative color-coded maps of optic nerve head blood flow by LSFG-Micro and fundus photos in systemic aldosterone-treated rats. Blood flow image in the optic nerve head obtained before administration (baseline, A) and 1 (B), 2 (C), and 4 (D) weeks after administration of aldosterone. The color scale is shown at the bottom right. Fundus photographs taken before (E) and 4 weeks after (F) systemic administration of aldosterone in the same eye as (A–D). LSFG: laser speckle flowgraphy.
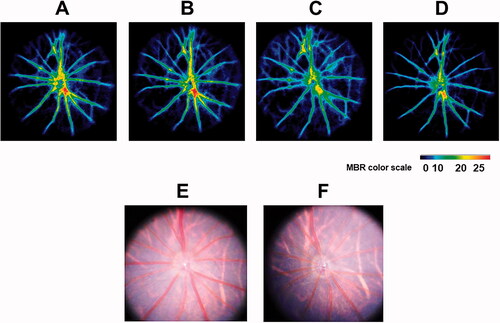
Figure 4. Changes in the MBR in the optic nerve head and retinal vessel diameter from baseline after systemic administration of aldosterone or vehicle for 4 weeks. Changes in the MV (A) and MT (B) are shown (aldosterone group, n = 13; vehicle, n = 9). Changes in the diameter of arteries (C) and veins (D) are shown (aldosterone group, n = 13; 48 arteries, 49 veins. vehicle, n = 9; 41 arteries, 43 veins). Error bars denote 95% confidence interval (A, B, C, D). Significant changes are indicated (*p < 0.05, †p < 0.01, ‡p < 0.001; Bonferroni correction for multiple comparisons). MBR: mean blur rate; MV: mean blur rate in the vessel; MT: mean blur rate in the tissue.
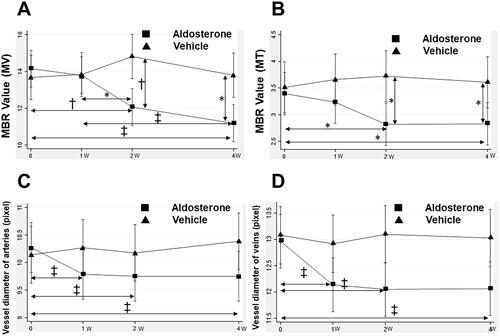
A total of 48 arteries and 49 veins from 13 eyes in the aldosterone group (7.5 vessels/eye) and 41 arteries and 43 veins from 9 eyes in the control group (9.3 vessels/eye) were analyzed for vessel diameter measurement. The mean vessel diameters at baseline were 10.19 ± 1.03 and 10.06 ± 1.22 for arteries, and 12.94 ± 1.73 and 13.08 ± 1.82 for veins, in the aldosterone and vehicle groups, respectively (). There was no significant difference in the baseline vessel diameters between the two groups. The artery and vein diameters in the aldosterone-treated rats significantly decreased from baseline at 1, 2, and 4 weeks (p < 0.001 each). In contrast, the artery and vein diameters in the vehicle group did not change significantly during the experimental period.
IOP and blood pressure
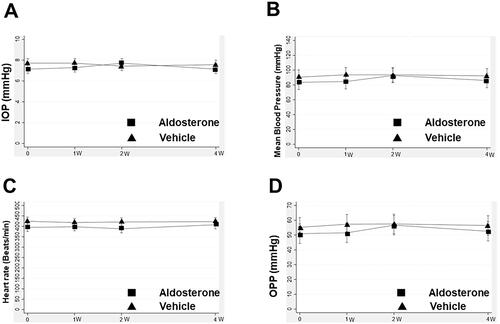
shows the mean changes in IOP, mean arterial pressure, heart rate, and OPP over time. These parameters did not change significantly during the experimental period in either group.
Figure 5. Change in IOP, mean arterial pressure, heart rate, and OPP after systemic administration of aldosterone or vehicle for 4 weeks. Changes in IOP (A), mean arterial pressure (B), heart rate (C), and OPP (D) are shown. Error bars denote the 95% confidence intervals (aldosterone group, n = 13; vehicle, n = 9). IOP: intraocular pressure; OPP: ocular perfusion pressure.
Loss of RGCs and plasma aldosterone concentration in aldosterone-treated rats
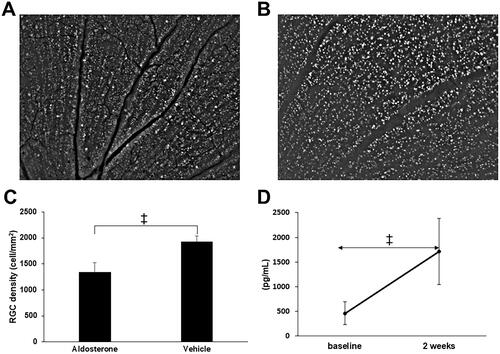
Representative images of retrogradely labeled RGCs in the aldosterone and vehicle groups are shown in . The number of RGCs (cells/mm2) was significantly lower in the aldosterone-treated rats than in the vehicle-treated rats (1342 ± 181 vs. 1932 ± 107, p < 0.001, ). Plasma aldosterone concentrations (pg/mL) at 2 weeks were significantly increased from baseline in the aldosterone-treated rats (1710.7 ± 724.0 vs. 463.6 ± 248.6, p < 0.001, ).
Figure 6. RGC loss and plasma aldosterone level after systemic administration of aldosterone. Retrogradely labeled RGCs in the aldosterone group (A) and vehicle (B). (C) RGC density in retinal flatmounts prepared 5 weeks after systemic administration of aldosterone or vehicle (aldosterone group, n = 9; vehicle, n = 7). (D) Plasma aldosterone concentration before and 2 weeks after systemic administration of aldosterone (n = 7). Data are presented as the mean ± standard deviation. Paired t-test. †p < 0.01, ‡p < 0.001. RGC: retinal ganglion cell.
Association of increase in plasma aldosterone with changes in various measurements
The MT and MV changes and RGC counts were not related to the degree of increase in plasma aldosterone levels (). In contrast, a greater increase in plasma aldosterone was significantly associated with more constriction of arteries at 1 week (p = 0.02) and with less constriction of veins at 2 and 4 weeks (all p < 0.001).
Table 1. Association of increase in plasma aldosterone with changes in various measurements.
Discussion
The 4-weeks systemic administration of aldosterone in rats caused an ONH blood flow decrease following retinal vessel constriction without changes in IOP or blood pressure. Thunhorst et al.Citation14 reported that systemic administration of aldosterone at a dose of 60 µg/kg/d caused an immediate, simultaneous increase in the saline intake (0.3 M NaCl) and the mean blood pressure in BN rats. However, we provided rats with water instead of saline, which prevented an increase in blood pressure in our experiments with an aldosterone dose of 80 µg/kg/d in the same rat strain. The stable IOP after aldosterone administration was consistent with a previous report of systemic administration of aldosterone (80 µg/kg/d) for 4 weeks in Sprague–Dawley rats.Citation8 Given the unchanged IOP and blood pressure, hemodynamic changes in the ONH by aldosterone were independent from ocular perfusion pressure or systemic hemodynamic status.
Aldosterone has various effects on the vascular endothelial cells and vascular smooth muscle cells.Citation15 As for in vitro studies, it has been reported that aldosterone causes rapid, increase in intracellular calcium in cultured rat smooth muscle cellsCitation16 and cultured porcine endothelial cells.Citation17 In ex vivo studies, aldosterone caused vasoconstriction by calcium mobilization in rabbit afferent and efferent arteries of the glomerulus.Citation18 Moreover, aldosterone induced gene expression of endothelin 1 (ET-1), a vasoconstrictor peptide synthesized by vascular endothelial cells, in rat kidney and colon through activation of mineralocorticoid receptors (MRs).Citation19 ET-1 induced dose-dependent vasoconstriction in isolated porcine retinal veins.Citation20 Angiotensin II Type-1 receptor in the endothelium was also reported to mediate aldosterone-induced vasoconstriction in isolated rat coronary arteries.Citation21 In contrast, aldosterone caused nitric-oxide (NO)-mediated, endothelium-dependent rapid dilatation in isolated rat mesenteric and cerebral arterioles.Citation22 Thus, aldosterone has both vasoconstrictor and vasodilator mechanisms in the blood vessels. The response to aldosterone may depend on the exposure time and endothelium status; the acute response to aldosterone can be either vasoconstriction or vasodilatation, whereas the chronic response is predominantly vasoconstriction.Citation23,Citation24 To the best of our knowledge, this is the first report showing that chronic systemic administration of aldosterone causes vasoconstriction of rat retinal arteries and veins in vivo.
Aldosterone has been shown to cause blood flow changes in experimental models and humans. Fujita et al.Citation25 reported that acute infusion of aldosterone into the left anterior descending coronary artery decreased coronary blood flow in the open chest dogs. In humans, Romagni et al.Citation26 reported that aldosterone decreased forearm blood flow as a rapid effect when aldosterone was infused into the antecubital vein of the arm. In contrast, Schmidt et al.Citation27 reported that aldosterone increased forearm blood flow as a rapid effect when infused into the brachial artery. The direct vascular action of aldosterone is complicated, given that aldosterone influences not only vessels, but also cardiac function. In the present study, systemic administration of aldosterone caused a significant reduction in ONH blood flow starting from 2 weeks. Given that blood pressure and pulse rate were stable throughout the experimental period, the reduction in ONH blood flow following vessel constriction in this study reflects the local effects of aldosterone on vessels in rat ONH.
In our study, the number of RGCs decreased 5 weeks after systemic administration of aldosterone at a dose of 80 µg/kg/d. Previous studies have also shown that intravitreal injection or systemic administration of aldosterone causes RGC loss in Sprague-Dawley rats.Citation6–8 The RGC loss was suppressed by the administration of MR antagonists, spironolactone, indicating MR-mediated cell death.Citation6,Citation8 Given that RGCs are representative cells showing MR expressionCitation2 and the retinal damage in this model is relatively RGC-specific,Citation8 MRs in RGCs may have contributed to the RGC loss by aldosterone. Of note, MRs in the brain are expressed preferentially in the neurons of limbic regions, including the hippocampus,Citation28 which are reported to have a neuroprotective role against cerebral ischemia.Citation29 Although the physiological and pathological roles of MRs in RGCs are currently unknown, MRs expressed in RGCs themselves may not be detrimental for RGC survival after aldosterone administration. However, MRs are also expressed in the retinal vessels and glial cells.Citation2 Recently, systemic administration of aldosterone was reported to increase the density of retinal microglia in a rat model of oxygen-induced retinopathy.Citation30 Overactivation of microglia is thought to exert neurotoxicity by releasing reactive oxygen species (ROS) in neurodegenerative diseases.Citation31 Therefore, RGC loss after aldosterone administration may be caused by neurotoxic effects exerted by other neighboring cells.
Hemodynamic changes after aldosterone administration appeared first as retinal vessel constriction at 1 week, which was followed by a decrease in ONH blood flow at 2 weeks. Although we confirmed RGC loss at 5 weeks in this model, Nitta et al.Citation8 reported a gradual RGC loss starting from 2 weeks after systemic administration of aldosterone (80 µg/kg/d) in Sprague–Dawley rats. Therefore, RGC loss may be attributed to blood flow reduction by aldosterone-induced retinal vessel constriction. Chronic exposure to aldosterone impairs endothelial function by decreasing NO synthesis and ROS production.Citation23 Although the local vascular effects of aldosterone in the retina may have contributed to blood flow impairment and RGC loss, preferential cell death in RGCs may not be explained by vascular damage alone.
Plasma aldosterone increase was positively correlated with arterial constriction at 1 week, which may be the direct vascular effect of aldosterone on retinal arteries, whereas it was negatively correlated with venous constriction at 2 and 4 weeks; thus, a larger increase in plasma aldosterone suppressed venous constriction. Although RGC loss was not correlated with aldosterone increase in this study, Takasago et al.7 reported that higher plasma aldosterone concentration was associated with larger RGC loss.Citation7 MR overactivation in hippocampal neurons activates microglia and pro-inflammatory mediators, which exacerbates neural damage.Citation32 Therefore, less vasoconstriction in retinal veins at 2 and 4 weeks in rats with a higher plasma aldosterone level, as shown in , suggests the presence of a higher inflammatory response leading to retinal vein dilatation caused by a larger increase in plasma aldosterone.
In the present study, we used pigmented BN rats, because LSFG measurements are difficult in the fundus of albino rats, such as Sprague–Dawley rats, because of the absence of melanin pigments that block high speckle signals from the choroid. However, BN rats were reported to have a gain of function mutation in the MR gene, which induced greater transactivation of MR by aldosterone than Fisher 344 rats.Citation33 Moreover, in a two-kidney, one-clip hypertensive rat model, BN rats showed greater MR gene expression and greater renal fibrosis than Lewis or ACI rats despite the comparable increase in blood pressure between the three rat strains.Citation34 As such, it is expected that RGC loss by aldosterone in BN rats may be greater than that in Sprague–Dawley rats. However, the RGC survival at 5 weeks in our study with BN rats (70%) was comparable to that in the study by Nitta et al. with Sprague–Dawley rats (60–70%).Citation8 Thus, BN rats may be useful for studying the effects of aldosterone administration on RGC loss when fundus imaging by LSFG is needed.
The present study has some limitations. First, we measured vessel diameters using LSFG, which may not be accurate, given that the procedure may be affected by the level of blood flow. In clinical studies, fundus photographs are used in the standard method to measure vessel diameters.Citation35 We took fundus photos using an indirect ophthalmoscopy. The resolution of the fundus images was insufficient to accurately measure vessel diameters. Furthermore, retinal vessel diameter may also be influenced by general anesthesia. All fundus photographs were taken during the same period of time after induction of general anesthesia to minimize the influence of the depth of anesthesia. Second, we studied the effects of systemic administration of aldosterone on ONH blood flow for 4 weeks. A longer duration of aldosterone exposure may have more significant effects on vessel diameters or the MBRs. Third, we did not measure the concentration of aldosterone in the eyes after systemic administration of aldosterone. Kobayashi et al.Citation6 showed that aldosterone level in the vitreous humor was 4200 pg/mL 2 weeks after systemic administration of 80 µg/kg/d. The relationship between the local concentration of aldosterone and ONH blood flow may provide valuable information for understanding the exact mechanism of blood flow changes induced by aldosterone. Because the mechanism of RGC loss in this model remains unclear, further studies, such as immunohistochemistry for RGC characterization and electroretinography, are needed to validate the model as a rat model of RGC loss.
In conclusion, we showed retinal vessel constriction followed by a decrease in ONH blood flow without changes in IOP or blood pressure in a possible rat model of RGC loss by systemic administration of aldosterone. Although local blood flow impairment was associated with RGC loss, further studies are warranted to elucidate the mechanism of preferential cell loss in RGCs in this model.
Acknowledgments
The authors thank Sachiyo Hatake for her assistance with animal husbandry and maintenance.
Disclosure statement
No potential conflict of interest was reported by the author(s).
Data availability statement
The data that support the findings of this study are available from the corresponding author [T.H.], upon reasonable request.
Additional information
Funding
References
- Zhao M, Célérier I, Bousquet E, Jeanny JC, Jonet L, Savoldelli M, Offret O, Curan A, Farman N, Jaisser F, et al. Mineralocorticoid receptor is involved in rat and human ocular chorioretinopathy. J Clin Invest. 2012;122(7):2672–2679.
- Zhao M, Valamanesh F, Celerier I, Savoldelli M, Jonet L, Jeanny JC, Jaisser F, Farman N, Behar-Cohen F. The neuroretina is a novel mineralocorticoid target: aldosterone up-regulates ion and water channels in Müller glial cells. FASEB J. 2010;24(9):3405–3415.
- Allingham MJ, Tserentsoodol N, Saloupis P, Mettu PS, Cousins SW. Aldosterone exposure causes increased retinal edema and severe retinopathy following laser-induced retinal vein occlusion in mice. Invest Ophthalmol Vis Sci. 2018;59(8):3355–3365.
- Wilkinson-Berka JL, Tan G, Jaworski K, Harbig J, Miller AG. Identification of a retinal aldosterone system and the protective effects of mineralocorticoid receptor antagonism on retinal vascular pathology. Circ Res. 2009;104(1):124–133.
- Hatakeyama H, Miyamori I, Fujita T, Takeda Y, Takeda R, Yamamoto H. Vascular aldosterone. Biosynthesis and a link to angiotensin II-induced hypertrophy of vascular smooth muscle cells. J Biol Chem. 1994;269(39):24316–24320.
- Kobayashi M, Hirooka K, Ono A, Nakano Y, Nishiyama A, Tsujikawa A. The relationship between the renin-angiotensin-aldosterone system and NMDA receptor-mediated signal and the prevention of retinal ganglion cell death. Invest Ophthalmol Vis Sci. 2017;58(3):1397–1403.
- Takasago Y, Hirooka K, Nakano Y, Kobayashi M, Ono A. Elevated plasma aldosterone levels are associated with a reduction in retinal ganglion cell survival. J Renin Angiotensin Aldosterone Syst. 2018;19(3):1470320318795001.
- Nitta E, Hirooka K, Tenkumo K, Fujita T, Nishiyama A, Nakamura T, Itano T, Shiraga F. Aldosterone: a mediator of retinal ganglion cell death and the potential role in the pathogenesis in normal-tension glaucoma. Cell Death Dis. 2013;4(7):e711.
- Ohshima Y, Higashide T, Sakaguchi K, Sasaki M, Udagawa S, Ohkubo S, Yoneda T, Sugiyama K. The association of primary aldosteronism with glaucoma-related fundus abnormalities. PLoS One. 2020;15(11):e0242090.
- Yamada Y, Higashide T, Udagawa S, Takeshima S, Sakaguchi K, Nitta K, Sugiyama K. The relationship between interocular asymmetry of visual field defects and optic nerve head blood flow in patients with glaucoma. J Glaucoma. 2019;28(3):231–237.
- Wada Y, Higashide T, Nagata A, Sugiyama K. Longitudinal changes in optic nerve head blood flow in normal rats evaluated by laser speckle flowgraphy. Invest Ophthalmol Vis Sci. 2016;57(13):5568–5575.
- Shiga Y, Asano T, Kunikata H, Nitta F, Sato H, Nakazawa T, Shimura M. Relative flow volume, a novel blood flow index in the human retina derived from laser speckle flowgraphy. Invest Ophthalmol Vis Sci. 2014;55(6):3899–3904.
- Tamplin MR, Broadhurst KA, Vitale AH, Hashimoto R, Kardon RH, Grumbach IM. Longitudinal testing of retinal blood flow in a mouse model of hypertension by laser speckle flowgraphy. Transl Vis Sci Technol. 2021;10(2):16.
- Thunhorst RL, Xue B, Beltz TG, Johnson AK. Age-related changes in thirst, salt appetite, and arterial blood pressure in response to aldosterone-dexamethasone combination in rats. Am J Physiol Regul Integr Comp Physiol. 2015;308(10):807–815.
- Wehling M, Ulsenheimer A, Schneider M, Neylon C, Christ M. Rapid effects of aldosterone on free intracellular calcium in vascular smooth muscle and endothelial cells: subcellular localization of calcium elevations by single cell imaging. Biochem Biophys Res Commun. 1994;204(2):475–481.
- Wehling M, Neylon CB, Fullerton M, Bobik A, Funder JW. Nongenomic effects of aldosterone on intracellular Ca2+ in vascular smooth muscle cells. Circ Res. 1995;76(6):973–979.
- Schneider M, Ulsenheimer A, Christ M, Wehling M. Nongenomic effects of aldosterone on intracellular calcium in porcine endothelial cells. Am J Physiol. 1997;272(4 Pt 1):E616–620.
- Arima S, Kohagura K, Xu HL, Sugawara A, Abe T, Satoh F, Takeuchi K, Ito S. Nongenomic vascular action of aldosterone in the glomerular microcirculation. J Am Soc Nephrol. 2003;14(9):2255–2263.
- Wong S, Brennan FE, Young MJ, Fuller PJ, Cole TJ. A direct effect of aldosterone on endothelin-1 gene expression in vivo. Endocrinology. 2007;148(4):1511–1517.
- Yu DY, Su EN, Cringle SJ, Morgan WH, McAllister IL, Yu PK. Local modulation of retinal vein tone. Invest Ophthalmol Vis Sci. 2016;57(2):412–419.
- Kushibiki M, Yamada M, Oikawa K, Tomita H, Osanai T, Okumura K. Aldosterone causes vasoconstriction in coronary arterioles of rats via angiotensin II type-1 receptor: influence of hypertension. Eur J Pharmacol. 2007;572(2–3):182–188.
- Heylen E, Huang A, Sun D, Kaley G. Nitric oxide-mediated dilation of arterioles to intraluminal administration of aldosterone. J Cardiovasc Pharmacol. 2009;54(6):535–542.
- Toda N, Nakanishi S, Tanabe S. Aldosterone affects blood flow and vascular tone regulated by endothelium-derived NO: therapeutic implications. Br J Pharmacol. 2013;168(3):519–533.
- Lyngsø KS, Assersen K, Dalgaard EG, Skott O, Jensen BL, Hansen PB. Does aldosterone play a significant role for regulation of vascular tone? J Cardiovasc Pharmacol. 2016;68(1):1–10.
- Fujita M, Minamino T, Asanuma H, Sanada S, Hirata A, Wakeno M, Myoishi M, Okuda H, Ogai A, Okada K, et al. Aldosterone nongenomically worsens ischemia via protein kinase C-dependent pathways in hypoperfused canine hearts. Hypertension. 2005;46(1):113–117.
- Romagni P, Rossi F, Guerrini L, Quirini C, Santiemma V. Aldosterone induces contraction of the resistance arteries in man. Atherosclerosis. 2003;166(2):345–349.
- Schmidt BM, Oehmer S, Delles C, Bratke R, Schneider MP, Klingbeil A, Fleischmann EH, Schmieder RE. Rapid nongenomic effects of aldosterone on human forearm vasculature. Hypertension. 2003;42(2):156–160.
- de Kloet ER, Van Acker SA, Sibug RM, Oitzl MS, Meijer OC, Rahmouni K, de Jong W. Brain mineralocorticoid receptors and centrally regulated functions. Kidney Int. 2000;57(4):1329–1336.
- Lai M, Horsburgh K, Bae SE, Carter RN, Stenvers DJ, Fowler JH, Yau JL, Gomez-Sanchez CE, Holmes MC, Kenyon CJ, et al. Forebrain mineralocorticoid receptor overexpression enhances memory, reduces anxiety and attenuates neuronal loss in cerebral ischaemia. Eur J Neurosci. 2007;25(6):1832–1842.
- Rana I, Suphapimol V, Jerome JR, Talia DM, Deliyanti D, Wilkinson-Berka JL. Angiotensin II and aldosterone activate retinal microglia. Exp Eye Res. 2020;191:107902.
- Block ML, Zecca L, Hong JS. Microglia-mediated neurotoxicity: uncovering the molecular mechanisms. Nat Rev Neurosci. 2007;8(1):57–69.
- Brocca ME, Pietranera L, de Kloet ER, De Nicola AF. Mineralocorticoid receptors, neuroinflammation and hypertensive encephalopathy. Cell Mol Neurobiol. 2019;39(4):483–492.
- Marissal-Arvy N, Lombès M, Petterson J, Moisan MP, Mormède P. Gain of function mutation in the mineralocorticoid receptor of the brown Norway rat. J Biol Chem. 2004;279(38):39232–39239.
- Cavallari LH, Fashingbauer LA, Camp JR, King ST, Geenen DL. Hypertension-induced renal fibrosis and spironolactone response vary by rat strain and mineralocorticoid receptor gene expression. J Renin Angiotensin Aldosterone Syst. 2008;9(3):146–153.
- Mitchell P, Leung H, Wang JJ, Rochtchina E, Lee AJ, Wong TY, Klein R. Retinal vessel diameter and open-angle glaucoma: the Blue Mountains Eye Study. Ophthalmology. 2005;112(2):245–250.