
 ?Mathematical formulae have been encoded as MathML and are displayed in this HTML version using MathJax in order to improve their display. Uncheck the box to turn MathJax off. This feature requires Javascript. Click on a formula to zoom.
Abstract
The study of corneal stiffness in vivo has numerous clinical applications such as the measurement of intraocular pressure, the preoperative screening for iatrogenic ectasia after laser vision correction surgery and the diagnosis and treatment of corneal ectatic diseases such as keratoconus. The localised aspect of the microstructure deterioration in keratoconus leading to local biomechanical softening, corneal bulging, irregular astigmatism and ultimately loss of vision boosted the need to map the corneal stiffness to identify the regional biomechanical failure. Currently, two methods to map the corneal stiffness in vivo are integrated into devices that are either already commercially available or about to be commercialised: the stress-strain index (SSI) maps and the Brillouin Microscopy (BM). The former method produces 2D map of stiffness across the corneal surface, developed through numerical simulations using the corneal shape, its microstructure content, and the deformation behaviour under air-puff excitation. It estimates the whole stress-strain behaviour, making it possible to obtain the material tangent modulus under different intraocular pressure levels. On the other hand, BM produces a 3D map of the corneal longitudinal modulus across the corneal surface and thickness. It uses a low-power near-infrared laser beam and through a spectral analysis of the returned signal, it assesses the mechanical compressibility of the tissue as measured by the longitudinal modulus. In this paper, these two techniques are reviewed, and their advantages and limitations discussed.
Introduction
In the field of ophthalmology an adequate knowledge of corneal biomechanics has become indispensable in numerous applications such as measuring the intraocular pressure, assessing preoperative risk for iatrogenic ectasia post laser vision correction, diagnosing keratoconus (KC) in its early forms, indicating, and evaluating crosslinking (CXL) treatment effectiveness, among others.Citation1
The cornea is the main refractive surface of the eye.Citation2 To allow the light rays to be clearly focused on the retina, the cornea needs to keep its transparency as well as to maintain a stable aspheric shape able to resist to occasional external insults and to bear the intraocular pressure (IOP).Citation3 These peculiar characteristics are possible due to a highly organised collagen structure in the corneal stroma.Citation4 The collagen fibrils are the main load-carrying components of the corneal tissue with their content and distribution clearly controlling the tissue’s biomechanical behaviour.Citation5,Citation6
Corneal ectatic diseases such as KC are characterised by a localised degradation of this collagen microstructure, causing the tissue to become unable to maintain its shape under the IOP, and leading to a localised bulging resulting, in turn, in irregular astigmatism and loss of clear vision.Citation7 The localised nature of these diseases generated the necessity for mapping the corneal biomechanical behaviour either to improve the early detection of these specific fragilities or to direct treatments such as cross-linking to the most needed areas improving their efficacies and reducing the incidence of complications.Citation8
The clinical need for in vivo characterisation of corneal biomechanics led to the development of some commercial devices, the first of which employed precise measurements of corneal deformation under an air-puff pressure to provide estimates of overall corneal biomechanical behaviour.Citation9 The Ocular Response Analyzer (ORA; Reichert, NY, USA) was the pioneer device to address this challenge.Citation10 Using an infrared signal, the ORA indirectly monitors the corneal deformation caused by an air-puff stimulus. Also using air-puff stimulation, a later device, the Corvis ST (Oculus, Wetzlar, Germany), improved on the ORA by including an ultrafast Scheimpflug camera that allows the direct monitoring of corneal deformation.Citation11
Using a method that does not rely on corneal deformation, the Brillouin light-scattering microscopy (BM) employs the Brillouin frequency shift to estimate the longitudinal modulus of the tissue, for which the refractive index and material density are known.Citation12 The main advantage of BM over air-puff-based technologies was the possibility to produce a depth-dependant, spatially-resolved mapping of the longitudinal modulus as opposed to the global biomechanics metrics provided by the ORA and Corvis ST.
However, this point was addressed in the recent development of the Corvis ST, which allowed the production of 2D maps of the stress-strain index (SSI), a material stiffness parameter allowing estimation of the tissue’s stress-strain behaviour. The maps relied on the proven link between tissue microstructure and the stiffness distribution to translate the single SSI measurement into a 2D stiffness map of the cornea.Citation13
In this paper the two main techniques, which are already available, or almost ready, for clinical practice, for mapping corneal stiffness are reviewed. The emphasis of the review is on the possible applications of the maps in the diagnosis and management of corneal ectatic diseases.
Stress-strain index map
A recent addition to the Corvis ST was the development by Eliasy et al. of an algorithm based on the results of a large simulation using finite element modelling of the human ocular globe, able to estimate the overall corneal stress-strain behaviour: the Stress-Strain Index (SSI).Citation14 Like most biological tissues, the corneal material is hyperplastic with the stress-strain curve assuming an almost exponential shape.Citation7 This behaviour leads to the tangent modulus (Et, a measure of material stiffness) increasingly linearly with loads such as IOP, and therefore, a particular Et value measured under a specific IOP will not be valid under different pressure levels. The SSI was developed to consider this point and was intended to estimate the whole stress-strain behaviour, and hence Et at any IOP. Unlike previously developed indices such as the corneal biomechanical index (CBI), that used statistical methods to enhance the ability to diagnosis keratoconus,Citation15 the SSI was developed to represent a standard mechanical property, the material stiffness. Following its development, the SSI validation studies showed the parameter to be independent of IOP and the central corneal thickness (CCT) in healthyCitation14 and in KC corneas.Citation16 SSI was also observed to reduce with KC progression,Citation17 reflecting, and quantifying, the expected changes in corneal stiffness.
By combining the mean distribution of collagen fibril density (which was found consistent in healthy eyes) with patient-specific corneal geometry, Zhang et al. developed a finite-element-based numerical modelling method to translate the single value of SSI into a 2D map, presenting the SSI variation across corneal surface.Citation13 The method relied on the proven link between corneal microstructure and stiffness distributionCitation5 and the consistency in collagen fibril density distribution in healthy corneas.Citation18–20 Studying healthy corneal specimens, Zhou et al. observed that, within the central zone with a 6 mm diameter, the standard deviations of collagen fibril densities within the 45° sectors surrounding the superior-inferior meridian, and the nasal-temporal meridian were 2.8% and 2.9%, respectively.Citation18 The authors also observed high consistency in circumferential fibril content at 11 mm diameter with a 1.8% standard deviation.Citation18 The collagen fibril diameter in the central cornea was also reported by Boote et al. to be consistent within healthy specimens.Citation19 The same authors also reported as the presence of midline symmetry between left and right eyes when comparing preferentially aligned fibrils.Citation20
As these observations are not valid in KC corneas,Citation21,Citation22 the development of keratoconic stiffness maps was possible due to some other findings. First, there was evidence that in KC cases, the microstructure features outside the diseased area were not different from those observed in healthy cases.Citation18,Citation21,Citation22 Second, a method was developed by Eliasy et al.,Citation23 and later clinically validated,Citation24 which was able to delineate the diseased area (the keratoconic cone) in topography elevation maps. Third, a further method used the cone features and the cornea’s maximum curvature to estimate the magnitude of fibril density reduction inside the cone.Citation21,Citation23,Citation24 These three methods allowed extension of the SSI mapping technology, initially developed for healthy corneas, to KC cases.Citation13
In brief, the method begins by building two 3D patient-specific whole eye numerical models based on the finite element method: one (Model 1) adopting homogenous material, whose stiffness at all locations is estimated by the SSI value obtained in vivo through the Corvis ST exam and the other (Model 2) adopts an anisotropic material for which the mean distribution of stiffness followed the distribution of corneal fibril density. In order to obtain the specific stiffness at each integration point of Model 2, an inverse analysis process is carried out by assuming an initial stiffness level while observing that the ratios between these stiffness levels matched the ratios between the fibril contents at the same locations, and then comparing the corneal apical displacement between Models 1 and 2. The stiffness levels in Model 2 are changed by the same percentage as the differences between the apical displacements of Models 1 and 2 and the process is repeated until there is a match judged by the following objective function:
where δ is the apical displacement, i refers to different IOP application steps and n is the total number of IOP steps.
As demonstrated by Zhang et al., the regional variation in the SSI values showed little fluctuations with IOP, CCT or corneal curvature changes, corroborating the SSI map as a robust estimation of the tissue’s material properties with little effect of the usual confounding (loading and geometric) factors.Citation13 In the same study, the authors observed that simulated healthy eyes demonstrated only slight variations in SSI values across the corneal surface, while in keratoconic corneas there was a substantial SSI reduction inside the cone area. Further, the SSI reduction inside the cone was higher in more advanced cases of the disease.
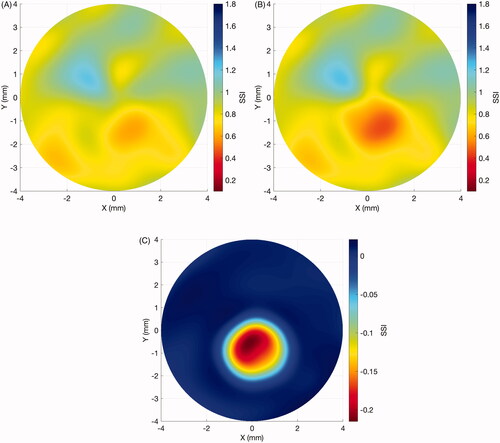
The SSI maps have been employed to assess the effect of KC progression on corneal stiffness (Elsheikh, unpublished data). In a sample of 29 eyes of 29 patients aged 20.1 ± 7.0 years (9–40) that presented significant KC progression over 17.1 ± 17.1 months (1.4–58.4), there was a significant reduction in SSI concentrated in the cone area (–0.15 ± 0.09, range: –0.42 to –0.01, p < 0.001), while the area outside the cone underwent minimal non-significant change in SSI (0 ± 0.01, range: –0.04 to 0.01, p = 0.999). and depict the results of a representative case of a 21-year-old male patient that progressed over 25 months from a Kmax of 54.7 D to 56.2D, a posterior elevation at the thinnest point from 49 µm to 70 µm and corneal minimum thickness from 504 µm to 491 µm. In the radial elevation maps in relation to the optimal sphere of the front surface (A: baseline, B: post-progression) and of the back surface (C: baseline, D: post-progression), with the estimated cone area, are plotted. In the SSI maps show that the disease progression was concentrated mostly inside the cone area. There was a significant reduction in the SSI values within the cone region, while the SSI values remained relatively stable outside of it. A further study to evaluate the effect of cross-linking treatment on corneal stiffness distribution, as represented by SSI maps, is being conducted by the University of Liverpool group.
Figure 1. Case example of elevation maps in a progressive keratoconus case. (A) Front surface: baseline radial elevation map. Dotted line: estimated cone region. (B) Front surface: post-progression (in 25 months) radial elevation map. Dotted line: estimated cone region. (C) Back surface: baseline radial elevation map. Dotted line: estimated cone region. (D) Back surface: post-progression (in 25 months) radial elevation map. Dotted line: estimated cone region.
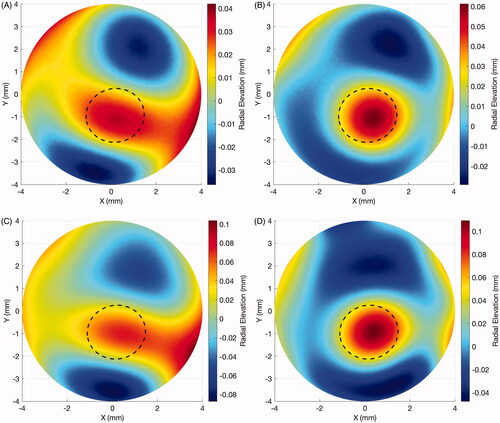
Figure 2. Case example of Stress-Strain Index (SSI) maps used in keratoconus progression. (A) Baseline SSI map exam. (B) SSI map after 25 months. (C) Differential map, showing the stiffness decrease mostly concentrated inside the cone area.
Brillouin microscopy
Brillouin Microscopy (BM) is an imaging modality based on the inelastic scattering that arises from the interaction of light with the medium’s inherent acoustic phonons—or density fluctuations.Citation25 The Doppler effect that arises from the reflection of light waves by these progressive inherent sound waves denominates the Brillouin shift.Citation25 Given that the refractive index and density of the material are known, the Brillouin frequency shift can be explicitly converted to the sample’s longitudinal modulus (M’) using the following relationship:
Where Ω is the frequency shift of the scattered light, λ is the wavelength of the incident photons, ρ is the density of the material and n is the refractive index of the material.Citation26 The method to estimate the longitudinal modulus assumes mechanical isotropy of corneal tissue.Citation26
The technique was first used in ocular tissues in the early 1980s.Citation27–30 However, the long measurement time—up to one hour—limited the assessment to single spatial points. More recently, with the development of a parallel spectrometer based on a virtually imaged phased array, the acquisition time was reduced to 1 s or less allowing BM to provide a 3D spatially resolved map of the corneal longitudinal modulus.Citation12 It should be noted that the longitudinal modulus cannot be directly related to the elastic or shear moduli. The latter two moduli are the ones that provide a measure of the stiffness of the material under direct and shear loads, respectively. Nevertheless, a strong correlation (R2 = 0.98) has been found between the Brillouin-derived longitudinal modulus of elasticity and tangent modulus of porcine corneas at very low strain (<10%).Citation31
BM has been used to map regional softening in KC cases. In an ex-vivo study, Scarcelli et al. showed that the mean Brillouin shift inside the cone area (7.99 ± 0.10 GHz) was significantly lower than those observed in the corresponding areas of healthy corneas (8.17 ± 0.06 GHz, p < 0.001).Citation32 The Brillouin shift in areas outside the cone was also significantly higher than inside the cone area (8.19 ± 0.04 GHz, p < 0.001), but no difference was observed between the non-cone areas in KC cases and corresponding areas in healthy cases. These results were corroborated in an in vivo study comparing healthy to advanced KC cases, in which the healthy corneas presented a Brillouin shift that was uniformly distributed across the anterior central region, while the KC cases showed significant reductions inside the cone area (p < 0.001), with no difference between the area outside the cone and corresponding areas in healthy cases.Citation33 The in vivo measurements, however, showed large interpersonal variability in both healthy and KC cases. Most of the variability has been hypothesised to stem from natural personal variation in the collagen composition and the hydration level of corneal tissue.Citation34–36 In order to overcome this issue, regional variations of the Brillouin shift have been studied in vivo.Citation34 The healthy cases presented a relatively uniform distribution of the Brillouin shift across their 4-mm-wide scanned areas, while in KC cases (including those with mild disease), there was a linear increase from the cone to the cornea periphery. In addition, the rate of regional variation increased with disease severity.Citation34
Seiler et al. have observed that the Brillouin shift at the point of maximum posterior elevation was better correlated with geometry-derived keratoconus indices such as minimum corneal thickness (MCT) and maximum anterior curvature (Kmax).Citation37 The authors also showed that the Brillouin shift at this point progressively decreased from mild to severe cases. However, its diagnostic ability was significantly lower than both MCT and Kmax. Shao et al. observed in a small sample of 4 mild KC cases that the Brillouin asymmetry between the left and right cone regions was significantly higher than the asymmetry observed in healthy cases with no overlap between the groups.Citation34 Even though the sample size was small, this new metric is promising in detecting early KC cases and worth further investigation.
The effect of CXL was initially studied with the BM in porcine corneas, showing significant stiffening that was higher in the anterior portion of corneal tissue.Citation38 The BM’s ability to estimate the longitudinal modulus across corneal thickness allowed a study to show that, in porcine corneas, accelerated protocols had their effect significantly reduced through tissue thickness.Citation31 It has also been shown using BM in porcine corneas that the stiffening effect of localised CXL extended beyond the treated area suggesting that custom treatments should also account for this effect on the surrounding tissue.Citation39 In a cross-sectional, in vivo study, Shao et al. compared a group of 8 untreated KC eyes with 16 CXL-treated cases.Citation40 The untreated group showed a mildly significant lower Brillouin shift (but with large overlap) than the post-CXL KC cases (p < 0.05). The latter group also showed non-significant differences when compared to a healthy control group. The cross-sectional study design, the small sample size and the big overlap between the groups suggest that these results should be taken with caution.
Method comparisons and limitations
The two described methods possess different advantages and limitations. The SSI maps estimate the whole stress-strain behaviour across the whole surface of the corneal tissue (2D), allowing measurement of the material stiffness under different IOP values,Citation13 which, due to the non-linear nature of the tissue, has a direct impact on the tangent modulus.Citation7,Citation41 Since the SSI map relies on the corneal microstructure and there is no method to directly describe individuals’ microstructures in vivo, it was necessary to assume that all healthy corneas and the areas outside the cone in KC eyes shared the same mean microstructure. However, the slight variations (under 3% SD) observed in ex-vivo microstructure studies and the use of each individual’s specific corneal thickness and curvature profiles considerably mitigates this limitation.Citation18 Another limitation of the SSI maps was the method used to link the cone geometric features to the fibril density reduction within the cone.Citation21 It was developed using the microstructure of 7 KC corneas, which was all that was available to the authors at the time but with the inclusion of more KC cases, the method is expected to gradually improve.Citation21
On the other hand, the BM can estimate the longitudinal modulus across both corneal surface and thickness (3D).Citation42 The BM measurements are usually acquired at a constant stress state, thus differ from the SSI maps in that it does not account for the tissue’s non-linearity. Further, the longitudinal modulus—a measurement of the tissue’s compressibility—assessed by the BM is dependent on the corneal hydration levels,Citation34–36 and does not directly correlate with the tangent modulus.Citation42 Even though it is expected that both metrics would change in a similar fashion in response to corneal physiological or pathological processes. In earlier studies, quadraticCitation35 and log-log linearCitation43 relationships were reported between Brillouin-derived moduli and the moduli derived from conventional methods—these relationships were determined empirically and explicit links are still unavailable. provides an overview and comparison of both methods.
Table 1. Overview and comparison of SSI maps and Brillouin microscopy.
The most important clinical applications of in-vivo stiffness mapping are the early diagnosis and treatment of corneal ectasia. Both methods were able on one hand to detect the localised stiffness reduction with KC progression and on the other, the stiffening promoted by CXL. The body of evidence is constantly growing with the initial clinical studies showing important populational trends. The wider availability of the methods in clinical practice increasing their contribution to the multimodal management of corneal ectatic disease, could allow the development of patient-specific cut-offs for early diagnosis, progression and treatment efficacy.
Both described methods are undergoing further improvements. On the SSI maps, it includes the refinement of the estimation of fibril density reduction in KC cases through the analysis of a bigger sample and a more detailed inclusion of the contribution of covalent bonds throughout the cornea to the tissue’s stiffness. On the Brillouin Microscopy side, dealing with the low intensity of the scattered Brillouin light and the small frequency shifts makes the measurement system very sensitive to alignment, vibration, temperature, and humidity. New designs to overcome these challenges and facilitate its use in clinics are being developed. Along with further improvements that both described methods are undergoing, some other technologies are also being developed using ultrasound and optical coherence tomography (OCT).Citation44–46 The OCT elastography is being extensively studied and it is expected that in the future it could also be part of the tools available in clinical practice to map corneal stiffness.Citation47–52
Summary
Mapping the corneal stiffness in vivo allows a better understanding of corneal ectatic diseases that affect the biomechanics of the localised areas of pathology. Both methods covered in this review have been shown to be effective in accomplishing this task. The SSI map method estimates the whole stress-strain behaviour of the corneal tissue, and its variation, across the corneal surface, while the BM method estimates the longitudinal modulus in 3D. The initial results suggest that both methods would aid in the diagnosis of KC, following-up its progression and in customising the CXL treatment.
Disclosure statement
Prof Elsheikh is a consultant to Oculus, Wetzlar, Germany
References
- Lopes BT, Bao F, Wang J, Liu X, Wang L, Abass A, Eliasy A, Elsheikh A. Review of in-vivo characterisation of corneal biomechanics. Med Novel Technol Dev. 2021;11:100073. doi:10.1016/j.medntd.2021.100073.
- Koudouna E, Winkler M, Mikula E, Juhasz T, Brown DJ, Jester JV. Evolution of the vertebrate corneal stroma. Prog Retin Eye Res. 2018;64:65–76. doi:10.1016/j.preteyeres.2018.01.002.
- Meek KM, Knupp C. Corneal structure and transparency. Prog Retin Eye Res. 2015;49:1–16. doi:10.1016/j.preteyeres.2015.07.001.
- Bergmanson JP, Horne J, Doughty MJ, Garcia M, Gondo M. Assessment of the number of lamellae in the central region of the normal human corneal stroma at the resolution of the transmission electron microscope. Eye Contact Lens. 2005;31(6):281–287. doi:10.1097/01.icl.0000165280.94927.0d.
- Meek KM. Corneal collagen-its role in maintaining corneal shape and transparency. Biophys Rev. 2009;1(2):83–93. doi:10.1007/s12551-009-0011-x.
- Meek KM, Boote C. The use of x-ray scattering techniques to quantify the orientation and distribution of collagen in the corneal stroma. Prog Retin Eye Res. 2009;28(5):369–392. doi:10.1016/j.preteyeres.2009.06.005.
- Roberts CJ, Dupps WJ. Jr. Biomechanics of corneal ectasia and biomechanical treatments. J Cataract Refract Surg. 2014;40(6):991–998. doi:10.1016/j.jcrs.2014.04.013.
- Mas Tur V, MacGregor C, Jayaswal R, O'Brart D, Maycock N. A review of keratoconus: diagnosis, pathophysiology, and genetics. Surv Ophthalmol. 2017;62(6):770–783. doi:10.1016/j.survophthal.2017.06.009.
- Esporcatte LPG, Salomao MQ, Lopes BT, Vinciguerra P, Vinciguerra R, Roberts C, Elsheikh A, Dawson DG, Ambrosio R. Jr. Biomechanical diagnostics of the cornea. Eye Vis. 2020;7(9):28.
- Luce DA. Determining in vivo biomechanical properties of the cornea with an ocular response analyzer. J Cataract Refract Surg. 2005;31(1):156–162. doi:10.1016/j.jcrs.2004.10.044.
- Ambrósio R, Jr Ramos I, Luz A, Faria FC, Steinmueller A, Krug M, Belin MW, Roberts CJ. Dynamic ultra high speed scheimpflug imaging for assessing corneal biomechanical properties. Rev Brasoftalmol. 2013;72(2):99–102. doi:10.1590/S0034-72802013000200005.
- Scarcelli G, Yun SH. Confocal brillouin microscopy for three-dimensional mechanical imaging. Nat Photonics. 2007;2(1):39–43. doi:10.1038/nphoton.2007.250.
- Zhang H, Eliasy A, Lopes B, Abass A, Vinciguerra R, Vinciguerra P, Ambrosio R, Jr., Roberts CJ, Elsheikh A. Stress-strain index map: a new way to represent corneal material stiffness. Front Bioeng Biotechnol. 2021;9:640434–640434.
- Eliasy A, Chen KJ, Vinciguerra R, Lopes BT, Abass A, Vinciguerra P, Ambrosio R, Jr., Roberts CJ, Elsheikh A. Determination of corneal biomechanical behavior in-vivo for healthy eyes using corvis st tonometry: stress-strain index. Front Bioeng Biotechnol. 2019;(7):105.
- Vinciguerra R, Ambrosio R, Jr., Elsheikh A, Roberts CJ, Lopes B, Morenghi E, Azzolini C, Vinciguerra P. Detection of keratoconus with a new biomechanical index. J Refract Surg. 2016;32(12):803–810. doi:10.3928/1081597X-20160629-01.
- Padmanabhan P, Lopes BT, Eliasy A, Abass A, Vinciguerra R, Vinciguerra P, Ambrosio R, Jr., Elsheikh A. Evaluation of corneal biomechanical behavior in-vivo for healthy and keratoconic eyes using the stress-strain index. J Cataract Refract Surg. 2022;2022:945. doi:10.1097/j.jcrs.0000000000000945.
- Padmanabhan P, Lopes BT, Eliasy A, Abass A, Elsheikh A. In vivo biomechanical changes associated with keratoconus progression. Curr Eye Res. 2022;2022:1–5. doi:10.1080/02713683.2022.2058020.
- Zhou D, Eliasy A, Abass A, Markov P, Whitford C, Boote C, Movchan A, Movchan N, Elsheikh A. Analysis of x-ray scattering microstructure data for implementation in numerical simulations of ocular biomechanical behaviour. PLoS One. 2019;14(4):e0214770. doi:10.1371/journal.pone.0214770.
- Boote C, Dennis S, Newton RH, Puri H, Meek KM. Collagen fibrils appear more closely packed in the prepupillary cornea: optical and biomechanical implications. Invest Ophthalmol Vis Sci. 2003;44(7):2941–2948. doi:10.1167/iovs.03-0131.
- Boote C, Hayes S, Abahussin M, Meek KM. Mapping collagen organization in the human cornea: left and right eyes are structurally distinct. Invest Ophthalmol Vis Sci. 2006;47(3):901–908. doi:10.1167/iovs.05-0893.
- Zhou D, Abass A, Lopes B, Eliasy A, Hayes S, Boote C, Meek KM, Movchan A, Movchan N, Elsheikh A. Fibril density reduction in keratoconic corneas. J R Soc Interface. 2021;18(175):20200900.
- Hayes S, Boote C, Tuft SJ, Quantock AJ, Meek KM. A study of corneal thickness, shape and collagen organisation in keratoconus using videokeratography and x-ray scattering techniques. Exp Eye Res. 2007;84(3):423–434. doi:10.1016/j.exer.2006.10.014.
- Eliasy A, Abass A, Lopes BT, Vinciguerra R, Zhang H, Vinciguerra P, Ambrosio R, Jr., Roberts CJ, Elsheikh A. Characterization of cone size and centre in keratoconic corneas. J R Soc Interface. 2020;17(169):20200271. doi:10.1098/rsif.2020.0271.
- Lopes B, Padmanabhan P, Zhang H, Abass A, Eliasy A, Bandeira F, Bao F, Bühren J, Elmassry A, Faria-Correia F, et al. Clinical validation of the automated characterization of cone size and center in keratoconic corneas. J Refract Surg. 2021;37(6):414–421. doi:10.3928/1081597X-20210315-03.
- Brillouin L. Diffusion de la lumière et des rayons x par un corps transparent homogène: influence de l'agitation thermique. Ann Phys. 1922;9(17):88–122. doi:10.1051/anphys/192209170088.
- Scarcelli G, Pineda R, Yun SH. Brillouin optical microscopy for corneal biomechanics. Invest Ophthalmol Vis Sci. 2012;53(1):185–190. doi:10.1167/iovs.11-8281.
- Harley R, James D, Miller A, White JW. Phonons and the elastic moduli of collagen and muscle. Nature. 1977;267(5608):285–287. doi:10.1038/267285a0.
- Randall JT, Vaughan JM. Brillouin scattering in systems of biological significance. Philo Trans Royal Soc London. 1979;293(1402):341–348.
- Randall J, Vaughan JM. The measurement and interpretation of brillouin scattering in the lens of the eye. Proc R Soc Lond B Biol Sci. 1982;214(1197):449–470. doi:10.1098/rspb.1982.0021.
- Vaughan JM, Randall JT. Brillouin scattering, density and elastic properties of the lens and cornea of the eye. Nature. 1980;284(5755):489–491. doi:10.1038/284489a0.
- Webb JN, Su JP, Scarcelli G. Mechanical outcome of accelerated corneal crosslinking evaluated by Brillouin microscopy. J Cataract Refract Surg. 2017;43(11):1458–1463. doi:10.1016/j.jcrs.2017.07.037.
- Scarcelli G, Besner S, Pineda R, Yun SH. Biomechanical characterization of keratoconus corneas ex vivo with brillouin microscopy. Invest Ophthalmol Vis Sci. 2014;55(7):4490–4495. doi:10.1167/iovs.14-14450.
- Scarcelli G, Besner S, Pineda R, Kalout P, Yun SH. In vivo biomechanical mapping of normal and keratoconus corneas. JAMA Ophthalmol. 2015;133(4):480–480. doi:10.1001/jamaophthalmol.2014.5641.
- Shao P, Eltony AM, Seiler TG, Tavakol B, Pineda R, Koller T, Seiler T, Yun SH. Spatially-resolved brillouin spectroscopy reveals biomechanical abnormalities in mild to advanced keratoconus in vivo. Sci Rep. 2019;9(1):1–12. doi:10.1038/s41598-019-43811-5.
- Seiler TG, Shao P, Frueh BE, Yun SH, Seiler T. The influence of hydration on different mechanical moduli of the cornea. Graefe’s Archive for. Graefes Arch Clin Exp Ophthalmol. 2018;256(9):1653–1660. doi:10.1007/s00417-018-4069-7.
- Shao P, Seiler TG, Eltony AM, Ramier A, Kwok SJJ, Scarcelli G, Ii RP, Yun SH. Effects of corneal hydration on brillouin microscopy in vivo. Invest Ophthalmol Vis Sci. 2018;59(7):3020–3027. doi:10.1167/iovs.18-24228.
- Seiler TG, Shao P, Eltony A, Seiler T, Yun S-H. Brillouin spectroscopy of normal and keratoconus corneas. Am J Ophthalmol. 2019;202:118–125. doi:10.1016/j.ajo.2019.02.010.
- Scarcelli G, Kling S, Quijano E, Pineda R, Marcos S, Yun SH. Brillouin microscopy of collagen crosslinking: noncontact depth-dependent analysis of corneal elastic modulus. Invest Ophthalmol Vis Sci. 2013;54(2):1418–1425. doi:10.1167/iovs.12-11387.
- Webb JN, Langille E, Hafezi F, Randleman JB, Scarcelli G. Biomechanical impact of localized corneal cross-linking beyond the irradiated treatment area. J Refract Surg. 2019;35(4):253–260. doi:10.3928/1081597X-20190304-01.
- Shao P, Eltony AM, Seiler TG, Tavakol B, Pineda R, Koller T, Seiler T, Yun S-H. Spatially-resolved brillouin spectroscopy reveals biomechanical changes in early ectatic corneal disease and post-crosslinking in vivo. arXiv e-prints 2018: arXiv:1802.01055-arXiv:01802.01055.
- Roberts C. The cornea is not a piece of plastic. J Refract Surg. 2000;16(4):407–413. doi:10.3928/1081-597X-20000701-03.
- Yun SH, Chernyak D. Brillouin microscopy: assessing ocular tissue biomechanics. Curr Opin Ophthalmol. 2018;29(4):299–305. doi:10.1097/ICU.0000000000000489.
- Scarcelli G, Kim P, Yun SH. In vivo measurement of age-related stiffening in the crystalline lens by brillouin optical microscopy. Biophys J. 2011;101(6):1539–1545. doi:10.1016/j.bpj.2011.08.008.
- Beshtawi IM, Akhtar R, Hillarby MC, O’Donnell C, Zhao X, Brahma A, Carley F, Derby B, Radhakrishnan H. Scanning acoustic microscopy for mapping the microelastic properties of human corneal tissue. Curr Eye Res. 2013;38(4):437–444. doi:10.3109/02713683.2012.753094.
- Nguyen TM, Aubry JF, Fink M, Bercoff J, Tanter M. In vivo evidence of porcine cornea anisotropy using supersonic shear wave imaging. Invest Ophthalmol Vis Sci. 2014;55(11):7545–7552. doi:10.1167/iovs.14-15127.
- Singh M, Nair A, Aglyamov SR, Larin KV. Compressional optical coherence elastography of the cornea. Photonics. 2021;8(4):111. doi:10.3390/photonics8040111.
- Nahas A, Bauer M, Roux S, Boccara AC. 3d static elastography at the micrometer scale using full field oct. Biomed Opt Express. 2013;4(10):2138–2149. doi:10.1364/BOE.4.002138.
- Kling S, Torres-Netto EA, Spiru B, Sekundo W, Hafezi F. Quasi-static optical coherence elastography to characterize human corneal biomechanical properties. Invest Ophthalmol Vis Sci. 2020;61(6):29–29. doi:10.1167/iovs.61.6.29.
- Ramier A, Eltony AM, Chen Y, Clouser F, Birkenfeld JS, Watts A, Yun SH. In vivo measurement of shear modulus of the human cornea using optical coherence elastography. Sci Rep. 2020;10(1):17366. doi:10.1038/s41598-020-74383-4.
- De Stefano VS, Ford MR, Seven I, Dupps WJ. Jr. Live human assessment of depth-dependent corneal displacements with swept-source optical coherence elastography. PLoS One. 2018;13(12):e0209480. doi:10.1371/journal.pone.0209480.
- De Stefano VS, Ford MR, Seven I, Dupps WJ. Jr. Depth-dependent corneal biomechanical properties in normal and keratoconic subjects by optical coherence elastography. Trans Vis Sci Tech. 2020;9(7):4. doi:10.1167/tvst.9.7.4.
- Ferguson TJ, Singuri S, Jalaj S, Ford MR, De Stefano VS, Seven I, Dupps WJ. Jr. Depth-resolved corneal biomechanical changes measured via optical coherence elastography following corneal crosslinking. Transl Vis Sci Technol. 2021;10(5):7. doi:10.1167/tvst.10.5.7.