
 ?Mathematical formulae have been encoded as MathML and are displayed in this HTML version using MathJax in order to improve their display. Uncheck the box to turn MathJax off. This feature requires Javascript. Click on a formula to zoom.
Abstract
Purpose: Tear film instability, which can lead to rapid tear film breakup (TBU), is considered to be a major etiological factor in dry eye. However, experimental support for many of the proposed theories for TBU mechanisms is relatively scarce. The major aim of this perspective is to show that fluorescence studies of TBU can be used to provide experimental evidence for two proposed underlying mechanisms of TBU, evaporation and divergent flow.
Methods: To understand the effects of TBU on tear film fluorescence, we show that local fluorescence is the product of three main factors: tear film thickness, fluorescein concentration and fluorescent efficiency. In divergent tear flow, tear film thickness is reduced without change in fluorescein concentration and fluorescent efficiency, thus leading to reduced fluorescence intensity. Evaporation causes decreased fluorescence mainly by self-quenching due to high fluorescein concentration. Fluorescent efficiency is reduced by quenching at high fluorescein concentration but is independent of concentration for very low fluorescein concentration; thus, comparison of high and very low concentrations of fluorescein can be used to discriminate between divergent flow and evaporation. Finally, it is shown how the fluorescent pattern can change greatly during the development of breakup.
Conclusions: This analysis demonstrates that the study of tear film fluorescence in TBU and dry eye may be underutilized as additional information pertinent to clinical practice may be obtained. A better understanding of TBU mechanisms may lead to improved diagnosis and treatment of dry eye.
Introduction
Tear film instability has been described as one of the two “core mechanisms” of dry eye disease.Citation1,Citation2 It leads to rapid tear breakup (TBU), which can be visualized by the formation of a dark spot in the fluorescent tear filmCitation3 or by other clinical methods.Citation4 The importance of tear breakup in dry eye disorders has been further emphasized by a consensus report by the Asia Dry Eye Society which proposes that an unstable tear film is the central feature of dry eye. They recommend that dry eye should be diagnosed by the combination of dry eye symptoms and a reduced tear breakup time (TBUT), which is the time until the first break appears in the tear film.Citation3,Citation5
The pattern of TBU in a patient and its development over time potentially contain important information for classification of subtypes of dry eye. Some classification systems separate TBU patterns into types,Citation6,Citation7 some suggesting interpretations in terms of subtypes of dry eye based on clinical findings associated with each TBU pattern and its development.Citation8,Citation9 In this perspective, we propose an alternative approach to interpretation of TBU, based on, first, a classification of TBU mechanisms based on optical studies and fluid dynamics theory,Citation10 and second, predictions of fluorescent TBU patterns and development for different mechanisms of breakup. The ultimate goal of our approach is to understand the underlying mechanisms of TBU to better aid in clinical diagnosis and targeted treatment of dry eye.Citation11–13
TBU and touchdown
The term “TBU” will be used here in the usual manner to describe a clinical determination used, for example, in the measurement of TBUT, to designate the formation of a dark spot in the tear film.Citation3 We suggest the use of the term, “Touchdown,” as a more theoretical concept denoting the moment when the lipid layer of the tear film first “touches down” on the tips of the glycocalyx.Citation10 The relation between TBU and touchdown moments is currently uncertain and deserves clarification. While TBU has been described as the formation of a dry spot in the tear film,Citation14 it is not clear how the clinician should judge exactly when this occurs. It may also be noted that, even at the theoretical touchdown moment, water is presumably trapped under the lipid layer and between the glycocalyx and microplicae so a completely dry spot is not formed.Citation10 Using interferometry,Citation15 the roughness of the corneal surface appears to be visible when touchdown has occurred.Citation10 When TBU is observed by fluorescence imaging, one could use the cessation of significant fluorescence reduction as a proxy for observing touchdown. One study using fluorescence imaging found that the clinical TBUT measurement was shorter than the computer assisted estimate of touchdown in a group of normal subjects.Citation16 It may be noted that computer simulations have some uncertainty due to limited knowledge of diffusion of fluorescein into and out of the glycocalyx.Citation17
We propose that the moment of touchdown separates an initial tear film thinning period involving certain mechanisms of tear film dynamics, with a post-touchdown period which involves additional mechanisms and different characteristics.Citation10 This may be represented schematically by
Tear film thinning period→Touchdown moment→Post-touchdown period
Although tear film surface is distorted before touchdown as TBU develops, a much steeper distortion of the surrounding tears can occur after touchdown.Citation10 In the unstained tear film, touchdown areas can appear considerably rougher than before touchdown, presumably corresponding to the rough corneal surface.Citation10,Citation18,Citation19 In support of this concept, microaberrations and scatter have been shown to appear within areas of TBU in blink suppression studies.Citation18 Thus, the characteristics and structure of the tear film are likely to differ between the tear thinning period and the post-touchdown period.
Relation of TBUT to thinning rate
TBUT depends on the initial thickness of the tear film just after a blink and the thinning rate of the tear film, e.g. from evaporation. If TBU corresponds to full thickness thinning (or touchdown), TBUT may be expressed by the simple, approximate equation
(1)
(1)
This is equivalent to a basic equation of motion
EquationEquation 1(1)
(1) refers to spatially localized thinning rates within an area of tear breakup. Initially, the concentration of fluorescein in the tear film should be relatively uniform just after the blink, but then may become very non-uniform as spatially local evaporation occurs. Divergent flow, from any mechanism, would not change fluorescein concentration but would redistribute fluorescein, as discussed below.
It is probable that thinning rate is more important than initial thickness in determining TBUT and its variability. In a study of initial thickness and thinning rate, the coefficient of variation, COV, (ratio of standard deviation to the mean) for initial thickness was 0.27, whereas the COV for thinning rate was 1.11, some four times higher.Citation20 This implies that the variability of TBUT is determined more by variability of thinning rate, rather than by variability of initial thickness.
Fluorescent intensity depends on absorption and fluorescent efficiency
To interpret thinning rates as viewed by tear film fluorescence, it is important to understand the factors involved. As illustrated in , the number of fluorescent emitted photons from a small area of tear film equals the product of the number of absorbed photons and the fluorescent efficiency. Efficiency equals the number of emitted photons as a fraction of the number of incident photons; it depends on fluorescein concentration but is independent of tear film thickness. The efficiency is reduced by self-quenching of fluorescence;Citation21,Citation22 for low concentrations, efficiency is high and independent of concentration but for high concentrations, above a ‘critical concentration’ of 0.2% sodium fluorescein, efficiency is considerably reduced and varies with the inverse square of concentration at high concentrations.Citation21 shows 50% efficiency, since 6 molecules, out of the 12 that absorbed blue photons, fluoresced green photons.
Figure 1. The number of fluorescent emitted photons from the tear film equals the product of the number of absorbed photons and the fluorescent efficiency. Blue arrows give incident photons, green circles and arrows represent absorption and emission by fluorescein molecules and black circles give absorption with quenched (no) fluorescence. Of the 60 incident photons, 12 (20%) are absorbed, of which half emit photons corresponding to an emission of 6 (10% of incident) photons. (It may be noted that many emitted photons pass backwards into the eye, or are internally reflected by the tear surface, so only a small fraction pass out into the air and can be observed – part of the reason fluorescence is so weak compared to the incident illumination.).
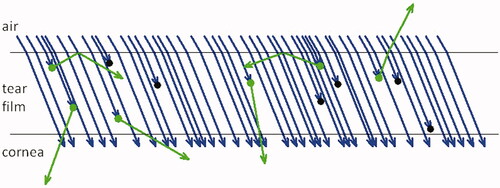
Absorption is the other main factor in fluorescence intensity and is roughly proportional to both tear thickness and fluorescein concentration. (Another factor determining absorption, the inner filter effect,Citation21,Citation23 has a more limited effect and does not affect the conclusions of this review.) shows a 20% absorption, since 12 photons out of the 60 incident photons, were absorbed. The product of efficiency and the absorption is just 10%, and this explains the 6 emitted photons relative to the 60 incident photons. In conclusion, fluorescent intensity is proportional to product of absorption and efficiency, and so is roughly proportional to the product of three factors.
(2)
(2)
High and low fluorescein concentrations reveal mechanisms of TBU
As noted above, the efficiency of fluorescence depends on fluorescein concentration at high concentrations, but is independent of concentration at low concentrations. As illustrated in , this provides a way of distinguishing reduced fluorescent intensity due to local divergent flow of tears from that due to local evaporation. In order to do that we must examine the contribution of different effects for both low and high fluorescein concentration and for evaporation and divergent flow. The four panels, A to D, represent the four combinations of parameters, as indicated. In each of the panels, several variables are sketched; the upper sketch in each panel represents the tear film, while the lower sketch represents the fluorescent intensity observed from the tear film. The upper curve and lower line show the thickness of the tear film. The green spots inside the tear film represent fluorescein molecules, and the size of each spot representing relative intensity of emitted photons (probability of photon emission) from each molecule. More crowded molecules contribute less fluorescent intensity and are drawn smaller because of the effect of self-quenching with increasing concentration. Beneath the upper image in each panel, we state the important central factors and use downward arrows, dashes and upward arrows to represent decreased, unchanged and increased changes relative to the surroundings. The bottom image in each panel illustrates the expected fluorescence distribution, based on EquationEquation 2(2)
(2) and the changes in the central factors in it.
Figure 2. Effect of divergent flow and local evaporation (yellow arrows) on reduced fluorescent intensity and breakup at low and high fluorescein concentrations. The yellow arrows indicate where water goes: for evaporation, water leaves the tear film into air above, and for divergent flow, the water stays in the tear film but flows away from the center of the sketch. Black arrows and text indicate changes in each central factor relative to the surrounding tear film. In each of the four panels, green spots in the upper plot represent fluorescence of fluorescein molecules, the size of the spot indicating fluorescent efficiency, which is reduced by self-quenching at high fluorescein concentrations. The bottom image in each panel gives the expected intensity distribution from EquationEquation 2(2)
(2) . (A) Reduced fluorescence due to divergent flow can be visualized under conditions of low fluorescein concentration (much less than the critical concentration in the tear film), while (B) the increased fluorescein concentration is not sufficient to cause self-quenching and hence to visualize local evaporation. Under conditions of high fluorescein concentration (greater than the critical concentration in the tear film), both (C) divergent flow and (D) local evaporation result in reduced fluorescent intensity.
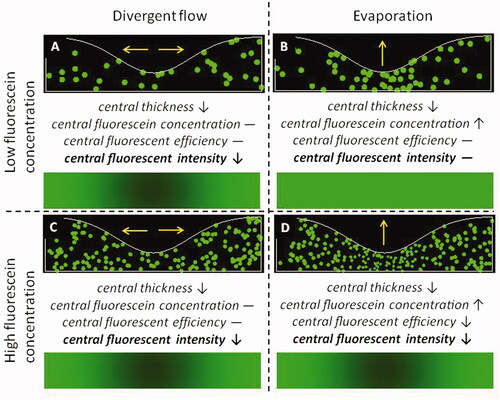
An important observation is that, for low fluorescein concentrations, evaporation does not cause reduced fluorescent intensity (), providing a method for differentiating the TBU mechanisms of evaporation and divergent flow. This is because reduced central thickness is compensated by increased concentration; thus any reduced fluorescence for low concentration indicates divergent flow rather than evaporation – compare to . If reduced fluorescent intensity is seen at high but not low concentrations, this indicates evaporative thinning, compare . These observations were used as evidence that most localized reduced fluorescent intensity after a blink was due to evaporation rather than divergent flow.Citation24
The proposal that evaporation is the most important contributing mechanism to tear film thinning and breakup has been criticized on the grounds that the observed mean thinning rate of 3.79 µm/minCitation20 was considerably greater than the averaged evaporation rate from a number of studies of 13.57 × 10⁻⁷ g/cm2/s, equivalent to a thinning rate of 0.814 µm/min.Citation25 A response to this criticism is that the pre-ocular chambers used to measure evaporation rate blocked the natural flow of air over the tear film and hence reduced evaporation.Citation19 Support for this response comes from the use of a ‘flow evaporimeter’ which passes a stream of air over the tear film;Citation26 the estimated ‘lipid-free’ evaporation rate for a mannequin or human observer was about 3 × 10⁻⁵ g/cm2/s at 35 °C, 40% relative humidity and a flow rate of 10 cm/s, which represents sitting in a typical ventilated room.Citation26 This corresponds to a thinning rate of about 18 µm/min. Additionally, the rate of cooling of the human tear film was used to derive evaporation rates of 10−6 to 10−5 g/cm2/s corresponding to thinning rates of 0.6 to 6 µm/min.Citation27 It was noted that this corresponds to a reduction of 95% to 50% compared to a pure water surface, implying evaporation from a water surface of 12 µm/min. Further evidence for the importance of evaporation in tear film thinning comes from the reduction of evaporation rates caused by wearing tight-fitting goggles;Citation28 wearing goggles reduced the thinning rate significantly from 3.22 ± 0.70 µm/min (mean ± SE) to −0.16 ± 0.29 µm/min, i.e. a slight but insignificant thickening. Finally, divergent flow of the tear film was found to be typically considerably too slow to explain the thinning rate of the tear film,Citation29 implying again that most thinning is due to evaporation.
It may be noted that the very low concentration condition in is a research method to demonstrate the effect of divergent flow while being insensitive to evaporation – compare . It would thus be unsuitable as a clinical test of evaporative dry eye. Thus, clinical testing should involve fluorescein instillation sufficient to raise the initial tear fluorescein concentration to near or above the critical concentration so that quenching secondary to tear film evaporation or divergent flow illustrate the formation of TBU. In practice, the efficacy of TBUT as a test for dry eye is little affected by the quantity of fluorescein instilled over a moderate range, e.g. 2 µL of 1% compared to 5 µL of 2% fluorescein,Citation30 probably causing concentrations in the tear film near or above the critical concentration.
shows the difference between high and low concentrations of fluorescein in images from two dry eye subjects. For Subject 1, very low concentration of fluorescein was used, much below the critical concentration. Thus, reduced fluorescent intensity observed in various areas indicates that thinning was due to divergent flow rather than evaporation – compare the image of fluorescent intensity in . This image probably corresponds to what has been termed, “spot break,”Citation9 and has been interpreted in terms of expanding “globs” of lipid.Citation10 shows fluorescence images for another subject (Subject 2) 5 s after eye opening. Extensive areas of reduced fluorescence were seen after 5 s using high, , but not low, , fluorescein concentration, indicating that thinning was due to local evaporation – compare . Thus, viewing TBU under conditions of high and low fluorescein concentrations may allow the mechanisms of evaporation and divergent flow to be distinguished.
Figure 3. Fluorescein images for two subjects – Panel A is for one subject, whereas Panels B and C are for a second subject. “low” indicates fluorescein tear film concentration was much less than the critical concentration (instillation of 1 µL of 0.1% fluorescein), whereas “high” indicates tear film concentration was greater than the critical concentration (instillation of 1 µL of 5% fluorescein). (In the low concentration images, bright areas are seen from lens fluorescence and reflections from the two light sources.) Time after a preceding blink is also given. For Subject 1, dark spots are seen with low fluorescein concentration indicating that local reduction of fluorescent intensity is due to divergent flow, cf. ; as expected from , similar reduced fluorescence was observed for high concentration, results not shown. For Subject 2, pronounced dimming is seen for high but not low concentration, indicating the effect of evaporation, see . Images obtained with imaging system of King-Smith et al.Citation24
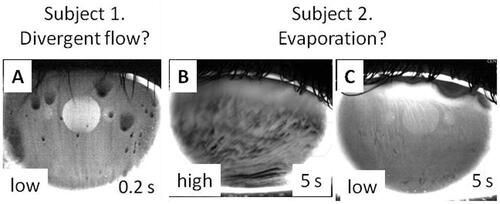
also illustrates another noteworthy difference between the TBU demonstrated by Subjects 1 and 2. In Subject 1, the case interpreted as divergent flow, the fluorescence of TBU areas was strongly reduced in just 0.2 s after the blink (). In comparison, the reduction of fluorescence for Subject 2 in the high concentration case () was much slower (results not shown), requiring several seconds for the TBU to become visible. Thus divergent flow can cause much more rapid reduction of fluorescence than evaporation and that is how it may be recognized in practice, e.g. strong localized reduction of fluorescence as soon as the tear film is visible after a blink. Divergent flow causing very rapid TBU is less common than evaporation as the main cause of TBU in our experience.
Classification of tear film thinning
As noted previously, we theorize that tear film thinning during the pre-touchdown period causes TBU, and contributes further in the post-touchdown period. It is thus important to understand possible mechanisms of thinning; these are summarized in . A major distinction, illustrated in and is between evaporation and various types of divergent flow. It may be noted that evaporative TBU is a local phenomenon whereas evaporation measurements are global, involving the whole exposed ocular surface. This may help explain a counterintuitive finding that a cool environment causes reduced evaporation but also reduced non-invasive TBUT.Citation31 Cold environments can cool the ocular surface temperature to about 30 °C.Citation31 Perhaps low temperature improves the evaporation barrier over most of the lipid layer, but worsens the barrier in some locations leading to faster TBU. Another possibility is that low temperatures could change mechanical properties of the lipid layer, e.g. by increased production of globs. Many changes in meibum are observed near 30 °C including X-Ray spectra,Citation32 infrared spectra,Citation33 viscoelasticity,Citation32 scattering,Citation34 birefringenceCitation34 and studies using differential scanning calorimetry.Citation35
Figure 4. Classification of possible mechanisms of tear film thinning, either before or after touchdown. The evaporation branch is a primary driver of tear film thinning, represented as the only mechanism on the left side of the tree. On the right side of the tree, there may be different types of divergent flow as discussed in the text.
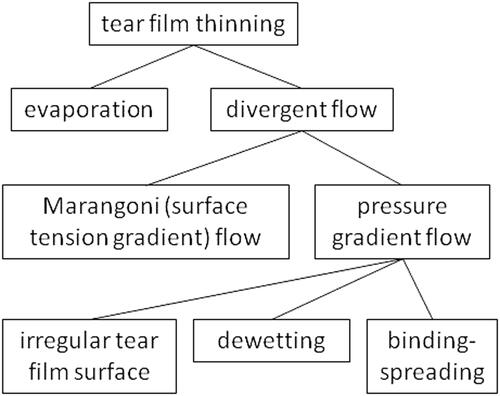
One type of divergent flow, Marangoni, is caused by surface tension gradients, causing the lipid layer to move in the direction of increasing surface tension. Surrounding a position of low surface tension, as the lipid layer moves outwards, it drags the underlying aqueous tear film with it causing divergent flow of tears. Simultaneous recording of fluorescein TBU and the lipid layer has demonstrated an example of TBU derived from Marangoni flow (see their ).Citation36 Another type of divergent flow can be caused by gradients of pressure in the aqueous layer, the tear film flowing from regions of high to low pressure. An example is “meniscus induced thinning” of the tear film near the concave surfaces of the tear film next to the lids;Citation37 this thinning is not generally considered an example of TBU, although TBU may extend and develop from this area. (It may be noted that, like Marangoni flow, surface tension is involved in generating this flow, but it differs from Marangoni flow in that it need not involve surface tension gradients.)
Dewetting of a hydrophobic corneal area has attracted considerable attention since first proposed by Holly.Citation38 While dewetting is a theoretical mechanism of tear thinning leading to breakup2, we are unaware of experimental evidence that it is an important factor outside of in vitro cell cultures.Citation39 Concerns about dewetting as a common mechanism of TBU have been summarized by Peng et al.Citation40 If touchdown occurred over an area of hydrophobic cornea then the generation of the steep slopes in the tear surface which are observed after touchdownCitation10 could be explained by dewetting.Citation41 An alternative explanation of the steep tear surface slopes after touchdown is a proposed “binding-spreading” mechanism between the lipid layer and the glycocalyx which squeezes out underlying aqueous tears.Citation10
Dynamics of breakup patterns
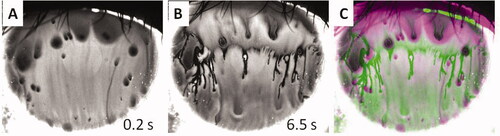
While TBUT is a typical clinical test for the dry eye condition,Citation13 the formation and change of TBU patterns after TBUT have also been used to diagnose or treat dry eye disease.Citation8 However, as shows, TBU patterns may change considerably over time, even in the same subject. , recorded 0.2 s after a blink, shows a typical ‘spot break’ pattern,Citation8,Citation9 similar to and so is interpreted as due to divergent flow. After an additional 6.3 s, shows a remarkably different pattern, showing some of the characteristics of a ‘line break’ image.Citation8,Citation9 The changes in breakup pattern are illustrated in which is a pseudocolor image combining the first image, , in green, with the later image, , in magenta. (The two images had previously been aligned by superimposing punctate staining spots.) Green areas in correspond to dimming over the interval, whereas magenta areas correspond to increase in fluorescence, such as when a dark object moves out of the area. The magenta areas would not be expected from evaporation on its own because evaporation should cause thinning and reduced fluorescence for this high concentration image. This implies that other mechanisms such as divergent flow (along the corneal surface) of tears are also involved and is consistent with the interpretation of the spot breaks in and as due to divergent flow of tears under expanding globs of lipid.Citation10 Although we show only one example, it illustrates the complexity of the dynamics of tear film breakup. Perhaps, the first observation, , may be the most important in classifying the type of tear film breakup. Also important in this case is the fact that TBU observed immediately after a blink () is probably caused by divergent flow rather than evaporation.Citation42,Citation43
Figure 5. Changes in tear film breakup pattern. A. 0.2 s after a blink. B. 6.5 s after the blink. C. Pseudocolor image combining first image. A, in green with second image, B, in magenta. Images obtained after instillation of 1 µL of 0.5% fluorescein. B and C show remarkable changes in the TBU pattern long after the rapid TBU imaged in A.
We note that there are instances of TBU where neither evaporation nor divergent flow are dominant in the dynamics; such cases may occur more frequently with intermediate TBU times, that is, times that are not just after a blink but shorter than about ten seconds. Identification of mechanisms in such cases is facilitated by using mathematical models to identify how much each process contributes to a TBU instance.Citation42,Citation44 It is sometimes hard to classify TBU as uniquely due to either evaporation or divergent flow, and such modelling provides a mechanism for studying TBU in these cases.Citation42,Citation44
Summary
A classification is proposed for tear film thinning mechanisms before and after touchdown or breakup; a major distinction is thinning caused by evaporation or by divergent flow of tears. Correspondingly, it is proposed that a major distinction in cause of TBU is between evaporation and divergent tear flow. A relatively long TBUT is typically a signal that evaporation is the most important process in TBU, rather than divergent flow. Divergent flow in excess lipid “globs” is the usual cause of rapid divergent flow and can be recognized by the immediate appearance after a blink of a “spot break” pattern. The very short TBUT case can be seen as a sign that divergent flow is important. Recent quantitative work has shown that short (but not immediate) TBUTs likely have some contribution from divergent flow. Dewetting of a hydrophobic area of the cornea remains a possibility, but requires further study to establish cases where this effect is a strongly-contributing or dominant mechanism of TBU.
Disclosure statement
No potential conflict of interest was reported by the author(s).
Additional information
Funding
References
- Lemp MA, Baudouin C, Baum J, Dogru M, Foulks GN, Kinoshita S, Laibson P, McCulley J, Murube J, Pfugfelder SC, et al. The definition and classification of dry eye disease: report of the definition and classification subcommittee of the international dry eye workshop (2007). Ocul Surf. 2007;5:75–92.
- Choudhury A, Dey M, Dixit HN, Feng JJ. Tear-film breakup: the role of membrane-associated mucin polymers. Phys Rev E. 2021;103(013108):1–13.
- Norn MS. Desiccation of the precorneal film. I. Corneal wetting-time. Acta Ophthalmol (Copenh)). 1969;47(4):865–880. doi:10.1111/j.1755-3768.1969.tb03711.x.
- Mengher LS, Bron AJ, Tonge SR, Gilbert DJ. A non-invasive instrument for clinical assessment of the pre-corneal tear film stability. Curr Eye Res. 1985;4(1):1–7. doi:10.3109/02713688508999960.
- Tsubota K, Yokoi N, Shimazaki J, Watanabe H, Dogru M, Yamada M, Kinoshita S, Kim H-M, Tchah H-W, Hyon JY, et al. New perspectives on dry eye definition and diagnosis: a consensus report by the Asia Dry Eye Society Ocul Surf. Ocul Surf. 2017;15(1):65–76.
- Bitton E, Lovasik JV. Longitudinal analysis of precorneal tear film rupture patterns. Adv Exp Med Biol. 1998;438:381–389.
- Guillon JP. Tear film structure and contact lenses. In: Holly FJ (ed), The preocular tear film in health, disease and contact lens wear. Lubbock, TX: Dry Eye Institute; 1986: p. 914–939.
- Yokoi N, Georgiev GA. Tear film-oriented diagnosis and tear film-oriented therapy for dry eye based on tear film dynamics. Invest Ophthalmol Vis Sci. 2018;59(14):DES13–DES22. doi:10.1167/iovs.17-23700.
- Yokoi N, Georgiev GA. Tear-film-orientated diagnosis for dry eye. Jpn J Ophthalmol. 2019;63(2):127–136. doi:10.1007/s10384-018-00645-4.
- King-Smith PE, Begley CG, Braun RJ. Mechanisms, imaging and structure of tear film breakup. Ocul Surf. 2018;16(1):4–30. doi:10.1016/j.jtos.2017.09.007.
- Geerling G, Tauber J, Baudouin C, Goto E, Matsumoto Y, O'Brien T, Rolando M, Tsubota K, Nichols KK. The international workshop on meibomian gland dysfunction: report of the subcommittee on management and treatment of meibomian gland dysfunction. Invest Ophthalmol Vis Sci. 2011;52(4):2050–2064. doi:10.1167/iovs.10-6997g.
- Jones L, Downie LE, Korb D, Benitez-Del-Castillo JM, Dana R, Deng SX, Dong PN, Geerling G, Hida RY, Liu Y, et al. TFOS DEWS II management and therapy report. Ocul Surf. 2017;15(3):575–628. doi:10.1016/j.jtos.2017.05.006.
- Wolffsohn JS, Arita R, Chalmers R, Djalilian A, Dogru M, Dumbleton K, Gupta PK, Karpecki P, Lazreg S, Pult H, et al. TFOS DEWS II diagnostic methodology report. Ocul Surf. 2017;15(3):539–574. doi:10.1016/j.jtos.2017.05.001.
- Bron AJ. Methodologies to diagnose and monitor dry eye disease: report of the diagnostic methodology subcommittee of the international dry eye workshop (2007). Ocul Surf. 2007;5:108–152.
- Hamano H, Kaufman HE. The physiology of the cornea and contact lens applications. New York: Churchill Livingstone; 1987:p. ix. 100, [104] of plates.
- Luke RA, Braun RJ, Driscoll TA, Begley CG, Awisi-Gyau D. Parameter estimation for evaporation-driven tear film thinning. Bull Math Biol. 2020;82(6):71:1–41. doi:10.1007/s11538-020-00745-8.
- Bron AJ, Argueso P, Irkec M, Bright FV. Clinical staining of the ocular surface: mechanisms and interpretations. Prog Retin Eye Res. 2015;44:36–61. doi:10.1016/j.preteyeres.2014.10.001.
- Himebaugh NL, Nam J, Bradley A, Liu H, Thibos LN, Begley CG. Scale and spatial distribution of aberrations associated with tear breakup. Optom Vis Sci. 2012;89(11):1590–1600. doi:10.1097/OPX.0b013e31826cfae5.
- King-Smith PE, Nichols JJ, Nichols KK, Fink BA, Braun RJ. Contributions of evaporation and other mechanisms to tear film thinning and breakup: a review. Optom Vis Sci. 2008;85(8):623–630. doi:10.1097/OPX.0b013e318181ae60.
- Nichols JJ, Mitchell GL, King-Smith PE. Thinning rate of the precorneal and prelens tear films. Invest Ophthalmol Vis Sci. 2005;46(7):2353–2361. doi:10.1167/iovs.05-0094.
- Nichols JJ, King-Smith PE, Hinel EA, Thangavelu M, Nichols KK. The use of fluorescent quenching in studying the contribution of evaporation to tear thinning. Invest Ophthalmol Vis Sci. 2012;53(9):5426–5432. doi:10.1167/iovs.12-10033.
- Webber WR, Jones DP. Continuous fluorophotometric method of measuring tear turnover rate in humans and analysis of factors affecting accuracy. Med Biol Eng Comput. 1986;24(4):386–392. doi:10.1007/BF02442693.
- Lakowicz JR. Principles of Fluorescence Spectroscopy. New York, NY: Springer; 2006:p. 55–56.
- King-Smith PE, Ramamoorthy P, Braun RJ, Nichols JJ. Tear film images and breakup analyzed using fluorescent quenching. Invest Ophthalmol Vis Sci. 2013;54(9):6003–6011. doi:10.1167/iovs.13-12628.
- Tomlinson A, Doane MG, McFadyen A. Inputs and outputs of the lacrimal system: review of production and evaporative loss. Ocul Surf. 2009;7(4):186–129. doi:10.1016/S1542-0124(12)70186-6.
- Peng CC, Cerretani C, Li Y, Bowers S, Shahsavarani S, Lin MC, Radke CJ. Flow evaporimeter to assess evaporative resistance of human tear-film lipid layer. Ind Eng Chem Res. 2014;53(47):18130–18139. doi:10.1021/ie5030497.
- Dursch TJ, Li W, Taraz B, Lin MC, Radke CJ. Tear-film evaporation rate from simultaneous ocular-surface temperature and tear-breakup area. Optom Vis Sci. 2018;95(1):5–12. doi:10.1097/OPX.0000000000001156.
- Kimball SH, King-Smith PE, Nichols JJ. Evidence for the major contribution of evaporation to tear film thinning between blinks. Invest Ophthalmol Vis Sci. 2010;51(12):6294–6297. doi:10.1167/iovs.09-4772.
- King-Smith PE, Fink BA, Nichols JJ, Nichols KK, Braun RJ, McFadden GB. The contribution of lipid layer movement to tear film thinning and breakup. Invest Ophthalmol Vis Sci. 2009;50(6):2747–2756. doi:10.1167/iovs.08-2459.
- Paugh JR, Tse J, Nguyen T, Sasai A, Chen E, De Jesus MT, Kwan J, Nguyen AL, Farid M, Garg S, et al. Efficacy of tear breakup time test in dry eye. Cornea. 2020;39(1):92–98. doi:10.1097/ICO.0000000000002148.
- Abusharha AA, Pearce EI, Fagehi R. Effect of ambient temperature on the human tear film. Eye Contact Lens. 2016;42(5):308–312. doi:10.1097/ICL.0000000000000210.
- Leiske D, Leiske DL, Leiske C, Leiske CI, Leiske D, Leiske DR, Toney M, Toney MF, Senchyna M, Ketelson H, et al. Temperature-induced transitions in the structure and interfacial rheology of human meibum. Biophys J. 2012;102(2):369–376. doi:10.1016/j.bpj.2011.12.017.
- Borchman D, Foulks GN, Yappert MC, Bell J, Wells E, Neravetla S, Greenstone V. Human meibum lipid conformation and thermodynamic changes with meibomian-gland dysfunction. Invest Ophthalmol Vis Sci. 2011;52(6):3805–3817. doi:10.1167/iovs.10-6514.
- Butovich IA. On the lipid composition of human meibum and tears: comparative analysis of nonpolar lipids. Invest Ophthalmol Vis Sci. 2008;49(9):3779–3789. doi:10.1167/iovs.08-1889.
- Lu H, Wojtowicz J, Butovich I. Differential scanning calorimetric evaluation of human meibomian gland secretions and model lipid mixtures: transition temperatures and cooperativity of melting. Chem Phys Lip. 2013;170-171:55–64. doi:10.1016/j.chemphyslip.2013.03.005.
- King-Smith PE, Reuter KS, Braun RJ, Nichols JJ, Nichols KK. Tear film breakup and structure studied by simultaneous video recording of fluorescence and tear film lipid layer, TFLL, images. Invest Ophthalmol Vis Sci. 2013;54(7):4900–4909. doi:10.1167/iovs.13-11878.
- McDonald JE, Brubaker S. Meniscus-induced thinning of tear films. Am J Ophthalmol. 1971;72(1):139–146. doi:10.1016/0002-9394(71)91604-7.
- Holly FJ. Formation and rupture of the tear film. Exp Eye Res. 1973;15(5):515–525. doi:10.1016/0014-4835(73)90064-X.
- Yánez-Soto B, Leonard BC, Raghunathan VK, Abbott NL, Murphy CJ. Effect of stratification on surface properties of corneal epithelial cells. Invest Ophthalmol Vis Sci. 2015;56(13):8340–8348. doi:10.1167/iovs.15-17468.
- Peng CC, Cerretani C, Braun RJ, Radke CJ. Evaporation-driven instability of the precorneal tear film. Adv Colloid Interface Sci. 2014;206:250–264. doi:10.1016/j.cis.2013.06.001.
- de Gennes P-G, Brochard-Wyart F, Quere D. Capillarity and Wetting Phenomena. New York, NY: Springer; 2004.
- Luke RA, Braun RJ, Begley CG. Mechanistic determination of tear film thinning via fitting simplified models to tear breakup. MAIO. 2022;3(1):71–100. doi:10.35119/maio.v3i1.114.
- Zhong L, Braun RJ, Begley CG, King-Smith PE. Dynamics of fluorescent imaging for rapid tear thinning. Bull Math Biol. 2019;81(1):39–80. doi:10.1007/s11538-018-0517-0.
- Luke RA, Braun RJ, Driscoll TA, Awisi-Gyau D, Begley CG. Parameter estimation for mixed mechanism tear film thinning. Bull Math Biol. 2021; 83(5):56–39. doi:10.1007/s11538-021-00871-x.