
Abstract
Purpose
To evaluate the effects of H2O2 as an oxidant on the electroretinogram (ERG) in isolated rat retina.
Methods
Retinas were isolated from rat eyes and perfused with a nutrient solution. ERGs were recorded every 3 min. Once the signal was at a steady state, H2O2 was added to the perfusion solution.
Results
H2O2 caused instantaneous and transient changes in amplitudes and implicit times of the ERG, followed by changes in retinal survival curves. H2O2 0.2 mM produced a rapid increase in b-wave amplitude, followed by a return to the initial value and a survival curve above the control (without H2O2). A slight increase in a-wave was observed, followed by a decrease and a recovery above the control. The slow PIII decreased and then recovered to the initial value. H2O2 0.6 mM induced a small increase in b-wave amplitude, followed by a rapid decrease without recovery. The a-wave and slow PIII decreased rapidly without recovery. The implicit times of the a-wave and b-wave increased moderately with a low dose of H2O2, whereas they significantly increased with a high dose. Whatever the dose, the slow PIII implicit time increased significantly, followed by a return to the initial value. Barium increased the a-wave and b-wave, and then H2O2 reduced the two waves with a stronger effect on the a-wave. Aspartate and barium isolated the fast PIII, which decreased after H2O2 application.
Conclusions
H2O2 affects retinal function as shown by ERGs in isolated rat retina. The response differs with the dose of H2O2, suggesting that mechanisms underlying the action at low doses might be different from those at high doses. Our results also suggest an effect of H2O2 on ionic currents and/or neurotransmitter releases involved in the generation of the ERG and indicate a more pronounced effect on photoreceptors than on postsynaptic cells.
Introduction
Oxidative stress is involved in many ocular pathologies such as age-related macular degeneration (ARMD), various forms of retinopathies, glaucoma, and cataracts.Citation1 Oxidative stress corresponds to an imbalance between reactive oxygen species (ROS) production and anti-oxidative defense mechanisms, causing damage to deoxyribonucleic acids, proteins, and lipids. Hydrogen peroxide (H2O2) is a ROS that is naturally produced in the eye and whose level is increased under certain circumstances. For instance, H2O2 is produced during photo-oxidation of lipofuscin, a fluorescent brown pigment that accumulates in the retina during aging, and lipofuscin accumulation has been associated with ARMD.Citation2 H2O2 has also been shown to increase in retinas exposed to blue light, an identified risk factor for ARMD,Citation3 and in diabetic rat retinas.Citation4 In addition, H2O2 has been reported to be 15-fold higher in the vitreous of rabbit eyes after prolonged light exposure,Citation5 and 2-3 higher in the vitreous of human cataract patients.Citation6 Although there is increasing evidence that H2O2 levels are increased in many ocular diseases, the consequences of the action of H2O2 on normal visual function remain unexplored to date.
Hydrogen peroxide is often considered harmful to the cells, but this oxidant is also involved in the regulation of various physiological processes ranging from normal cellular activity to cell death. Numerous studies conducted in the central nervous system have highlighted the involvement of H2O2 as a potent and rapid modulator of neuronal activity,Citation7–10 ion channel functionCitation11–15 and synaptic neurotransmission.Citation16,Citation17 In the retina, H2O2 has been widely used in vitro as an inducer of oxidative stress in retinal cell cultures, however its ex vivo effect in isolated retinas has been poorly investigated.Citation18,Citation19 To our knowledge, only one in vivo study has evaluated the effect of H2O2 on the retina in mice.Citation20 In these studies, retinal structure and cellular integrity were analyzed, but retinal function was never assessed. Thus, the consequences of the action of H2O2 on retinal function remain unknown.
The electroretinogram (ERG) is an excellent tool for studying retinal function. It represents the electrical signal of the retina in response to a light stimulus. This signal is composed of a series of waves originating from different retinal cells and generated by ion currents. The aim of the present work was to determine the effects of H2O2 on the ERG, using a model of isolated perfused rat retina ERG recording. This is the first study on the effects of H2O2 on retinal function ex vivo.
Materials and methods
Animals
Male Wistar rats weighing 160–180 g were obtained from Depre (Saint-Doulchard, France). Rats were maintained in an animal house with a 12/12 h light/dark cycle. Food and water were supplied ad libitum. All the experiments were conducted in accordance with the ARVO Statement for the Use of Animals in Ophthalmologic and Visual Research.
Isolated retina model
Retina was isolated according to the procedure described elsewhere.Citation21,Citation22 Briefly, the rat was dark-adapted overnight and then sacrificed. Eyes were enucleated, dissected at the equator, and the eyecup was placed in a solution with the following composition: 121.5 mM NaCl, 3.1 mM KCl, 0.4 mM CaCl2, 0.6 mM MgSO4, 24.4 mM NaHCO3, 0.5 mM NaH2PO4, 0.5 mM sodium glutamate, 28 mM glucose, 3% bovine serum. The retina was gently detached from the retinal pigment epithelium and released by cutting at the optic nerve level. The isolated retina was then placed in a chamber continuously perfused with the same solution described above. The perfusion liquid, maintained at 37 °C, was permanently bubbled by a mixture of 95% O2 and 5% CO2. All the preparation procedures were carried out under dim red light.
Electroretinogram (ERG) recording
ERGs were recorded with two Ag/AgCl electrodes connected on either side of the retina, amplified, processed, and stored. The recording bandwidth was set to 0.1-50 Hz. ERGs were elicited every 3 min using a white-light stimulation (0.025 lx.s scotopic, 1 ms). The light stimulus used to generate ERGs was delivered by an optic fiber on the rod outer segment side of the retina. Once the ERG was at a steady state (maximum or 100% of the response), H2O2 was added to the perfusion solution at various concentrations (0.2, 0.3, and 0.6 mM) for 3 h. The amplitudes and implicit times of the b-wave a-wave and slow PIII components versus times were plotted to obtain “the survival curves”.
Data analysis
The amplitude of the a-wave was measured from the baseline to the trough of the a-wave, the amplitude of the b-wave was measured from the trough of the a-wave to the peak of the b-wave, and the amplitude of the slow PIII component was measured from the baseline to the trough of the slow PIII. The implicit times (times to peak) of the a-wave, b-wave, and slow PIII components were measured from the flash onset to the peaks of the waves, respectively. Statistical analysis was performed using a two-way analysis of variance (ANOVA) followed by Tukey’s post hoc test for multiple comparisons. Differences with p-values <0.05 were considered as statistically significant.
Results
Our model of isolated retina affords an ERG in response to light stimulus representing the electrical signal of the neural retina. In our experimental conditions, the signal () is composed of (i) an early negative a-wave reflecting the hyperpolarization of the photoreceptors, (ii) a positive b-wave corresponding primarily to the depolarization of the bipolar cells, and (iii) a negative slow PIII component related to the activities of Müller cells and reflecting K+ currents through Kir4.1 channels.Citation23
Figure 1. Electroretinographic recordings on isolated retina. Isolated rat retina was continuously perfused with a nutrient solution and ERGs were recorded every 3 min. A Example of a single ERG recorded on isolated rat retina in response to white-light stimulation (0.025 lx.s scotopic, 1 ms). The a-wave amplitude was measured from the baseline to the trough of the a-wave, the b-wave amplitude was measured from the trough of the a-wave to the peak of the b-wave, and the amplitude of the slow PIII component was measured from the basal line to the trough of the slow PIII wave. B Example of a b-wave survival curve showing the evolution of the b-wave amplitude (µV) versus time (min) from a representative experiment.
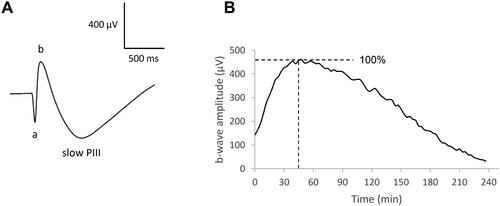
The light stimulus used to generate ERGs was repeated every 3 min, and the amplitudes and implicit times of the waves versus time were plotted to obtain “the survival curves”. shows the ERG b-wave amplitude survival curve of one untreated isolated retina, representing the evolution of the b-wave amplitude as a function of time in the control condition. The pattern of the survival curve is described as follows: first, the b-wave amplitude increases during 30-45 min due to the adaptation of the retina to the environmental conditions; then the amplitude reaches a plateau (stationary phase for approx. 30 min), following by a progressive decrease until the end of the retina survival (150–180 min). We set the time at 0 and the b-wave amplitude at 100% at the beginning of the stationary phase.
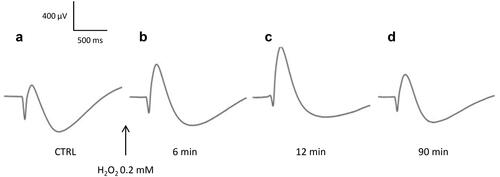
Under these conditions, we were able to follow the evolution of the ERG waves of the retina exposed to H2O2. Our results show that application of H2O2 on isolated retina induces biphasic effects in ERG, characterized by immediate changes in the amplitudes and implicit times of the ERG waves followed by changes in retinal survivals. The effects differ according to the low ("physiological") or high ("pathological") dose of H2O2 used. shows an example of ERGs recorded before () and after () application of H2O2 at 0.2 mM (low dose) on an isolated rat retina. Shortly after the addition of H2O2 (), we observed a significant increase in the b-wave amplitude and a significant reduction in the amplitudes of the a-wave and slow PIII components. The implicit time of the a-wave remained unchanged, that of the b-wave showed a moderate increase, whereas that of the slow PIII component was significantly extended. Ninety minutes after the addition of H2O2 (), all the ERG parameters returned to their initial values.
Figure 2. Representative effect of H2O2 0.2 mM on the ERG waves. Isolated rat retina was continuously perfused with a nutrient solution, and ERGs were recorded in response to white-light stimulation (0.025 lx.s scotopic, 1 ms). ERGs were recorded (a) before application of H2O2, (b) 6 min, (c) 12 min, and (d) 90 min following application of H2O2.
The evolution of the ERG wave's relative amplitudes in the presence of H2O2 is displayed in . Specifically, the application of H2O2 at 0.2 mM on isolated perfused retinas produced an immediate, significant, and transient increase in the amplitude of the b-wave, followed by a decrease and recovery to the initial value. Retinal survival was not affected and even remained above the control thereafter. A similar slight and transient increase in the a-wave amplitude was observed, followed by a decrease and recovery above the control. The amplitude of the slow PIII component decreased and recovered to the initial value. H2O2 at 0.3 mM also induced a rapid increase of the b-wave amplitude, but to a lesser extent than at 0.2 mM, followed by a significant decrease with no recovery. The amplitudes of the a-wave and slow PIII decreased significantly with no recovery. H2O2 delivered at a higher dose of 0.6 mM led to a small increase of the b-wave amplitude, followed by a rapid and significant decrease without recovery. The amplitudes of the a-wave and slow PIII decreased more rapidly and significantly, again without recovery.
Figure 3. Effects of H2O2 on the evolution of the amplitudes and implicit times of the ERG waves. Isolated rat retinas were continuously perfused with a nutrient solution and ERGs were recorded every 3 min in response to white-light stimulation (0.025 lx.s scotopic, 1 ms). ERGs were measured in the absence (CTRL) or in the presence of H2O2 at concentrations of 0.2 mM (H 0.2), 0.3 mM (H 0.3) and 0.6 mM (H 0.6). A The survival curves represent (a) the evolution of the b-wave amplitudes (µV) versus time (min), (b) the evolution of the a-wave amplitudes (µV) versus time (min) and (c) the evolution of the slow PIII-wave amplitudes (µV) versus time (min). B The survival curves represent (a) the evolution of the b-wave implicit times (IT, ms) versus time (min), (b) the evolution of the a-wave implicit times (IT, ms) versus time (min) and (c) the evolution of the slow PIII-wave implicit times (IT, ms) versus time (min). Results are expressed in percentage relative to the initial value (100% of the wave amplitude or implicit time 6 min before injection). Each survival curve represents the average of at least four separate experiments. Dotted lines indicate the time of injection (t = 0 min), 6 min after injection of H2O2 (t = 6 min) and 72 min after injection of H2O2 (t = 72 min).
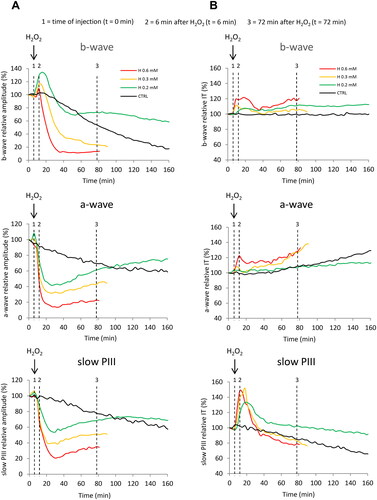
shows the evolution of the ERG wave's relative implicit times in the presence of H2O2. Application of H2O2 at 0.2 mM and 0.3 mM produced a moderate increase in the implicit time of the b-wave, which persisted thereafter. Perfusion with 0.6 mM of H2O2 produced a higher increase in the b-wave implicit time. Regarding the effects on the a-wave implicit time, no significant changes were observed after the addition of H2O2 at 0.2 and 0.3 mM, whereas an increase was observed with the concentration of 0.6 mM. On the other hand, the implicit time of the slow PIII component showed a marked and significant increase, followed by a return to the initial value, for all the concentrations tested.
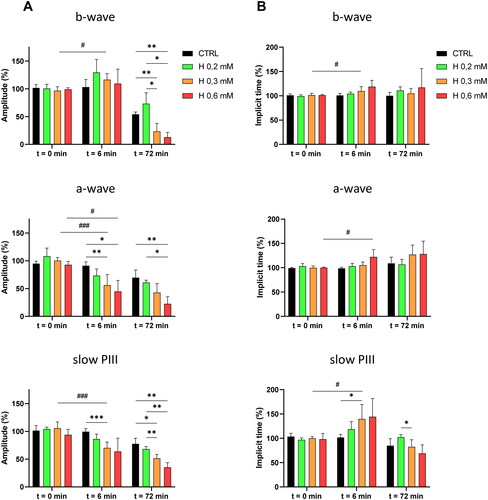
The mean values of the relative amplitudes and implicit times of the ERG waves, calculated at the time of injection (t = 0 min), after 6 min of perfusion with H2O2 (t = 6 min) and after 72 min of perfusion (t = 72 min), are displayed as a histogram in .
Figure 4. Mean values of the relative amplitudes and implicit times of the ERG-waves at the time of injection, and after 6 and 72 min of perfusion with H2O2. Isolated rat retinas were continuously perfused with a nutrient solution and ERGs were recorded in response to white-light stimulation (0.025 lx.s scotopic, 1 ms). ERGs were measured in the absence (CTRL) or in the presence of H2O2 at 0.2 mM (H 0.2), 0.3 mM (H 0.3) and 0.6 mM (H 0.6). Histograms represent the averaged values of (A) the amplitudes of the b-wave, the a-wave and the slow PIII, and (B) the implicit times of the b-wave, the a-wave and the slow PIII. Values were calculated at the time of injection (t = 0 min) and after 6 min (t = 6 min) and 72 min (t = 72 min) of perfusion with H2O2. Results are expressed in percentage relative to the initial value (100% of the wave amplitude or implicit time 6 min before injection). The data are presented as means ± SD (n ≥ 4 separate experiments). *p < 0.05, **p < 0.01, ***p < 0.001, #p < 0.05 and ###p < 0.001. ANOVA followed by Tukey’s posthoc test.
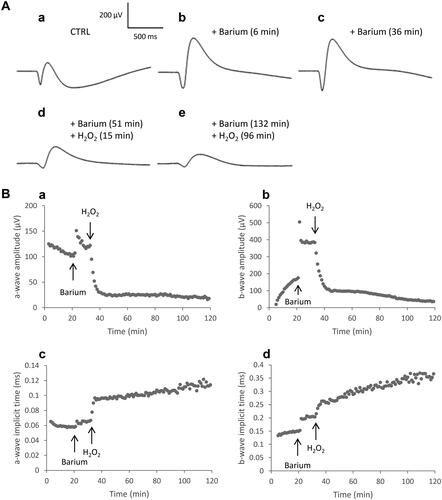
The b-wave recorded from the isolated retina can be masked by the following large, slow and negative component, named the slow PIII. When barium, known to block the slow PIII,Citation24–26 was added to the perfusion solution (), only the negative a-wave (hyperpolarization of photoreceptors) and the subsequent positive b-wave (depolarization of bipolar cells) could be recorded. After the addition of barium 1 mM in the solution, the amplitudes and implicit times of the a-wave and b-wave increased (). When H2O2 0.3 mM was applied in the solution, the amplitudes of the two waves decreased and the implicit times increased (). The ratio of the b-wave amplitude to a-wave amplitude (b/a ratio), which indicates the relation of bipolar cells in response to photoreceptors was calculated. We observed that, whereas a-wave and b-wave amplitudes were reduced, the b/a ratio increased from 4 ± 1 to 6 ± 1 (n = 3). This shows that the amplitude reduction was higher for the a-wave than for the b-wave and may be due to a more pronounced effect of H2O2 on the photoreceptors than on the post-receptoral system.
Figure 5. ERG responses in the presence of H2O2 after barium chloride application. Isolated rat retinas were continuously perfused with a nutrient solution and ERGs were recorded every 3 min in response to white-light stimulation (0.025 lx.s scotopic, 1 ms). Barium chloride (BaCl2, 1 mM) was added to the perfusion solution to suppress the slow PIII and to improve the b-wave. Hydrogen peroxide (H2O2, 0.3 mM) was then applied in the perfusion solution. A Representative ERGs recorded (a) before application of BaCl2 and H2O2, (b) after 6 min of perfusion with BaCl2, (c) after 36 min of perfusion with BaCl2, (d) 15 min following application of H2O2 after 51 min of perfusion with BaCl2, (e) 96 min following application of H2O2 after 132 min of perfusion with BaCl2. B Representative survival curves of (a) the a-wave amplitude, (b) the b-wave amplitude, (c) the a-wave implicit time and (d) the b-wave implicit time.
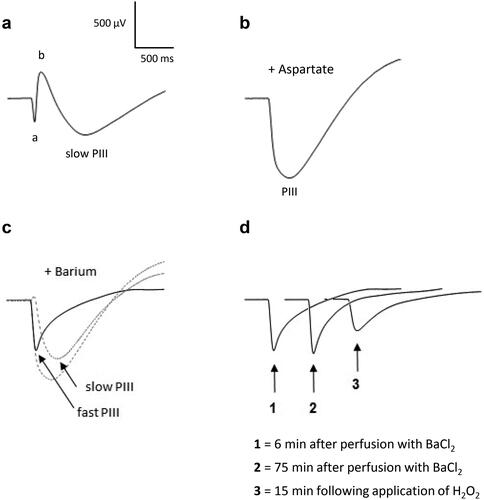
To assess the effect of H2O2 directly on photoreceptors, aspartate 5 mM and barium 1 mM were applied in the perfusion solution (). Aspartate, known to inhibit synaptic transmission from photoreceptors to bipolar cells,Citation27,Citation28 suppresses the b-wave and isolates the PIII-wave (). The PIII-wave is composed of the fast PIII component (photoreceptor current) and the slow PIII component (). Barium, which blocks the slow PIII, was then added to the perfusion medium to isolate the fast PIII, as illustrated in . We observed that the amplitude of the fast PIII component remained unchanged during a 75-minutes period incubation (). When H2O2 0.3 mM was applied in the solution, a decrease in the amplitude was observed after 15 min of incubation, demonstrating the direct action of H2O2 on the photoreceptors. Simultaneously, the implicit time of the fast PIII increased probably due to the decrease of the amplitude.
Figure 6. ERG responses in the presence of H2O2 after aspartate and barium chloride applications. Isolated rat retinas were continuously perfused with a nutrient solution and ERGs were recorded every 3 min in response to white-light stimulation (0.025 lx.s scotopic, 1 ms). Aspartate (Asp, 5 mM) and barium chloride (BaCl2, 1 mM), known to suppress the b-wave and the slow PIII respectively, were added to the perfusion solution to isolate the fast PIII component. Hydrogen peroxide (H2O2, 0.3 mM) was then applied in the perfusion solution. Representative ERGs recorded (a) before application of Asp, BaCl2 and H2O2, (b) after perfusion with Asp, (c) after perfusion with BaCl2 and Asp, (d) following application of H2O2 after perfusion with Asp and BaCl2. The smallest dotted line (slow PIII) in part c was calculated by subtracting the solid line (fast PIII) from the largest dotted line (PIII).
Discussion
Hydrogen peroxide (H2O2) is a ROS that is naturally produced under various physiological processes and whose level increases under certain pathological conditions.Citation29 H2O2 is generated by the photoexcited pigment lipofuscin, which accumulates in the retina during aging, and its accumulation is strongly associated with ARMD.Citation2 The level of H2O2 has also been reported to be increased in the retinas exposed to blue light, an ARMD risk factor, as well as in the retinas of diabetic rats.Citation3,Citation4 Similarly, the concentration of H2O2 was shown to be higher in the vitreous of rabbit eyes after prolonged light exposureCitation5 and in the vitreous of human cataract patients.Citation6 There is increasing evidence that H2O2 is involved in many ocular diseases; however, the consequences of the action of this peroxide on retinal function remain unexplored.
Numerous studies in the central nervous system have demonstrated the implication of H2O2 in the modulation of neuronal activity,Citation7–10 synaptic neurotransmissionCitation16,Citation17 and ion channel activity.Citation11–15 The work published in the literature on the effects of H2O2 in the retina focuses mainly on retinal degeneration models. Hydrogen peroxide has been widely used as an inducer of oxidative stress in in vitro models of retinal cell culture. A few studies have examined its degenerative effects in ex vivo models of isolated perfused retinas,Citation18,Citation19 and only one in vivo study has evaluated the effect of intravitreal H2O2 injection on retinas in mice.Citation20 In these studies, the authors assessed the cellular integrity and the retinal structure by measuring cell viability, histological assessment and in vivo imaging. Cell apoptosis, oxidative stress and expression of various markers of inflammation were also measured. To the best of our knowledge, there is no study in the literature that has focused on the action of H2O2 on retinal function as assessed by electroretinography. It is therefore essential to determine the functional effect of H2O2, which should lead to a better understanding of the pathophysiology of the retina under oxidative stress, as well as to the determination of new therapeutic strategies.
In our study, we report that the exposure of isolated rat retina to H2O2 affects retinal function, as shown by electroretinography. H2O2 causes instantaneous and transient changes in amplitudes and implicit times of some of the ERG waves (phase 1), followed by changes in retinal survival curves (phase 2). The observed effects differ according to the dose of H2O2. Our data show for the first time the impact of low (physiological) to high (pathological) concentrations of H2O2 on ERG properties and suggest a direct effect of this oxidant on ionic currents and/or neurotransmitter release involved in the generation of the signal.
Our results are consistent with the study of LeDay et al. (2004), who reported that exogenous application of H2O2 on isolated bovine retina can alter the release of neurotransmitter glutamate.Citation18 The authors observed that H2O2 at low concentration (100 µM) caused an inhibition of K+-induced [3H]D-aspartate release, whereas higher concentration (1 mM) had no inhibitory effect. We know that hyperpolarization of photoreceptors reduces glutamate release and leads to the appearance of the positive b-wave, so we speculate that the decrease in glutamate release generated by photoreceptor hyperpolarization could add to that induced by H2O2 at low concentrations and thus explain the greater increase in b-wave amplitude observed with H2O2 at 0.2 mM. Similarly, the lack of inhibitory effect of H2O2 at high concentrations on neurotransmitter release could explain the smaller increase in b-wave amplitude at 0.6 mM.
Furthermore, we observed that the survival curve of the retina exposed to H2O2 at 0.2 mM was unaffected and even remained above the control survival curve. This could be explained by the potential neuroprotective role of H2O2 at low concentrations.Citation8,Citation30 The H2O2-induced decrease in neurotransmitter release may play a protective role against excitotoxicity. In contrast, the survival curve of the retina exposed to high concentrations of H2O2 was affected and decreased significantly. This is consistent with the fact that high levels of H2O2 induce neurotoxicity. Taken together, these results suggest that the mechanisms underlying the action of H2O2 at low concentrations might be different from those at high concentrations. We speculate that H2O2 may use more than one mechanism or pathway to affect glutamatergic transmission in the retina.
Glutamate is the main neurotransmitter of the retina. It is released from photoreceptors and bipolar cells via depolarization-evoked activation of L-type calcium channels.Citation31–34 It has been shown in various tissues, including the retina,Citation35 that H2O2 can regulate intracellular calcium homeostasis via voltage-gated calcium channelsCitation36 and intracellular calcium stores.Citation37 Additionally, H2O2 was reported to alter glutamate release in the brain and in the retina.Citation18,Citation38,Citation39 Thus, our results combined with data from the literature showing the effects of H2O2 on intracellular calcium homeostasis and glutamate release, strongly suggest an effect on photoreceptor/bipolar cell synapse (modulation of presynaptic glutamate release and/or postsynaptic glutamate response).
To better understand how H2O2 induces changes in ERG responses, we evaluated the effect of this peroxide on the different components of the signal that were isolated with pharmacological agents. As a consequence of barium addition, which blocks the slow PIII component,Citation24–26 the amplitudes of the a-wave and b-wave improved and stabilized, and the implicit times increased. Application of H2O2 0.3 mM reduced the amplitudes of the two waves with a stronger effect on the a-wave, suggesting a more pronounced effect of H2O2 on photoreceptors than on postsynaptic cells. Simultaneously, the implicit times increased. In another set of experiments, the use of aspartate, known to block the synaptic transmission from photoreceptors to bipolar cells,Citation27,Citation28 isolated the PIII wave composed of the fast PIII (photoreceptor current) and the slow PIII (Müller glial cells response). Following the addition of barium, the fast PIII component was isolated and remained stable for over one hour. A few minutes after the addition of H2O2, a decrease in the amplitude of the fast PIII was observed, demonstrating the action of H2O2 directly on the photoreceptors.
When aspartate was used to isolate the PIII-wave and H2O2 was applied, we observed a reduction in the amplitude of the PIII component and no immediate effect on the implicit time (data not shown). This suggests that the instantaneous and transient increase in the implicit time of the slow PIII observed immediately after application of H2O2 alone, may be a direct consequence of the effect of H2O2 on photoreceptors. Because aspartate blocks photoreceptor responses to second-order neurons in the retina,Citation27,Citation28 the delayed implicit time of the slow PIII observed after application of H2O2 alone may arise from changes in synaptic transmission. The delayed implicit time of the slow PIII could also originate from changes in the homeostasis in Müller glial cells. Indeed, the slow PIII reflects the potassium conductance carried by Kir4.1 channels in Müller cells as a secondary response to the light-induced activity of photoreceptors.Citation23 It has been reported that oxidative stress induced by H2O2 can inhibit the activity of Kir4.1 channels and that acute administration of H2O2 causes osmotic swelling of Müller cells.Citation40,Citation41 The Müller cell swelling reflects an impairment in the rapid osmotically driven water movement across Müller cell membranes after functional inactivation of Kir4.1 channels.Citation40 Functional inactivation or downregulation of Kir4.1 channels have been reported in experimental models of various retinal diseases, such as retinal ischemia reperfusion, ocular inflammation, diabetic retinopathy, retinal detachment and blue light-evoked retinal degeneration.Citation40
A few studies have evaluated the effect of H2O2 on ex vivo models of isolated retina from different species, such as mice, rats or pigsCitation19,Citation42,Citation43 with sometimes contradictory results. In these studies, isolated retinas were exposed for 3 h to H2O2 at doses ranging from 100 to 1000 µM, and immunohistochemical and western-blot analyses were performed after several hours or several days. Surprisingly, the effect of H2O2 on photoreceptors was not described in these studies. For instance, Hurst and collaborators (2017) have evaluated the degenerative effects of oxidative stress on the porcine ex vivo retina treated with 100 to 500 µM H2O2 for 3 h.Citation19 While bipolar and amacrine cells were not significantly affected, a degeneration of retinal ganglion cells was observed at all H2O2 concentrations. Additionally, activation of microglia was detected for H2O2 100 µM. Macroglia was not significantly affected by H2O2. In another study conducted in 2020,Citation42 porcine retinal explants were exposed to H2O2 300 µM for 3 h. The authors observed a loss of bipolar, amacrine and ganglion cells, a late effect on microglia and no effect on macroglial response. In the mouse retina, Ulyanova et al. (2001) observed that H2O2 induced a strong heme oxygenase-1 immunoreactivity in Müller cells, but not in other retinal cells, whereas GFAP expression staining in Müller cells was not altered.Citation43 One in vivo study has also examined the effect of intravitreal injection of H2O2 (5-10 µg/µl) in mice.Citation20 The authors observed cell degeneration in all layers of the retina with photoreceptors being the most severely damaged. The ganglion cell layer was only poorly affected.
The concentrations of H2O2 used in our study are similar to those reported in previous ex vivo studies (100-1000 µM) evaluating the effect of H2O2 on isolated retinas,Citation18,Citation19,Citation42,Citation43 and are in the range of concentrations expected in the retina. For instance, H2O2 in the vitreous of rabbit eyes was estimated at 110 µM after prolonged light exposureCitation5 and might be even higher in the retina since H2O2 is released by illuminated photoreceptors. Likewise, the H2O2 level in the vitreous of human patients with cataract was found to be 160 µM.Citation5
In summary, we demonstrate that exposure of isolated rat retina to H2O2 affects retinal function, as shown by ERG recordings. H2O2 caused instantaneous and transient changes in amplitudes and implicit times of some of the ERG waves, followed by changes in retinal survival curves. The effects differ with the dose of H2O2, suggesting that the mechanisms underlying the action of H2O2 at low doses might be different from those at high doses. Our results also suggest a direct effect of H2O2 on ionic currents and/or neurotransmitter releases involved in the generation of the ERG and indicate a more pronounced effect of H2O2 on photoreceptors than on postsynaptic cells. It is possible that the effects of H2O2 occur directly and exclusively on photoreceptors (i.e. with no direct effect on postsynaptic cells). Decreased photoreceptor responses would affect the subretinal potassium change, decreasing the slow PIII, as well as the synaptic drive to bipolar cells, decreasing the b-wave. However, it could not be proved that there were no effects on other cells. Further studies will be necessary to tackle this point and to examine in more details the mechanisms by which H2O2 induces changes in ERG waves (modulation of ion conductance/synaptic transmission in retinal cells). Interestingly, Sies et al. (2017, 2020) have recently pointed outCitation44,Citation45 the pleiotropic and dose-dependent role of H2O2 in the redox regulation of various activities including receptors, ion channels, enzymes and transcription factors at low physiological levels, and in the disruption of redox signaling leading to oxidative damage at high concentrations, corroborating our observations in the retina.
Disclosure statement
No potential conflict of interest was reported by the author(s).
Data availability statement
The data that support the findings of this study are available from the corresponding author upon reasonable request.
References
- Payne A, Kaja S, Naumchuk Y, Kunjukunju N, Koulen P. Antioxidant drug therapy approaches for neuroprotection in chronic diseases of the retina. Int J Mol Sci. 2014;15(2):1865–1886. doi: 10.3390/ijms15021865.
- Jarrett SG, Boulton ME. Consequences of oxidative stress in age-related macular degeneration. Mol Aspects Med. 2012;33(4):399–417. doi: 10.1016/j.mam.2012.03.009.s
- Shang Y-M, Wang G-S, Sliney DH, Yang C-H, Lee L-L. Light-emitting-diode induced retinal damage and its wavelength dependency in vivo. Int J Ophthalmol. 2017;10(2):191–202. doi: 10.18240/ijo.2017.02.03.
- Ellis EA, Guberski DL, Somogyi-Mann M, Grant MB. Increased H2O2, vascular endothelial growth factor and receptors in the retina of the BBZ/WOR diabetic rat. Free Radic Biol Med. 2000;28(1):91–101. doi: 10.1016/S0891-5849(99)00216-6.
- Taguchi H, Ogura Y, Takanashi T, Hashizoe M, Honda Y. In vivo quantitation of peroxides in the vitreous humor by fluorophotometry. Invest Ophthalmol Vis Sci. 1996;37(7):1444–1450.
- Bhuyan KC, Bhuyan DK, Podos SM. Lipid peroxidation in cataract of the human. Life Sci. 1986;38(16):1463–1471. doi: 10.1016/0024-3205(86)90559-X.
- Avshalumov MV, Chen BT, Koós T, Tepper JM, Rice ME. Endogenous hydrogen peroxide regulates the excitability of midbrain dopamine neurons via ATP-sensitive potassium channels. J Neurosci. 2005;25(17):4222–4231. doi: 10.1523/JNEUROSCI.4701-04.2005.
- Rice ME. H 2 O 2: a Dynamic Neuromodulator. Neuroscientist. 2011;17(4):389–406. doi: 10.1177/1073858411404531.
- Ohashi M, Hirano T, Watanabe K, Shoji H, Ohashi N, Baba H, Endo N, Kohno T. Hydrogen peroxide modulates neuronal excitability and membrane properties in ventral horn neurons of the rat spinal cord. Neuroscience. 2016;331:206–220. doi: 10.1016/j.neuroscience.2016.06.033.
- Ostrowski TD, Hasser EM, Heesch CM, Kline DD. H2O2 induces delayed hyperexcitability in nucleus tractus solitarii neurons. Neuroscience. 2014;262:53–69. doi: 10.1016/j.neuroscience.2013.12.055.
- Annunziato L, Pannaccione A, Cataldi M, Secondo A, Castaldo P, Di Renzo G, Taglialatela M. Modulation of ion channels by reactive oxygen and nitrogen species: a pathophysiological role in brain aging? Neurobiol Aging. 2002;23(5):819–834. doi: 10.1016/S0197-4580(02)00069-6.
- Lebuffe G, Schumacker PT, Shao Z-H, Anderson T, Iwase H, Vanden Hoek TL. ROS and NO trigger early preconditioning: relationship to mitochondrial K ATP channel. Am J Physiol Heart Circ Physiol. 2003;284(1):H299–H308. doi: 10.1152/ajpheart.00706.2002.
- Akaishi T, Nakazawa K, Sato K, Saito H, Ohno Y, Ito Y. Hydrogen peroxide modulates whole cell Ca2+ currents through L-type channels in cultured rat dentate granule cells. Neurosci Lett. 2004;356(1):25–28. doi: 10.1016/j.neulet.2003.11.012.
- Sesti F, Liu S, Cai S-Q. Oxidation of potassium channels by ROS: a general mechanism of aging and neurodegeneration? Trends Cell Biol. 2010;20(1):45–51. doi: 10.1016/j.tcb.2009.09.008.
- Sesti F. Oxidation of K + channels in aging and Neurodegeneration. Aging Dis. 2016;7(2):130–135. doi: 10.14336/AD.2015.0901.
- Takahashi A, Mikami M, Yang J. Hydrogen peroxide increases GABAergic mIPSC through presynaptic release of calcium from IP3 receptor-sensitive stores in spinal cord substantia gelatinosa neurons: h 2O2 mobilizes presynaptic calcium. Eur J Neurosci. 2007;25(3):705–716. doi: 10.1111/j.1460-9568.2007.05323.x.
- Ohashi M, Hirano T, Watanabe K, Katsumi K, Ohashi N, Baba H, Endo N, Kohno T. Hydrogen peroxide modulates synaptic transmission in ventral horn neurons of the rat spinal cord: Action of hydrogen peroxide in spinal ventral horn neurons. J Physiol. 2016;594(1):115–134. doi: 10.1113/JP271449.
- LeDay AM, Awe SO, Kulkarni K, Harris LC, Opere C, Dash A, Ohia SE. Effect of Peroxides on [3H]d-aspartate release from bovine isolated retinae. Neurochem Res. 2004;29(4):811–818. doi: 10.1023/B:.NERE.0000018855.77589.5d.
- Hurst J, Kuehn S, Jashari A, Tsai T, Bartz-Schmidt KU, Schnichels S, Joachim SC. A Novel porcine ex vivo retina culture model for oxidative stress induced by H2O2. Altern Lab Anim. 2017;45(1):11–25. doi: 10.1177/026119291704500105.
- Huang B, Liang J-J, Zhuang X, Chen S-W, Ng TK, Chen H. Intravitreal injection of hydrogen ;peroxide induces acute retinal degeneration, apoptosis, and oxidative stress in mice. Oxid Med Cell Longev. 20182018:5489476. doi: 10.1155/2018/5489476.
- Doly M, Braquet P, Bonhomme B, Meyniel G. Effects of lipid peroxidation on the isolated rat retina. Ophthalmic Res. 1984;16(6):292–296. doi: 10.1159/000265332.
- Cia D, Cluzel J, Jacquemot N, Doly M. Effects of bevacizumab (Avastin®) on the Electroretinogram of Isolated Rat Retina. Ophthalmic Res. 2011;46(3):145–151. doi: 10.1159/000324136.
- Frishman LJ. Origins of the electroretinogram. Princ Pract Clin Electrophysiol Vis. 2006;2:139–183.
- Dmitriev AV, Dmitriev AA, Linsenmeier RA. Extracellular K + reflects light-evoked changes in retinal energy metabolism. Exp Eye Res. 2022;221:109133. doi: 10.1016/j.exer.2022.109133.
- Peachey NS, Sturgill-Short GM. Response properties of slow PIII in the Large vls mutant. Doc Ophthalmol. 2012;125(3):203–209. doi: 10.1007/s10633-012-9347-9.
- Kofuji P, Ceelen P, Zahs KR, Surbeck LW, Lester HA, Newman EA. Genetic Inactivation of an inwardly rectifying potassium channel (Kir4.1 Subunit) in mice: phenotypic Impact in Retina. J Neurosci. 2000;20(15):5733–5740. doi: 10.1523/JNEUROSCI.20-15-05733.2000.
- Hanawa I, Tateishi T. The effect of aspartate on the electroretinogram of the vertebrate retina. Experientia. 1970;26(12):1311–1312. doi: 10.1007/BF02112997.
- Lüke M, Weiergräber M, Brand C, Siapich SA, Banat M, Hescheler J, Lüke C, Schneider T. The isolated perfused bovine retina—A sensitive tool for pharmacological research on retinal function. Brain Res Brain Res Protoc. 2005;16(1-3):27–36. doi: 10.1016/j.brainresprot.2005.09.001.
- Di Marzo N, Chisci E, Giovannoni R. The role of hydrogen peroxide in redox-dependent signaling: homeostatic and pathological responses in Mammalian Cells. Cells. 2018;7(10):156. doi: 10.3390/cells7100156.
- Ohia SE, Opere CA, LeDay AM. Pharmacological consequences of oxidative stress in ocular tissues. Mutat Res. 2005;579(1–2):22–36. doi: 10.1016/j.mrfmmm.2005.03.025.
- Barnes S, Kelly MEM. Calcium channels at the photoreceptor synapse. Adv Exp Med Biol. 2002;514:465–476. doi: 10.1007/978-1-4615-0121-3_28.
- Berntson A, Taylor WR, Morgans CW. Molecular identity, synaptic localization, and physiology of calcium channels in retinal bipolar cells. J Neurosci Res. 2003;71(1):146–151. doi: 10.1002/jnr.10459.
- Palmer MJ, Hull C, Vigh J, von Gersdorff H. Synaptic cleft acidification and modulation of short-term depression by exocytosed protons in retinal bipolar cells. J Neurosci. 2003;23(36):11332–11341. doi: 10.1523/JNEUROSCI.23-36-11332.2003.
- Shi L, Chang JY-A, Yu F, Ko ML, Ko GY-P. The contribution of L-type Cav1.3 channels to retinal light responses. Front Mol Neurosci. 2017;10:394. doi: 10.3389/fnmol.2017.00394.
- Agostinho P, Duarte CB, Carvalho AP, Oliveira CR. Oxidative stress affects the selective ion permeability of voltage-sensitive Ca2+ channels in cultured retinal cells. Neurosci Res. 1997;27(4):323–334. doi: 10.1016/S0168-0102(96)01165-0.
- Ostrowski TD, Dantzler HA, Polo-Parada L, Kline DD. H2O2 augments cytosolic calcium in nucleus tractus solitarii neurons via multiple voltage-gated calcium channels. Am J Physiol Cell Physiol. 2017;312(5):C651–C662. doi: 10.1152/ajpcell.00195.2016.
- Gerich FJ, Funke F, Hildebrandt B, Fasshauer M, Müller M. H2O2-mediated modulation of cytosolic signaling and organelle function in rat hippocampus. Pflugers Arch. 2009;458(5):937–952. doi: 10.1007/s00424-009-0672-0.
- Gilman SC, Bonner MJ, Pellmar TC. Effect of oxidative stress on excitatory amino acid release by cerebral cortical synaptosomes. Free Radic Biol Med. 1993;15(6):671–675. doi: 10.1016/0891-5849(93)90172-Q.
- Zoccarato F, Valente M, Alexandre A. hydrogen peroxide induces a long-lasting inhibition of the Ca2+-dependent glutamate release in cerebrocortical synaptosomes without interfering with cytosolic Ca2+. J Neurochem. 1995;64(6):2552–2558. doi: 10.1046/j.1471-4159.1995.64062552.x.
- Reichenbach A, Bringmann A. Müller cells in the healthy retina. In: Müller Cells Healthy and Diseased Retina. New York: Springer; 2010;p. 35–214.
- Karl A, Wurm A, Pannicke T, Krügel K, Obara-Michlewska M, Wiedemann P, Reichenbach A, Albrecht J, Bringmann A. Synergistic action of hypoosmolarity and glutamine in inducing acute swelling of retinal glial (Müller) cells. Glia. 2011;59(2):256–266. doi: 10.1002/glia.21095.
- Mueller-Buehl AM, Doepper H, Grauthoff S, Kiebler T, Peters L, Hurst J, Kuehn S, Bartz-Schmidt KU, Dick HB, Joachim SC, et al. Oxidative stress‐induced retinal damage is prevented by mild hypothermia in an ex vivo model of cultivated porcine retinas. Clin Exp Ophthalmol. 2020;48(5):666–681. doi: 10.1111/ceo.13731.
- Ulyanova T, Szél A, Kutty RK, Wiggert B, Caffé AR, Chader GJ, van Veen T. Oxidative stress induces heme oxygenase-1 immunoreactivity in Müller cells of mouse retina in organ culture. Invest Ophthalmol Vis Sci. 2001;42(6):1370–1374.
- Sies H. Hydrogen peroxide as a central redox signaling molecule in physiological oxidative stress: oxidative eustress. Redox Biol. 2017;11:613–619. doi: 10.1016/j.redox.2016.12.035.
- Sies H, Jones DP. Reactive oxygen species (ROS) as pleiotropic physiological signalling agents. Nat Rev Mol Cell Biol. 2020;21(7):363–383. doi: 10.1038/s41580-020-0230-3.