
Abstract
Purpose
The aim of this article was to investigate whether Schirmer strips gathered during clinical dry eye examinations can be prepared for omics analyses in a standardized way, to adjust for variations in tear volume and enable two separate omics analyses from the same sample. In addition, the intention was to investigate whether fluorescein dye instillation in the eyes gave bias effects on metabolomic analysis.
Methods
Twelve samples from six individuals, with normal or reduced tear production, were collected. Half of the samples were harvested after instillation of fluorescein in the eye. Each strip was divided in half along the length and prepared with a new method for extracting tear content from the Schirmer strip. The new method was established to compensate for different dilutions of metabolites in varying Schirmer strip wetting levels when using identical extraction volume for all samples. Metabolomic data were compared in samples with and without fluorescein dye and Schirmer strips ranging from 1 to 35 mm wetting levels using a global LC–MS method.
Results
All samples were successfully analyzed with an average of ∼350 relevant features detected per sample after using both positive and negative electrospray ionization mode, despite low tear volumes in some samples and that only one half of the Schirmer strips were used. Principal component analysis plots and heatmaps revealed no bias effects of fluorescein dye presence or different Schirmer strip values when using the proposed method.
Conclusion
A high number of relevant metabolomic features can be extracted from longitudinally cut halves of Schirmer strips, which may enable analyses with more than one omics modality from the same sample. With the pre-analytical method described, Schirmer strips can be used for metabolomic analyses even in cases of very low or high tear volume with or without fluorescence.
Introduction
The human tear film is vital to the health of the ocular surface. It consists of a complex mixture of proteins, lipids, carbohydrates, and electrolytes, all of which play a role in maintaining ocular health. Abnormalities found in the tear film may indicate the presence of systemic diseases, or directly reflect the health of the ocular surface.Citation1 Extensive investigations into the tear film have previously been limited by its small volume, but recent technological advancements have made it possible to analyze tear composition thoroughly.Citation2 Omics research, a rapidly evolving multi-disciplinary field that includes genomics, transcriptomics, proteomics, and metabolomics, has proven to be an efficient approach in search of pathophysiological mechanisms and biomarkers. Metabolomics is the newest discipline, complementary to the other omics technologies and closest to the clinical phenotype.Citation3–6
Metabolomics, and its subfield lipidomics, are gaining popularity partly due to the ability of “global” or” untargeted” detection of metabolites.Citation7 The use of liquid chromatography (LC) combined with mass spectrometry (MS) enables quantitative measurement of thousands of metabolites with a wide analyte coverage from a small biological sample.Citation8 However, the metabolomic profile acquired is determined by the analytical characteristics of the method applied and thus it is not possible to cover every metabolite from the highly hydrophilic to the highly lipophilic in one analytical run. While metabolomics aims to encompass hydrophilic, as well as amphiphilic and some hydrophobic compounds, lipidomics focus on hydrophobic and amphipathic molecules. Together, these two characterize most of the metabolome, the complete set of small-molecule chemicals (typically <1.5 kDa) found within a biological sample.Citation9 A thorough characterization of the metabolites present in tear film (the tear metabolome) and investigation of changes in the tear metabolome in different eye-health related conditions can potentially improve the diagnosis, prognosis, and treatment efficacy of ocular surface disorders.
Although technology is improving, there is still a distinct lack of standardization in both collection and preservation of tear samples as well as tear omics analytical methods.Citation3 As a result, inter-study is difficult, and the feasibility and clinical application of the results are limited. Tear sampling is usually carried out using absorbent materials, like Schirmer stripsCitation3 or glass capillary tubes.Citation10 The former has been presumed being favorable, mainly due to the least discomfort it imposes on the patient and the ease of its performance under conditions such as low tear volume.Citation10 Moreover, it is used routinely for measuring the reflex tear production of the eye and for diagnosis of aqueous deficient dry eye (ADDE) disease, which make it widely available.Citation11 Despite the simple sampling technique, several methodological challenges for the use of Schirmer strips in omics analyses exist.
First, an unresolved technical issue is how to achieve two interchangeable samples from each eye, which can be highly advantageous if more than one omics modality is to be used. Therefore, the intention was to find a method of extracting samples for two analysis modalities from the same tear film. This could be solved by taking samples from both eyes at the same time, or two samples from the same eye subsequently. However, ocular surface signs can vary immensely between eyes over timeCitation12 and it is likely that this is the case also with metabolites. Few studies have looked at inter-eye differences or effects of subsequent analyses from the same eye with respect to metabolites.Citation13,Citation14 Hence, we decided to use only one Schirmer sample per eye and to divide it longitudinally for the possibility of performing more than one analysis. Previous studies have shown that metabolites absorbed within Schirmer strips are not evenly distributed along the wetted parts of the papers,Citation15 especially at the proximal end which has a higher abundance of lipid classes.Citation6 As a result, using proximal and distal parts of the Schirmer strips would result in varying composition, even though it was harvested from the same eye at the same time. This encouraged us to cut the Schirmer strips longitudinally in half, store one part (for future omics analysis) and process the other half for metabolomics analysis, to test whether the proposed method made it possible for intergroup comparisons.
Second, since patients have variations in reflex tearing, Schirmer strips will not contain the same tear volume. Reflex tears have also shown to have different lipid composition compared to basal tears.Citation16 Nevertheless, when investigating patients with low tear production, Schirmer (without anesthetics) has been recommended as it includes both reflex and basal tears, yielding higher volume for analysis.Citation17 However, different tear volumes, e.g. Schirmer 1 mm versus Schirmer 35 mm, make it hard to unbiasedly quantify and directly compare metabolites. This issue is further exacerbated with the use of standard extraction volumes prior to analysis, as it might result in either diluting or concentrating effects. Therefore, we set forth to overcome this potential bias effect by adjusting the extraction volume according to the tear production measured by the Schirmer strip.
Finally, the tear film is easily disrupted, and for clinical examination a pre-set order of measurement is recommended to minimize disturbances with the most invasive tests being performed in the end. According to a consensus report regarding dry eye diagnostics, osmolarity of the tear film are to be measured first, following tear film break up time, fluorescein dye staining, and thereafter tear production with Schirmer strips.Citation11 Consequently, Schirmer tear samples used in combined clinical and metabolomic testing would be contaminated with fluorescein dye from the ocular surface. We sought to examine whether fluorescein dye in Schirmer tear samples would interfere with the metabolomics results compared to samples taken from eyes with no prior fluorescein contamination. To our knowledge, no previous LC–MS-based omics have investigated such an effect.
Materials and methods
Study subjects
Schirmer tear samples from 12 eyes of 6 volunteers with and without ADDE (with normal and reduced tear production) were collected from an ophthalmologic clinic in Oslo (The Norwegian Dry Eye Clinic). The samples were handled anonymously and the use of Schirmer was part of a routine examination that the patients were scheduled for. Prior to data collection, informed consent was obtained from all participants. All procedures performed in this study were in compliance with the Declaration of Helsinki. Storage of samples/biobank was approved by the Regional Committee for medical and Health Research Ethics in Norway (Ref. 2020/140664).
Tear sample collection
Tear samples were collected using Schirmer I strip (TearFlo, Krakow, Poland). The strip consists of two parts, one small basal flap which during application is placed inside the lower eyelid, toward the lower bulbar conjunctiva. The second external part absorbs the tear film and has millimeter markings which display the amount of tear fluid absorbed. Higher values indicate more tear film absorbed, with 35 mm being the highest value corresponding to complete wetting. To evaluate the effects of fluorescein on the metabolomics analysis, 0.2 mL fluorescein was applied to the fornix of one eye (n = 6) of each volunteer leaving the other eye free (n = 6). After 1 min, Schirmer strips were installed on the lower eyelid margin for 5 min, without topical anesthetics. The wetting levels were noted right after removal and the strips were immediately transferred to Eppendorf tubes. Samples containing fluorescein were marked with a capital F to avoid mix-up between the samples. Each sample was left to dry for 24 h with the tubes open, after which they were closed and stored at −80 °C for two weeks. Prior to analysis, each strip was thawed and meticulously divided longitudinally into two equal halves by a sterile pair of scissors, with one part of the strip chosen for metabolomics analysis. The remaining Schirmer half was restored at −80 °C for future analysis.
Metabolomics
Chemicals (LC–MS analysis)
For reconstitution of the samples, an extraction solution comprised of 80% aqueous methanol with 0.1% formic acid was used. All water used was of type 1 (>18 MΩ cm) from a MilliQ ultrapure water purification system (Merck Millipore, Darmstadt, Germany). The formic acid (98%) used was also obtained from Merck Millipore (Darmstadt, Germany). LC–MS-grade methanol was obtained from Rathburn Chemicals (Walkerburn, Scotland).
Sample preparation and analysis
All samples were collected at the same office in 1 day by one technician, minimizing variations in temperature, humidity, and sample handling. We developed a standard procedure for dilution and extraction of the tear sample adjusting for the varying wetting levels (1–35 mm) of the Schirmer samples.
For the conjunctival flap of the strip, representing a valid part of the tear collection with ∼5 mm length, 50 µL extraction solution was allocated. Thereafter, 10 µL of solution was added for each mm of wetted paper (). This procedure was performed after splitting the Schirmer strips as described below.
Figure 1. Sample preparation procedure. Each Schirmer strip was divided in half longitudinally for metabolomics and potential lipidomics analyses. After removing unwetted part, the remaining was carefully cut into smaller pieces and placed in an Eppendorf tube before adding extraction solution. For calculating required amount, 10 µL of extraction solution was allocated for each mm of wetted strip, plus 50 µL for the ∼5 mm length conjunctival flap as a baseline. Created with BioRender.com.
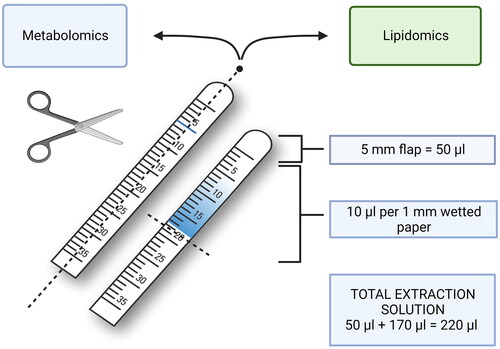
For sample preparation, each Schirmer strip was divided precisely in half along the length of the strip. Excess Schirmer paper beyond the level of the wetted paper was removed. The remaining wetted part was cut into small pieces to make sure it could be covered in extraction solution, and subsequently returned to the original Eppendorf tube. The calculated amount of extraction solution in accordance with the wetting level of the strip was added and the Eppendorf tube was thermomixed using Thermomixer Comfort (Eppendorf, Hamburg, Germany) for 1.5 h at 40 °C. Next, tubes were vortexed (Reax Top Vortex Mixer, Heidolph, Schwabach, Germany) and centrifuged (Megafuge 1.0R, Heraeus, Hanau, Germany) for 10 min at 3600 relative centrifugal force (RCF). The supernatant of each sample was transferred to corresponding LC vials with glass inserts for metabolomics analysis. A pooled quality control (PQC) sample was prepared by mixing 20 µL of all the 12 samples. Pooled group samples, with and without fluorescein, respectively, were prepared by mixing 20 µL of the six samples from each group. A blank sample consisting of an unused Schirmer strip was prepared in the same way as the other samples. The exact volume of extraction solution added in the blank sample was based on the average Schirmer value of the 12 samples involved.
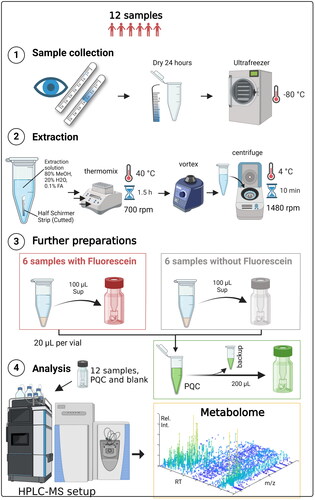
The four types of samples (with and without fluorescein, PQC, and blank) were analyzed using “full MS mode” according to the procedure described in the previous paper.Citation9 The tear samples were analyzed in random order. PQC samples were analyzed between every 4th sample to correct for instrumental drift. The pooled group samples (fluorescein +/−) were analyzed using data dependent tandem mass spectrometry (MSMS) mode to obtain fragmentation spectra (resolution: 17 500 full width at half maximum (FWHM) (at m/z 200), AGC target value: 5e5 ion counts, maximum injection time: 100 ms and dynamic exclusion time: 10 s, and stepped normalized collision energy: 20, 50, and 80). All samples were analyzed using electrospray ionization (ESI) operated in both positive (ESI+) and negative (ESI−) ionization mode, as the combined methods offer more comprehensive metabolome coverage than the use of a single polarity.Citation18 The analytical workflow is illustrated in .
Figure 2. Flowchart demonstrating the process of obtaining the metabolome in the present study. HPLC: high-performance liquid chromatography; MS: mass spectrometry; PQC: pooled quality control; rpm: rounds per min; RT: retention time; Rel. Int.: relative intensity; m/z: mass/charge. Created with BioRender.com.
Data processing and statistics
Software used to acquire data were Xcalibur 4.4, Tune 2.13, and SII 1.7 for Xcalibur 4.5. FreeStyle 1.8 was used to observe extracted ion chromatogram and mass spectra of the acquired data. Compound Discoverer 3.3 was used for data processing and statistical analysis with the workflow template “Untargeted Metabolomics with Statistics Detect Unknowns with ID Using Online Databases and mzLogic”. All software was from Thermo Scientific (Bremen, Germany). BioRender (https://www.biorender.com/) (San Francisco, CA) was used for illustrations.
ChemSpider (http://www.chemspider.com/), Human Metabolome Database (https://hmdb.ca/), Global Natural Products Social Molecular Networking (https://gnps.ucsd.edu/ProteoSAFe/static/gnps-splash.jsp), MassBank of North America (https://mona.fiehnlab.ucdavis.edu/), and mzCloud (https://www.mzcloud.org/) databases were used to search for identification of features using the molecular weight, predicted formula, and/or MSMS fragmentation spectrum.
Retention time (RT) alignment using an adaptive curve model with maximum shift of 2 min across samples was performed. Unknown compounds were detected using a mass tolerance of 5 ppm, signal-to-noise threshold at 3 and minimum peak intensity at 1e6. Compound grouping across all samples was performed using a mass tolerance of 5 ppm and RT tolerance of 0.2 min. Gaps were filled across all samples and chemical backgrounds, using blank samples, were filtered. Quality control-based batch normalization was applied using PQC samples with Cubic Spline regression model. Features with relative standard deviation >30% in PQC samples were filtered.
Noteworthy, MSMS spectrum was only investigated to verify the identity of fluorescein in the samples. No further feature identification or comparison of samples at metabolites level was performed.
To look for overall global differences in the metabolomes between the different Schirmer values, and the global effect of fluorescein versus clean samples, all metabolomic data were subjected to principal component analysis (PCA), by Compound Discoverer, to reduce the dimensionality of the large data sets, by transforming them into smaller sets of variables that retain most of the information in the large set. PCA is commonly used in many fields, ranging from theoretical physics to biology and chemistry.Citation19 The axes that represent variations are “principal components” (PC), with PC1 representing the component associated with the most variation in the data and PC2 representing the component associated with the second most variation in the data. If the global collection of metabolites in samples is similar, they will have a similar position on the PCA plots. The more dissimilar the individual metabolomes are, the wider apart they will be positioned in the PCA plot.
Results
Twelve tear film samples were collected from six individuals, one eye with fluorescein and the other without. Two males and four females were recruited, with ages ranging from 27 to 80 years. All samples were successfully analyzed with an average of 1100 features detected per sample from both ESI + and ESI − mode. After thorough quality assessment and bioinformatic filtering, an average of 350 relevant features (ESI+: 246 and ESI−: 97) were subjected to further analyses.
PCA plot was used to look for overall differences and similarities between the different Schirmer values and use of fluorescein. Clustering of the PQC samples signifies low analytical variance throughout the instrumental run, certifying the further use of the global metabolomics data in statistical analyses (). On the ESI + plot, Schirmer values show extensive variation, with notably lower values (2–7 mm) representing large variation on PC1 but less variation on PC2. Higher Schirmer values (11–25 mm) show overall less variations, but still no sign of clustering. Two possible outliers 18 and 2F, portraying respective Schirmer length and use of fluorescein, have distinctly different PCA positionings.
Figure 3. PCA plots showing overall differences or similarities between samples having different Schirmer values and fluorescein application in positive (ESI+) and negative (ESI−) ionization mode. Each dot represents a sample, with the overlying number showing Schirmer length and “F” letter designating the use of fluorescein. The X-axis, or PC1, represents the most variation in the data, and PC2 or Y-axis representing the second most variations.
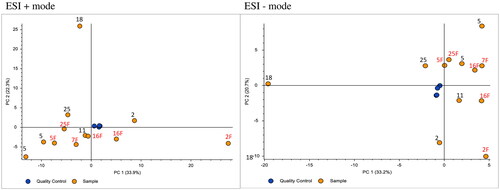
On the ESI − plot, Schirmer values show less variation on PC1 in general, but higher variance on PC2. Similar to the ESI + plot, samples with low (2–7 mm) and high (18–25 mm) value show major variation. As for ESI+, sample 18 is present as a distinct outlier. Samples containing fluorescein show no overall signs of clustering on PC1 or PC2 of ESI+. In contrast, they are generally located closer on PC1 of ESI − plot. However, the larger variation exists on PC2 of the same plot. Moreover, samples without fluorescein have similar positioning indicating no distinct pattern.
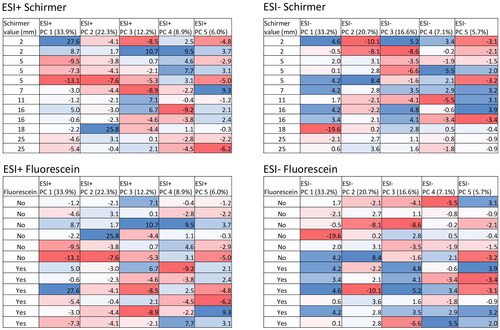
demonstrates the variations and overall patterns after plotting heatmap based on PCA values from PC1 to PC5 for both Schirmer value and use of fluorescein. The color differences appear random – with no distinct pattern – suggesting that there are no systematic effects of Schirmer value or presence of fluorescein on the metabolome using the proposed method. There does appear to be a gradual color change in PC2 (ESI+), but there were several outliers present. The same can be applied for the use of fluorescein. If fluorescein had affected the overall analysis, all samples containing this substance would have had similar positions on the PCA plot, with similar color on the heat map. No overall color pattern is present, with values varying greatly in both groups.
Figure 4. Heatmap with corresponding PCA values for both Schirmer values and fluorescein in positive and negative ionization mode (ESI + and ESI−) to show variations and overall patterns. Values are represented with colors and numbers. Blue representing high PC numbers and red low. Each table is shown in both positive and negative ionization mode, comprising four tables in total.
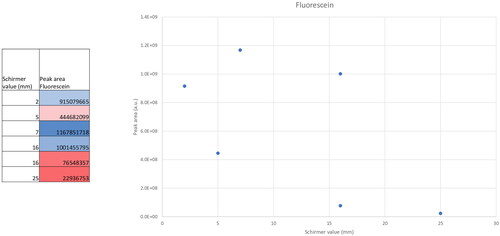
Fluorescein was detected in all samples gathered from eyes where fluorescein had been instilled at level 1 of confidence (RT and MSMS spectrum match with reference standard); the highest grade of confidence in metabolite identification.Citation20 Fluorescein had no visible interference on LC–MS outputs when compared to samples from unstained eyes. In addition, the concentration or peak area of fluorescein showed a negative trend with increasing Schirmer value, as would be expected with a minor diluting effect (). Taken together, the data suggest that the application of fluorescein prior to tear sample collection on Schirmer strip did not adversely affect the analysis of metabolites identified in our study.
Figure 5. The comparison of peak area (equivalent to concentration) for fluorescein in samples with different Schirmer value. The negative trend in fluorescein level (Y-axis) can be seen following gradual increase of Schirmer value (X-axis) due to minor diluting effect.
Discussion
In our workflow, we developed a procedure for tear sampling and sample preparation using Schirmer strips, to possibly enable two omics analyses, by cutting the Schirmer strips longitudinally. Also, we adjusted the volume of extraction solution depending on the varying wetting levels (1–35 mm) of the Schirmer samples. Our results showed that the method was feasible for combined LC–MS global metabolomic analysis with enough metabolite features for intergroup comparisons, even from eyes with very low tear production. There was no observed clustering of samples in the PCA plots, not even for fluorescein negative and fluorescein-containing samples, which would suggest the absence of bias effect of fluorescein contamination from the clinical examination.
With different tear volumes sampled by Schirmer strips, no gold standard approach exists for standardizing sample preparations prior to analysis. This is a significant obstacle when comparing samples across studies. In most cases, an entire strip is dissected before being dissolved in the fixed volume of extraction solution assigned for all samples before analysis.Citation15,Citation21–25 This is not an ideal method as collected eluents from Schirmer samples with lower tear volumes (e.g. from ADDE patients) are likely to have more diluted metabolomes than Schirmer strips with higher tear volumes. Using the same volume of extraction solution would therefore act as a diluting agent in cases of low tear volume compared to higher volumes, which is especially relevant to DED patients.
Unlike the other studies mentioned above, Zong et al.Citation21 adjusted the extraction volume according to the mm of wetting of Schirmer paper in a study comparing metabolomics from patients with superior limbic keratitis (SLK) with a control group. The authors only included patients with sufficient wetting of Schirmer strips, which may lead to under-reporting of results from severely dry eyes. Their adjustment method resembles this proposed method, with some modifications that may be important for tear film studies of DED. For example, the basal portion of the Schirmer paper adjacent to the conjunctiva (i.e. the conjunctival flap) was included in the present study as part of the mm of wetting. This flap holds a significant tear volume and metabolites from the conjunctival surface that should be extracted with sufficient amounts of fluid, even if the Schirmer strip value may be 0–1 mm in severe ADDE. Hence, our suggested method would avoid under-reporting of the most severely affected patients with small tear volumes.
Several other approaches for analysis of low tear volume have also been described. Dammeier et al. found low inter-eye differences for metabolites, suggesting that tears may be pooled between eyes to increase the volume available for analysis.Citation13 In addition, Brown et al. reported low intraindividual variations of both metabolites and lipids, indicating the possibility of collecting samples at different time intervals repeatedly.Citation14 However, in both cases, no corresponding ocular surface symptoms such as tear breakup time or osmolality were recorded. This may limit the capability of correlating laboratory results with clinical findings, as ocular surface criteria may vary between eyes. It is possible that day to day variations, or the results of a previous Schirmer paper application to the eye, affect metabolomic and/or lipidomic analyses because of the associations between tear film and the environmental conditions.Citation12,Citation26,Citation27 It is also worth mentioning that inter-eye differences in tear lipid profiles have not been investigated. We believe that the best practice presently is to limit tear sampling to one eye, unless future findings shed new light on inter-eye differences.
Our proposed method includes an entire length of the Schirmer strip, collected from the same eye at the same time. It encompasses the whole gradient of metabolites present, limits the effect of inter-eye difference, and eliminates the need for combined sampling over several days. Moreover, it provides a possibility for combined metabolomic and other analyses from a single strip. This is of particular interest when it comes to combining lipidomics and metabolomics from the same sample to cover a greater range of metabolites. For lipidomics, other extraction fluids and processing than metabolomics are needed in order to detect most of the hydrophobic molecules.Citation9 Further studies are needed to find whether longitudinal halves of Schirmer strips are sufficient for global lipidomics analysis. Although the platform and workflow for lipidomic analysis have been established, no lipidomic analysis has been performed on Schirmer halves so far.
When comparing the metabolomes using PCA, no clustering of fluorescein-containing versus fluorescein-free samples was found, and to our knowledge, this is the first LC–MS-based metabolomics study to compare samples with or without fluorescein. This suggests that metabolomics analysis can be executed on Schirmer strips that are instilled on the eye after the fluorescein dye test is performed, as recommended for clinical examination.Citation11 However, the finding does not exclude that fluorescein may have an impact on specific metabolites, even though the global pattern is not affected.
Concerning metabolomic analysis, no comparison of the two halves of the Schirmer strip was performed, nor comparisons between entire strips versus longitudinally cut half strips. As a result, it is unknown whether the metabolites either are distributed equally between longitudinal halves or if the concentrations would have been different compared to entire Schirmer samples. As far as we know, no studies have compared metabolite distribution between Schirmer longitudinal halves. If an entire strip was to be extracted, the extraction volume would have to be approximately doubled compared to a longitudinally cut strip, to sufficiently wet the strip and provide sufficient sample volume. Thus, there is no reason to expect higher concentrations in intact versus longitudinally cut strips.
Although significant efforts were made to avoid any confounding issues with regards to the analysis, potential contamination from gloves worn during sample collection or skin contamination from the patient could not be entirely eliminated. To prevent contamination of the Schirmer strip and ensure accurate metabolome interpretation, sterile gloves were worn during sample collection and handling throughout the analysis. However, contamination from the gloves themselves cannot be completely ruled out. Additionally, direct contamination from the patient’s skin was impossible to avoid. Therefore, it is possible that skin contamination may be present in samples included in the analysis. Possible metabolites present on the Schirmer paper from the manufacturer was excluded by including blank Schirmer paper controls that were used to subtract any pre-existing metabolites.
In conclusion, longitudinal division of the Schirmer strip and adjustment of extraction volume according to tear wetting is feasible and may possibly enable (1) two omics analyses to be performed from one sample and (2) inclusion of severely ADDE in metabolomic studies. Schirmer strips used in clinical DE examination after instillation of fluorescein to the eye can be used without bias effect on global metabolomics analysis.
Author contributions
Morten Gundersen – conceptualization, methodology, investigation, formal analysis, and writing – original draft. Per Jensen – conceptualization, methodology, and investigation. Christian Nilsen – conceptualization, methodology, and investigation. Mazyar Yazdani – writing – review and editing, visualization, and supervision. Øygunn Utheim – conceptualization, methodology, and supervision. Elise Mørk Sandås – formal analysis, data curation, and visualization. Helge Rootwelt – conceptualization and methodology. Kjell Gunnar Gundersen – conceptualization, methodology, supervision, and funding acquisition. Katja Benedikte Prestø Elgstøen – conceptualization, methodology, and supervision.
Acknowledgements
The authors thank Rick Portvin for reading the manuscript and providing valuable feedback and Hans-Otto Böhm for assistance in the preliminary experiments.
Disclosure statement
No potential conflict of interest was reported by the author(s).
Data availability statement
The data that support the findings of this study are available from the corresponding author, [M.G.], upon reasonable request.
Additional information
Funding
References
- Hagan S, Martin E, Enríquez-de-Salamanca A. Tear fluid biomarkers in ocular and systemic disease: potential use for predictive, preventive and personalised medicine. EPMA J. 2016;7(1):15. doi: 10.1186/s13167-016-0065-3.
- Tan SZ, Begley P, Mullard G, Hollywood KA, Bishop PN. Introduction to metabolomics and its applications in ophthalmology. Eye. 2016;30(6):773–783. doi: 10.1038/eye.2016.37.
- Khanna RK, Catanese S, Emond P, Corcia P, Blasco H, Pisella PJ. Metabolomics and lipidomics approaches in human tears: a systematic review. Surv Ophthalmol. 2022;67(4):1229–1243. doi: 10.1016/j.survophthal.2022.01.010.
- Yazdani M, Elgstøen KBP, Rootwelt H, Shahdadfar A, Utheim ØA, Utheim TP. Tear metabolomics in dry eye disease: a review. Int J Mol Sci. 2019;20(15):3755. doi: 10.3390/ijms20153755.
- Chen L, Zhou L, Chan EC, Neo J, Beuerman RW. Characterization of the human tear metabolome by LC–MS/MS. J Proteome Res. 2011;10(10):4876–4882. doi: 10.1021/pr2004874.
- Lam SM, Tong L, Duan X, Petznick A, Wenk MR, Shui G. Extensive characterization of human tear fluid collected using different techniques unravels the presence of novel lipid amphiphiles. J Lipid Res. 2014;55(2):289–298. doi: 10.1194/jlr.M044826.
- Chen L, Gao Y, Wang LZ, Cheung N, Tan GSW, Cheung GCM, Beuerman RW, Wong TY, Chan ECY, Zhou L. Recent advances in the applications of metabolomics in eye research. Anal Chim Acta. 2018;1037:28–40. doi: 10.1016/j.aca.2018.01.060.
- Patti GJ, Yanes O, Siuzdak G. Innovation: metabolomics: the apogee of the omics trilogy. Nat Rev Mol Cell Biol. 2012;13(4):263–269. doi: 10.1038/nrm3314.
- Skogvold HB, Sandås EM, Østeby A, Løkken C, Rootwelt H, Rønning PO, Wilson SR, Elgstøen KBP. Bridging the polar and hydrophobic metabolome in single-run untargeted liquid chromatography–mass spectrometry dried blood spot metabolomics for clinical purposes. J Proteome Res. 2021;20(8):4010–4021. doi: 10.1021/acs.jproteome.1c00326.
- Posa A, Bräuer L, Schicht M, Garreis F, Beileke S, Paulsen F. Schirmer strip vs. capillary tube method: non-invasive methods of obtaining proteins from tear fluid. Ann Anat. 2013;195(2):137–142. doi: 10.1016/j.aanat.2012.10.001.
- Wolffsohn JS, Arita R, Chalmers R, Djalilian A, Dogru M, Dumbleton K, Gupta PK, Karpecki P, Lazreg S, Pult H, et al. TFOS DEWS II diagnostic methodology report. Ocul Surf. 2017;15(3):539–574. doi: 10.1016/j.jtos.2017.05.001.
- Guillon M, Shah S. Rationale for 24-hour management of dry eye disease: a review. Cont Lens Anterior Eye. 2019;42(2):147–154. doi: 10.1016/j.clae.2018.11.008.
- Dammeier S, Martus P, Klose F, Seid M, Bosch D, D’Alvise J, Ziemssen F, Dimopoulos S, Ueffing M. Combined targeted analysis of metabolites and proteins in tear fluid with regard to clinical applications. Transl Vis Sci Technol. 2018;7(6):22. doi: 10.1167/tvst.7.6.22.
- Brown SH, Kunnen CM, Papas EB, Lazon de la Jara P, Willcox MD, Blanksby SJ, Mitchell TW. Intersubject and interday variability in human tear and meibum lipidomes: a pilot study. Ocul Surf. 2016;14(1):43–48. doi: 10.1016/j.jtos.2015.08.005.
- Cicalini I, Rossi C, Pieragostino D, Agnifili L, Mastropasqua L, di Ioia M, De Luca G, Onofrj M, Federici L, Del Boccio P. Integrated lipidomics and metabolomics analysis of tears in multiple sclerosis: an insight into diagnostic potential of lacrimal fluid. Int J Mol Sci. 2019;20(6):1265. doi: 10.3390/ijms20061265.
- Rohit A, Stapleton F, Brown SH, Mitchell TW, Willcox MD. Comparison of tear lipid profile among basal, reflex, and flush tear samples. Optom Vis Sci. 2014;91(12):1391–1395. doi: 10.1097/OPX.0000000000000411.
- Rentka A, Koroskenyi K, Harsfalvi J, Szekanecz Z, Szucs G, Szodoray P, Kemeny-Beke A. Evaluation of commonly used tear sampling methods and their relevance in subsequent biochemical analysis. Ann Clin Biochem. 2017;54(5):521–529. doi: 10.1177/0004563217695843.
- Lei Z, Huhman DV, Sumner LW. Mass spectrometry strategies in metabolomics. J Biol Chem. 2011;286(29):25435–25442. doi: 10.1074/jbc.R111.238691.
- Giuliani A. The application of principal component analysis to drug discovery and biomedical data. Drug Discov Today. 2017;22(7):1069–1076. doi: 10.1016/j.drudis.2017.01.005.
- Salek RM, Steinbeck C, Viant MR, Goodacre R, Dunn WB. The role of reporting standards for metabolite annotation and identification in metabolomic studies. Gigascience. 2013;2(1):13. doi: 10.1186/2047-217X-2-13.
- Zong Y, Cheng C, Li K, Xue R, Chen Z, Liu X, Wu K. Metabolomic alterations in the tear fluids of patients with superior limbic keratoconjunctivitis. Front Med. 2021;8:797630. doi: 10.3389/fmed.2021.797630.
- Ambaw YA, Fuchs D, Raida M, Mazengia NT, Torta F, Wheelock CE, Wenk MR, Tong L. Changes of tear lipid mediators after eyelid warming or thermopulsation treatment for meibomian gland dysfunction. Prostaglandins Other Lipid Mediat. 2020;151:106474. doi: 10.1016/j.prostaglandins.2020.106474.
- Ambaw YA, Timbadia DP, Raida M, Torta F, Wenk MR, Tong L. Profile of tear lipid mediator as a biomarker of inflammation for meibomian gland dysfunction and ocular surface diseases: standard operating procedures. Ocul Surf. 2022;26:318–327. doi: 10.1016/j.jtos.2020.09.008.
- Lam SM, Tong L, Duan X, Acharya UR, Tan JH, Petznick A, Wenk MR, Shui G. Longitudinal changes in tear fluid lipidome brought about by eyelid-warming treatment in a cohort of meibomian gland dysfunction. J Lipid Res. 2014;55(9):1959–1969. doi: 10.1194/jlr.P051185.
- Lam SM, Tong L, Reux B, Duan X, Petznick A, Yong SS, Khee CB, Lear MJ, Wenk MR, Shui G. Lipidomic analysis of human tear fluid reveals structure-specific lipid alterations in dry eye syndrome. J Lipid Res. 2014;55(2):299–306. doi: 10.1194/jlr.P041780.
- Chlasta-Twardzik E, Górecka-Nitoń A, Nowińska A, Wylęgała E. The influence of work environment factors on the ocular surface in a one-year follow-up prospective clinical study. Diagnostics. 2021;11(3):392. doi: 10.3390/diagnostics11030392.
- Martin R, EMO Research Group. Symptoms of dry eye related to the relative humidity of living places. Cont Lens Anterior Eye. 2023;46(4):101865. doi: 10.1016/j.clae.2023.101865.