
Abstract
Purpose
To evaluate the repeatability of the Zernike coefficients in healthy eyes when monocular accommodation was stimulated at different vergences demands.
Methods
A total of 36 right eyes from healthy volunteers were prospectively and consecutively recruited for this study. Wavefront aberrometry was conducted to objectively characterize the ocular optical quality during accommodation, from the individual’s far point to a 5 D accommodation demand in steps of 0.5 D. The repeatability of Zernike coefficients up to the fourth order was assessed by calculating the within-eye repeatability (Sw), the coefficient of repeatability (CR), the coefficient of variation (CV), and the intraclass correlation coefficient (ICC) as an indicator of measurement reliability.
Results
Correlation among repeated measurements showed high reliability (ICC > 0.513) for all parameters measured except some fourth-order Zernike coefficients, C(4, −4) (ICC < 0.766), C(4, −2) (ICC < 0.875), C(4, 2) (ICC < 0.778) and C(4, 4) (ICC < 0.811). Greater repeatability and less variability were obtained for high-order Zernike coefficients (CR < 0.154), although an increase in CR in the coefficients analyzed was observed with increasing accommodative demand. No clear trend was evident in CV; however, it was observed that the low-order Zernike coefficients exhibit lower CV (CV < 1.93) compared to the high-order Zernike coefficients (CV > 0).
Conclusions
The reliability of Zernike coefficients up to the fourth order in healthy young individuals demonstrated a strong consistency in measuring terms up to the fourth order, with more variability observed for high-order terms. The Zernike coefficients up to the third order exhibited the highest level of repeatability.
Introduction
Ocular aberrations are optical imperfections of the eye that cause deviations from a perfect image formation on the retina and can affect the quality of vision.Citation1 The human eye is not a perfect optical system, and it suffers from aberrations, both high-order aberrations (HOAs) and low-order aberrations (LOAs), in its natural state.Citation2 Aberrations can cause variations in optical vergence across the entrance pupil of the eye; varying with pupil diameter, age, refractive error, near work, and accommodation which may contribute to the regulation and modulation of eye growth or refractive error development.Citation1
In the past, vision correction systems like ophthalmic lenses and contact lenses were designed to correct basic refractive errors such as myopia, hyperopia, or astigmatism. However, most of these systems are limited in their ability to compensate for higher order aberrations. In recent years, there have been significant advancements in evaluating and correcting ocular aberrations.Citation3 One prominent technique is wavefront technology, which allows for precise measurement of individual eye aberrations.Citation4 With this detailed information, eye care professionals can design personalized solutions to correct specific aberrations for each patient.Citation5–8
The Hartmann–Shack wavefront sensor has been one of the most used techniques to measure these aberrations.Citation9 It uses an array of lenslets to sample the wavefront from the eye capturing detailed information about the present aberrations. Provides high spatial resolution, allowing for precise measurement of aberrations across the entire pupil. The Hartmann–Shack system has been extensively studied and validated over the years. It is a well-established technique for measuring ocular aberrations, and its reliability and accuracy have been demonstrated in numerous scientific studies and clinical applications.Citation10–15
Aberrations in the eye are not stable. Besides factors such corneal irregularities and a tear film instability can lead to an increase in aberrations,Citation16,Citation17 but the main contributor is ocular accommodation.Citation11,Citation18–20 Accommodation is the ability of the eye to adjust its focus and maintain clear vision at different distances. It is controlled by the contraction and relaxation of the ciliary muscles, which change the shape of the lens to adjust its refractive power. During accommodation, the shape of the lens changes to bring objects at different distances into focus on the retina.Citation21,Citation22 However, this dynamic adjustment of the lens also introduces changes in the wavefront and can lead to variations in the ocular aberrations.Citation11,Citation18–20 This dynamic nature of aberrations due to accommodation makes it challenging to precisely correct them with static correction methods. So, it is important to consider the accommodation effect when evaluating and correcting ocular aberrations. Measurement and correction of aberrations may need to be performed under specific accommodation conditions or with the individual’s natural accommodation in play to obtain accurate and personalized results.
The Zernike coefficients are mathematical representations used to describe the wavefront aberrations of an optical system. These coefficients are derived from the Zernike polynomials, which are a set of orthogonal functions that can represent various types of optical aberrations.Citation23–25 The change in the lens shape introduces additional wavefront aberrations to the eye’s optical system. These aberrations trends are described in the literature, the primary spherical aberration became more negative with the increasing accommodation demand.Citation11,Citation18,Citation26–28 The effects on the coefficients of spherical aberration, and third and fourth-order coma have been studied in more detail,Citation18,Citation28 but not systematic trend was found. Furthermore, these studies have not focused on evaluating the repeatability of the measurements obtained at different accommodative vergences. The specific effect of accommodation on the Zernike coefficients can vary depending on factors such as the individual’s age, the degree of accommodation, and the baseline aberrations of the eye (refractive error).
Several studies have addressed the repeatability of staticCitation29–33 and dynamicCitation34,Citation35 measurements of wavefront aberration. However, currently, no studies specifically address the repeatability and variability of wavefront measurement when accommodation is stimulated, with a Hartman–Shack system.
Therefore, this study aimed to quantitatively assess the intra-operator Zernike coefficients’ repeatability and variability in young healthy right eyes when stimulated by monocular accommodation.
Material and methods
Sample description
A prospective study was done of healthy subjects, students from the University of Zaragoza, Spain. The study adhered to the tenets of the Declaration of Helsinki for the use of human participants in biomedical research and was approved by the Clinical Research Ethics Committee of Aragón (CEICA) under reference number PI21-074. All participants signed informed consent forms after receiving an explanation of the purpose of the study.
The sample consisted of 36 healthy individuals (11 men, 25 women) between 19 and 31 years old. Of these participants, 36 right eyes (RE) were included. The participants underwent a thorough optometric assessment including best-corrected visual acuity (BCVA) for both distance vision (DV) and near vision (NV), and monocular accommodative amplitude (AA) evaluation, accommodative and convergence facility in both monocular and binocular vision in NV. Only those subjects who fulfilled the inclusion criteria were eligible to take part in the experiment, it included BCVA > 0.8 decimal (20/25 on the Snellen chart) in both eyes, refractive error less than −9 diopters (D) of myopia, +2.5 D of hyperopia and −1 D of astigmatism, no ocular or systemic disorder which affect the accommodative response (AR), such as diabetes, topical medication such as eye drops or ointment, aphakia, corneal refractive surgery, corneal distortion, keratoconus, pregnancy or lactating.
The sample size of 36 individuals was determined to investigate a correlation coefficient of 0.6, with a 5% Type I error, a 20% Type II error, and an anticipated data loss rate of 20%, using Epidat® 4.2 software (Department of Health, Government of Galicia, A Coruña, Spain).
Instruments
For ocular aberration measurements an irx3 aberrometer (irx3, Imagine Eyes, Orsay, France), which follows the Hartmann–Shack principle to measure the whole wavefront of the eye, was used. This device incorporates a built-in fixation target specifically designed for central measurements. This target consists of a black 6/12 Snellen letter “E” displayed on a white background. Spatial frequency of the stimulus is 230 µm. The entire target subtends a field of approximately 0.7° × 1.0° and has a luminance of 85 cd/m2.Citation36,Citation37
While the subject fixates the target inside the device, an infrared beam of wavelength 780 nm hits the retinal fundus. This infrared beam is then backscattered by the retina and travels back through the ocular surfaces. The infrared beam exits the eye and projects directly onto a Hartmann-Shack wavefront sensor which has a 32 × 32 lenslet array. The deviations of these points from the reference points are used by the software to calculate the wavefront.Citation38
Experimental measurements and data processing
All measurements were performed under natural pupils’ conditions without application of any mydriatic or cycloplegic drug. While the fixation target presented a photopic stimulus at 85 cd/m2 as stated in the methodology, the room was completely darkened, and the computer screen luminance further dimmed and turned away from the subject’s position in the chinrest to minimize pupil miosis due to environmental light. All the measurements were performed during the same visit. To compare each of the results, the wavefronts were rescaled to a common pupil, in this case 4 mm, using the method described by SchwiegerlingCitation39 and corrected by Visser et al.Citation12
The measured eyes fixated on the target, while the contralateral eye was occluded, to ensure a larger pupil in the measured eye. The subject received explicit instructions to maintain fixation on a smaller discernible element within the presented stimulus target. At each incremental accommodation state, three successive measurements were acquired, culminating in a total of thirty-three measurements per subject eye. Based on the findings of Efron et al.,Citation40 who reported that repeating the measurements three times did not result in any improvement in repeatability, three wavefront measurements (Zernike coefficient up to fourth order) were taken for each eye by stimulating accommodation from 0 D to 5 D (in 0.5 D steps).
To improve accuracy in the subject’s AR, a brief pause in the movement of the target was implemented, lasting for a duration of 2 s. Throughout the sequential modulation of accommodation, which encompassed a cumulative temporal span of 22 s, the subject was afforded the opportunity to blink as necessary and the measurements being collected between blinking intervals at least 2 s after the last blink. This allowance was made in order to mitigate the potential emergence of optical aberrations attributed to changes at the air-tear film interface.
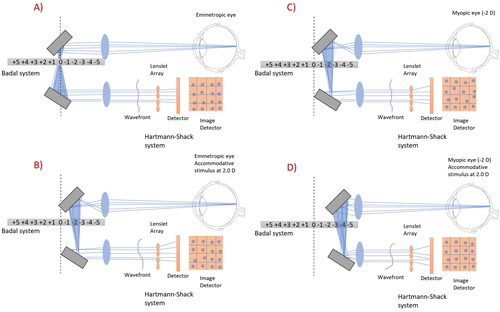
No refractive corrections were worn throughout the aberrometric measurement sessions to obtain the spherical equivalent (SE) of the subjects under scotopic lighting conditions based on each patient’s own refraction, looking for the less accommodative state of the eye. Starting from SE, calculations were automatically made by the aberrometer to stimulate accommodation in steps of 0.5 D (from 0 to −5 D). A representation of the experimental setup is presented in .
Figure 1. Graphical representation of the measurement of ocular aberrations with the commercial aberrometer irx3. (A) Emmetropic subject with relaxed accommodation, (B) emmetropic subject with 2 D of induced accommodation, (C) −2 D myopic subject with relaxed accommodation, the stimulus is displayed at the subject’s remote point so that can see it clearly, and (D) myopic subject with 2 D of induced accommodation.
Aberrations were originally exported for a maximum round pupil, in the pupil plane, in the form of Zernike coefficients, C(n,m), where n is the radial order of the polynomials and m the azimuthal frequency according to the standards.Citation25,Citation41 The following values were exported for low-order: oblique astigmatism C(2,−2), spherical defocus C(2,0), and vertical astigmatism C(2,2); and for HOAs up to the fourth order: oblique trefoil C(3,−3), vertical coma C(3,−1), horizontal coma C(3,1), horizontal trefoil C(3,3), oblique quatrefoil C(4,−4), oblique secondary astigmatism C(4,−2), spherical aberration C(4,0), vertical secondary astigmatism C(4,2), and vertical quatrefoil C(4,4).
Under scotopic illumination conditions and during accommodation stimulation, variations in pupil diameter occur. To proper comparison among measurements, Zernike coefficients obtained for each accommodative demand were rescaled to a common pupil diameter of 4 mm. This rescaling was achieved using a custom-made Matlab code (R2022b, Mathworks, MA, USA), following the rescaling equation proposed by Visser et al.Citation12
Data analysis
After preparing the raw data as explained, Microsoft Excel (Microsoft Office Excel 2016, Microsoft Corporation) was used to analyse and condense the Zernike coefficients. Statistical analysis was performed using SPSS version 28.0.1.0 (SPSS 28, SPSS Inc., IBM Corporation, Somers, New York, USA). Intrasession repeatability was assessed for every Zernike coefficient up to the fourth order at each accommodative stimulus. In order to do it, these parameters were evaluated:Citation42
Within-eye repeatability (Sw) was obtained by calculating the variance of the measurements, which were obtained by squaring the standard deviation of the measurements for each subject. The individual variances were then averaged, and the square root taken to give within-eye repeatability.
The coefficient of repeatability (CR), also known as the reliability coefficient or reproducibility coefficient, is a statistical measure that assesses the agreement or consistency of repeated measurements made on the same individual or item under similar conditions. It is especially useful in research studies and clinical measurements where it is desired to determine the reliability of an instrument or measurement method. The CR is the range that contains 95% of repeated measurements and was calculated by multiplying the within-eye repeatability by 2.77 (representing 2 × 1.96) as described by Bland and Altman.Citation43
The coefficient of variation (CV) is a relative measure of dispersion used to compare the variability between different data sets. CV was calculated by dividing the Sw by the average of the measurement value. This gives the ratio of repeatability relative to the measurements taken, with a lower number indicating less variation.
To assess the reliability of the repeated measurements, the intraclass correlation coefficients (ICCs) for absolute agreement were calculated and used to evaluate concordance for continuous variables and correct correlations for systematic bias.Citation44 The ICC interpretation was poor reliability (for values between 0 and 0.30), fair reliability (values from 0.30 to 0.50), moderate strong reliability (values between 0.60 and 0.80), very strong reliability (for values of ICCs higher than 0.80).
Results
Thirty-six healthy subjects, 36 RE eyes, who met the inclusion criteria previously described were enrolled in the study (11 men, 25 women) between 19 and 31 years old (25.61 ± 3.49 years). The refractive error ranged from +2.5 D to −9 D SE. On average, the refractive error for the RE was -2.85 ± 2.64 D, and for the LE was −3.15 ± 2.49 D.
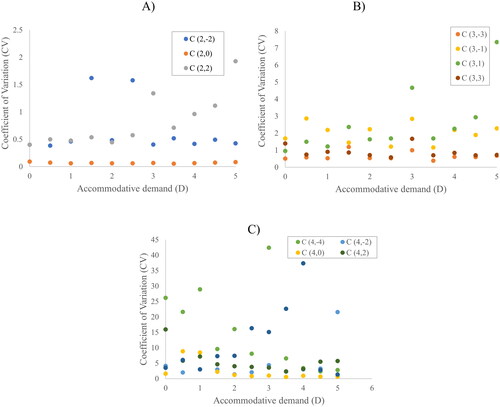
There was no clear trend in CVs; however, it was observed that the LOA Zernike coefficients () exhibit lower CVs compared to the HOA Zernike coefficients ( and ). The HOA coefficients also showed an increase in values with increasing order, but no consistent trend was observed with increasing accommodative demand.
Table 1. Results of the repeatability analysis for the second order Zernike Coefficient C (2,−2), C (2,0) and C (2,2) at each accommodative demand.
Table 2. Results of the repeatability analysis for the second-order Zernike Coefficient C (3,−3), C (3,−1), C (3,1) and C (3,3) at each accommodative demand.
Table 3. Results of the repeatability analysis for the second order Zernike Coefficient C (4,−4), C (4,−2), C (4,0), C (4,2) and C (4,4) at each accommodative demand.
Globally, in all the Zernike coefficients studied (both LOA and HOA), an increase in Sw was obtained as the accommodative demand increased from far point to 5 D. Higher absolute Sw values were observed in the Zernike coefficients of defocus C(2,0) (). However, it is noteworthy that despite the increase in the Sw parameter, (A)), illustrates that this particular Zernike coefficient exhibits the lowest CV. This phenomenon can be attributed to the fact that smaller variations, particularly when the mean is diminutive, tend to exert a more pronounced influence on the coefficient of variability.Citation45
Figure 2. The CV of second-order (A), third-order (B), and fourth-order (C) aberrations across the eleven accommodative demands.
Concerning the CR results, there was an observed rise in absolute values as the accommodative demand increases. The maximum CR value was 0.706 µm, corresponding to the C(2,0) coefficient at 5 D accommodation demand, when a mean value of 3.067 µm was recorded. Specifically, the highest CR values are presented in , corresponding to this term, defocus.
The reliability of repeated measurements exhibited a strong correlation (ICC > 0.513) for all the parameters assessed, except for certain fourth-order Zernike coefficients, C(4, −4) (ICC < 0.766), C(4, −2) (ICC < 0.875), C(4,2) (ICC < 0.778) and C(4,4) (ICC < 0.811).
Second-order Zernike coefficients
The mean values of the Zernike coefficients of defocus increased significantly with accommodation from 1.254 µm to 3.067 µm (). This myopization of the eye was normal due to the increased power of the lens to focus the required accommodative demand. An increase of the mean Zernike coefficient C(2,−2), on a lower scale was also observed in the . However, the mean Zernike coefficient C(2,2) showed a decrease in magnitude with increasing accommodative demand ().
Third-order Zernike coefficients
The mean values of the Zernike coefficients C(3,−1), C(3,1) and C(3,3) increased in magnitude as the stimulated accommodative demand increases (). However, the Zernike coefficient C(3, −3) decreased in magnitude as the accommodative demand increases ().
Fourth-order Zernike coefficients
The mean primary spherical aberration C(4,0) () underwent a shift from positive to negative values with increasing accommodative demand. In this case, it became zero at an accommodative demand of 1D.
The other fourth-order Zernike coefficients () did not show clear trends of increasing or decreasing mean Zernike coefficients when accommodation was stimulated.
Discussion
The young eye’s accommodative response is known to exhibit intersubject variability.Citation26–28 In the current study, the Zernike coefficient C(2,0) consistently displayed positive values across all stimulated accommodative demands (), which can be attributed to the predominantly myopic nature of the sample recruited. Regarding the fourth-order spherical aberration (), the values change from positive to negative, resulting in a sign change occurring at about 1 D of vergence. Cheng et al.Citation26 also observed similar sign changes in spherical aberration around 1 D of accommodation. Radhakrishnan et al.,Citation45 note a sign change around 1 D for subjects younger than 20 years, with a shift from positive to negative sign change as age increased, ranging between 2 D and 2.5 D for subjects aged 20 to 40 years. However, Del Aguila-Carrasco et al.Citation18 report these changes at higher accommodative values, specifically around 4 D of accommodation. This change can be attributed to alterations in the lens surface geometry, particularly the increase in central thickness of the lens, leading to a change in taper and inducing negative spherical aberration.Citation43,Citation46
The increase in the Sw of Zernike coefficients with an increase in accommodative demand is a result of the eye’s dynamic optical system responding to changes in focus at different distances, showing wider scatter of the measurements when accommodation is higher. As the accommodative demand increases, the eye’s efforts to maintain the focus increases at closer distances. This constant adjustment leads to increased variability in the Zernike coefficients because the shape of the eye’s optical system is changing with each accommodative response. Also, each individual’s eye has unique physiological and biological characteristics that contribute to the variability in their wavefront aberrations. When accommodating, these variations can become more pronounced, resulting in a higher within-subject standard deviation. Higher Sw values in the Zernike’s ratio of defocus (as shown in ) can be attributed to the wide spectrum of refractive errors observed among the study subjects, spanning from +2.5 D of hyperopia to −9 D of myopia.
The observed variability in aberrations may result from inherent changes in the optical characteristics of the tested eyes, rather than being solely attributed to the aberrometer. The momentary measurement variations in human eye data could primarily result from the inherent instability of the human eye optics, including factors such as microfluctuations of accommodation, movement of the crystalline lens inside the eye, tear film and fixation errors.Citation47 Additionally, large biological fluctuations in aberration maps over time can prevent the achievement of “perfect vision,” even with precise correction of refractive errors.Citation48 It appears logical that during the initial accommodative measurement, the subject may over-accommodate slightly, while by the third measurement, they tend to accommodate slightly less (accommodative lag) due to fatigue. Therefore, there is a higher correlation between measurements one and two and between measurements two and three than between measurements one and three. However, it is evident that the measurements are repeatable, herein denoting micro changes. As Charman and Heron and Stark and Atchison have previously documented,Citation49,Citation50 disparities exist amongst young participants in the extent of these oscillations, with notable variances observed in relation to target vergence. Moreover, MiegeCitation51 posited that these fluctuations are contingent upon the amplitude of accommodation attained by individual subjects. It is worth noting that these microfluctuations can also be contingent upon pupil characteristics, as observed in studies where pupil noise was observed to be at its zenith when dealing with smaller pupil diameters. It is essential to consider that as the accommodative demand increases, the diminishment in pupil size becomes more pronounced, thereby engendering heightened levels of fluctuations.Citation50,Citation51
In addition, the use of a 0.5 decimal visual acuity stimulus may affect the subjects’ AR, as they do not require such accurate effort to focus on the stimulus, so the response between the three measures may be more variable depending on the accommodative demand. Nevertheless, under conditions imposing an accommodative stimulus of 5 D, an accommodative delay ensues. It is important to note that, notwithstanding this lag, the 0.5 visual acuity test may subjectively appear to be perceived as being in a state of optimal focus.22
The differences between the CV in the lower-order of ocular aberration and between the higher order () of ocular aberrations is because the CV not only reflects the absolute dispersion (standard deviation) of the data but also considers the magnitude of the values (mean). As data in our tables show, any variation in the values will be relatively large compared to the mean, resulting in an extremely high coefficient of variation. On the other hand, if the data have a large mean, the same variation in values will be relatively small compared to the mean, resulting in a low CV. The interpretation of these values should be considered with caution since some Zernike coefficients, most of the third order and in particular C(4,−4) and C(4,−2) () naturally have low values or are close to zero, but they can exhibit considerable variability while accommodation is activated, and focus have to be maintained on a stimulus.Citation52,Citation53
An increase in CR with accommodative demand is observed in all the Zernike coefficients studied, which translates into high repeatability. The high CR for defocus C(2,0) () may be since the three accommodative measurements were performed consecutively, without any rest. So, measures two and three may be affected by the accommodation stimulated in previous measures. However, it is unlikely that fatigue would account for the findings as the accommodative demand was lower than the maximum accommodation expected for the age of the subjects.
The findings regarding the reliability of repeated measurements in our study reveal a noteworthy trend. In general, the measurements demonstrated a robust and consistent correlation, as indicated by an ICC exceeding 0.800 for the majority of the parameters under investigation. This high level of correlation suggests that the measurements were stable and dependable, reflecting a high degree of agreement between repeated measurements on the same subject. However, our study also uncovered some interesting exceptions within the realm of fourth-order Zernike coefficients. Specifically, certain coefficients, including C(4,−4), C(4,−2), C(4,2), and C(4,4), exhibited a lower ICC value, falling below 0.767 for C(4,−4). This departure from the strong correlation observed in other parameters raises several important considerations.
Conclusion
Our results suggest compromised agreement and consistency between repeated measurements at a high level of accommodation, indicating that the measurement method or instrument may produce more unreliable measurements when used to measure high degrees of accommodation, highlighting limitations in its ability to provide accurate repeatability.
One of the key findings in this study is that an increase in the accommodative demand leads to lower repeatability of measurements. Moreover, there is an observed decrease in coefficient of variability as the order of the Zernike coefficients increases.
When investigating changes in aberrations during the accommodation process, relying solely on population-averaged data may lead to inaccurate conclusions due to significant inter-subject variability in aberration patterns. Furthermore, factors such as pupil size and the total amplitude of accommodation can exacerbate these discrepancies. Considering the diverse individual responses in aberration patterns and accounting for variables like pupil size and AA is crucial for obtaining reliable and meaningful results in studies related to accommodation-induced aberrations.
Ethics approval statement
The study was conducted in accordance with the Declaration of Helsinki and approved by the Comité de Ética de la Investigación de la Comunidad de Aragón (CEICA) with reference PI21-074. Written informed consent was obtained from the subject involved in the study.
Disclosure statement
No potential conflict of interest was reported by the author(s).
Data availability statement
The data that support the findings of this study are available from the corresponding author, MMG, upon reasonable request.
Additional information
Funding
References
- Hughes RP, Vincent SJ, Read SA, Collins MJ. Higher order aberrations, refractive error development and myopia control: a review. Clin Exp Optom. 2020;103(1):68–85. doi: 10.1111/cxo.12960.
- Marcos S. Image quality of the human eye. Int Ophthalmol Clin. 2003;43(2):43–62. doi: 10.1097/00004397-200343020-00007.
- Atchison DA. Recent advances in measurement of monochromatic aberrations of human eyes. Clin Exp Optom. 2005;88(1):5–27. doi: 10.1111/j.1444-0938.2005.tb06659.x.
- Manche E, Roe J. Recent advances in wavefront-guided LASIK. Curr Opin Ophthalmol. 2018;29(4):286–291. doi: 10.1097/ICU.0000000000000488.
- Piers PA, Weeber HA, Artal P, Norrby S. Theoretical comparison of aberration-correcting customized and aspheric intraocular lenses. J Refract Surg. 2007;23(4):374–384. doi: 10.3928/1081-597X-20070401-10.
- Moreno-Barriuso E, Lloves JM, Marcos S, Navarro R, Llorente L, Barbero S. Ocular aberrations before and after myopic corneal refractive surgery: LASIK-induced changes measured with laser ray tracing. Invest Ophthalmol Vis Sci. 2001;42(6):1396–1403.
- Marcos S, Martinez-Enriquez E, Vinas M, de Castro A, Dorronsoro C, Bang SP, Yoon G, Artal P. Simulating outcomes of cataract surgery: important advances in ophthalmology. Annu Rev Biomed Eng. 2021;23(1):277–306. doi: 10.1146/annurev-bioeng-082420-035827.
- Hervella L, Villegas EA, Robles C, Artal P. Spherical aberration customization to extend the depth of focus with a clinical adaptive optics visual simulator. J Refract Surg. 2020;36(4):223–229. doi: 10.3928/1081597X-20200212-02.
- Moreno-Barriuso E, Navarro R. Laser ray tracing versus Hartmann-Shack sensor for measuring optical aberrations in the human eye. J Opt Soc Am A Opt Image Sci Vis. 2000;17(6):974–985. doi: 10.1364/josaa.17.000974.
- Marcos S. Aberrometry: basic science and clinical applications. Bull Soc Belge Ophtalmol. 2006;302:197–213.
- López-Gil N, Fernández-Sánchez V, Legras R, Montés-Micó R, Lara F, Nguyen-Khoa JL. Accommodation-related changes in monochromatic aberrations of the human eye as a function of age. Invest Ophthalmol Vis Sci. 2008;49(4):1736–1743. doi: 10.1167/iovs.06-0802.
- Visser N, Berendschot TTJM, Verbakel F, Tan AN, de Brabander J, Nuijts RMMA. Evaluation of the comparability and repeatability of four wavefront aberrometers. Invest Ophthalmol Vis Sci. 2011;52(3):1302–1311. doi: 10.1167/iovs.10-5841.
- Thibos LN. Principles of Hartmann-Shack aberrometry. J Refract Surg. 2000;16(5):S563–S565. doi: 10.3928/1081-597X-20000901-14.
- Atchison DA, Scott DH, Charman WN. Hartmann-Shack technique and refraction across the horizontal visual field. J Opt Soc Am A Opt Image Sci Vis. 2003;20(6):965–973. doi: 10.1364/josaa.20.000965.
- Aldaba M, Vilaseca M, Díaz-Doutón F, Arjona M, Pujol J. Measuring the accommodative response with a double-pass system: comparison with the Hartmann-Shack technique. Vision Res. 2012;62:26–34. doi: 10.1016/j.visres.2012.03.021.
- Montés-Micó R, Alió JL, Muñoz G, Pérez-Santonja JJ, Charman WN. Postblink changes in total and corneal ocular aberrations. Ophthalmology. 2004;111(4):758–767. doi: 10.1016/j.ophtha.2003.06.027.
- Montés-Micó R, Alió JL, Charman WN. Postblink changes in the ocular modulation transfer function measured by a double-pass method. Invest Ophthalmol Vis Sci. 2005;46(12):4468–4473. doi: 10.1167/iovs.05-0609.
- Del Águila-Carrasco AJ, Kruger PB, Lara F, López-Gil N. Aberrations and accommodation. Clin Exp Optom. 2020;103(1):95–103. doi: 10.1111/cxo.12938.
- Li YJ, Choi JA, Kim H, Yu SY, Joo CK. Changes in ocular wavefront aberrations and retinal image quality with objective accommodation. J Cataract Refract Surg. 2011;37(5):835–841. doi: 10.1016/j.jcrs.2010.11.031.
- López-Gil N, Fernández-Sánchez V. The change of spherical aberration during accommodation and its effect on the accommodation response. J Vis. 2010;10(13):12. doi: 10.1167/10.13.12.
- Glasser A. Accommodation: mechanism and measurement. Ophthalmol Clin North Am. 2006;19(1):1–12, v. doi: 10.1016/j.ohc.2005.09.004.
- Kj C. Accommodation, the pupil, and presbyopia. In Benjamin WJ (Ed). Borish’s Clinical Refraction (2nd ed., pp. 93–144). St. Louis: Elsevier; 2006.
- Salmon TO, van de Pol C. Normal-eye Zernike coefficients and root-mean-square wavefront errors. J Cataract Refract Surg. 2006;32(12):2064–2074. doi: 10.1016/j.jcrs.2006.07.022.
- Lakshminarayanan V, Fleck A. Zernike polynomials: a guide. J Mod Opt. 2011;58(7):545–561. doi: 10.1080/09500340.2011.554896.
- Ophthalmic Optics and Instruments - Reporting Aberrations of the Human Eye (ISO 24157:2008).
- Cheng H, Barnett JK, Vilupuru AS, Marsack JD, Kasthurirangan S, Applegate RA, Roorda A. A population study on changes in wave aberrations with accommodation. J Vis. 2004;4(4):272–280. doi: 10.1167/4.4.3.
- He JC, Burns SA, Marcos S. Monochromatic aberrations in the accommodated human eye. Vision Res. 2000;40(1):41–48. doi: 10.1016/s0042-6989(99)00156-x.
- Ninomiya S, Fujikado T, Kuroda T, Maeda N, Tano Y, Oshika T, Hirohara Y, Mihashi T. Changes of ocular aberration with accommodation. Am J Ophthalmol. 2002;134(6):924–926. doi: 10.1016/s0002-9394(02)01856-1.
- Salmon TO, Thibos LN, Bradley A. Comparison of the eye’s wave-front aberration measured psychophysically and with the Shack-Hartmann wave-front sensor. J Opt Soc Am A Opt Image Sci Vis. 1998;15(9):2457–2465. doi: 10.1364/josaa.15.002457.
- Prieto PM, Vargas-Martín F, Goelz S, Artal P. Analysis of the performance of the Hartmann-Shack sensor in the human eye. J Opt Soc Am A Opt Image Sci Vis. 2000;17(8):1388–1398. doi: 10.1364/josaa.17.001388.
- Moreno-Barriuso E, Marcos S, Navarro R, Burns SA. Comparing laser ray tracing, the spatially resolved refractometer, and the Hartmann-Shack sensor to measure the ocular wave aberration. Optom Vis Sci. 2001;78(3):152–156. doi: 10.1097/00006324-200103000-00007.
- Gifford P, Swarbrick HA. Repeatability of internal aberrometry with a new simultaneous capture aberrometer/corneal topographer. Optom Vis Sci. 2012;89(6):929–938. doi: 10.1097/OPX.0b013e31825017c4.
- Miranda MA, O’Donnell C, Radhakrishnan H. Repeatability of corneal and ocular aberration measurements and changes in aberrations over one week. Clin Exp Optom. 2009;92(3):253–266. doi: 10.1111/j.1444-0938.2009.00364.x.
- Hofer H, Chen L, Yoon GY, Singer B, Yamauchi Y, Williams DR. Improvement in retinal image quality with dynamic correction of the eye’s aberrations. Opt Express. 2001;8(11):631–643. doi: 10.1364/oe.8.000631.
- Hofer H, Artal P, Singer B, Aragón JL, Williams DR. Dynamics of the eye’s wave aberration. J Opt Soc Am A Opt Image Sci Vis. 2001;18(3):497–506. doi: 10.1364/josaa.18.000497.
- Van Ginkel R, Mechó M, Cardona G, González-Méijome JM. The effect of accommodation on peripheral refraction under two illumination conditions. Photonics. 2022;9:364. doi: 10.3390/photonics9050364.
- Jinabhai A, O’Donnell C, Radhakrishnan H. A comparison between subjective refraction and aberrometry-derived refraction in keratoconus patients and control subjects. Curr Eye Res. 2010;35(8):703–714. doi: 10.3109/02713681003797921.
- Liang J, Grimm B, Goelz S, Bille JF. Objective measurement of wave aberrations of the human eye with the use of a Hartmann–Shack wave-front sensor. J Opt Soc Am A Opt Image Sci Vis. 1994;11(7):1949–1957. doi: 10.1364/josaa.11.001949.
- Schwiegerling J. Scaling Zernike expansion coefficients to different pupil sizes. J Opt Soc Am A Opt Image Sci Vis. 2002;19(10):1937–1945. doi: 10.1364/josaa.19.001937.
- Efron S, Efron N, Morgan PB. Repeatability and reliability of ocular aberration measurements in contact lens wear. Cont Lens Anterior Eye. 2008;31(2):81–88. doi: 10.1016/j.clae.2007.10.004.
- Method for reporting optical aberrations of eyes. ANSI Z80.28-2004.
- McAlinden C, Khadka J, Pesudovs K. Statistical methods for conducting agreement (comparison of clinical tests) and precision (repeatability or reproducibility) studies in optometry and ophthalmology. Ophthal Physiol Opt. 2011;31(4):330–338. doi: 10.1111/j.1475-1313.2011.00851.x.
- Bland JM, Altman DG. Measurement error. BMJ. 1996;313(7059):744–744. doi: 10.1136/bmj.313.7059.744.
- Chan YH. Biostatistics 104: correlational analysis. Singapore Med J. 2003;44(12):614–619.
- Mirshahi A, Bühren J, Gerhardt D, Kohnen T. In vivo and in vitro repeatability of Hartmann-Shack aberrometry. J Cataract Refract Surg. 2003;29(12):2295–2301. doi: 10.1016/s0886-3350(03)00655-2.
- López-Gil N, Rucker FJ, Stark LR, Badar M, Borgovan T, Burke S, Kruger PB. Effect of third-order aberrations on dynamic accommodation. Vision Res. 2007;47(6):755–765. doi: 10.1016/j.visres.2006.08.010.
- Cheng X, Himebaugh NL, Kollbaum PS, Thibos LN, Bradley A. Validation of a clinical Shack-Hartmann aberrometer. Optom Vis Sci. 2003;80(8):587–595. doi: 10.1097/00006324-200308000-00013.
- Cheng X, Himebaugh NL, Kollbaum PS, Thibos LN, Bradley A. Test-retest reliability of clinical Shack-Hartmann measurements. Invest Ophthalmol Vis Sci. 2004;45(1):351–360. doi: 10.1167/iovs.03-0265.
- Charman WN, Heron G. Fluctuations in accommodation: a review. Ophthalmic Physiol Opt. 1988;8(2):153–164. doi: 10.1111/j.1475-1313.1988.tb01031.x.
- Stark LR, Atchison DA. Pupil size, mean accommodation response and the fluctuations of accommodation. Ophthalmic Physiol Opt. 1997;17(4):316–323. doi: 10.1111/j.1475-1313.1997.tb00063.x.
- Miege C, Denieul P. Mean response and oscillations of accommodation for various stimulus vergences in relation to accommodation feedback control. Ophthalmic Physiol Opt. 1988;8(2):165–171. doi: 10.1111/j.1475-1313.1988.tb01032.x.
- Zar JH. Biostatistical analysis (4th ed.). New Jersey: Prentice-Hall; 1999.
- Montgomery DC, Peck EA, Vining GG. Introduction to Linear Regression Analysis. John Wiley & Sons; 2021.