ABSTRACT
It has been suggested that more globalized cities are more polarized and segregated than other cities. However, this is mainly evidenced by advanced capitalist cities and other selected developed cities, while less developed cities are clearly under-researched. This paper draws on both developed and less developed cities in Guangdong province, and asks how socio-economic segregation levels differ among cities of varying economic development levels. We find that, contrary to expectation, less developed cities are showing higher levels of segregation than well-developed cities. We suggest that the key contributing factor is that the well-developed cities in Guangdong province are characterized by manufacturing-dominant economic structures and industrialization-based economic transformation. Correspondingly, their occupational structures are predominantly characterized by employees with a recent agricultural background; the restructuring process is therefore dominated by professionalization of the lower class. The stronger and faster industrialization and professionalization processes produce lower segregation levels in those more developed cities.
Introduction
It has long been held that the more globalized and economically developed cities are the more polarized and segregated they will be (Friedmann & Wolff, Citation1982; Sassen, Citation2001). In the US, it is shown that the socio-economic segregation level increases with economic development (Monkkonen & Zhang, Citation2014; Reardon & Bischoff, Citation2011). Economic development would lead to higher income inequality, which causes a more differentiated spatial distribution of income groups and shows in higher levels of residential segregation. In China, this trend is tentatively observed in Monkkonen et al. (Citation2017). Segregation levels are somewhat higher in larger and more affluent cities (20 largest cities in China). Most of the knowledge, however, is based on evidence from advanced capitalist cities, or economically well-developed cities in China (see Gu, Citation2001; Li & Wu, Citation2008; Wu et al., Citation2017) while cities in a less mature stage of development are considered as urban “other” and remain out of sight. Although the world city approach has much to offer in seeking to conceptualize generalizable models of urbanity (Amin & Graham, Citation1997; Bell & Jayne, Citation2009), it usually ignores both the variety of spatial patterns and functions as well as the different underlying process and mechanism of small cities (Peck, Citation2015; Robinson, Citation2005, Citation2006, Citation2011). Privileging the experience from a handful of global cities over a large number of other (perhaps also global) cities and smaller cities would miss the more sophisticated and nuanced understanding of the complexity of urban social-spatial structure theories. This may also result in ill-fitting policy interventions, especially in quasi “irrelevant” cities (Robinson, Citation2006). This triggered a plea for considering all cities, economically developed or less developed, as “ordinary” cities (Amin & Graham, Citation1997; Robinson, Citation2006). Understanding other and smaller cities could also have important implications for the development of larger cities. This paper therefore seeks to add to the ongoing debate by looking into the relationship between socio-economic segregation and economic development in a range of cities, including more and less developed Chinese cities. The key question to address is:
How do levels and patterns of socio-economic segregation in Chinese cities differ? How can we understand the variation? What is the role of their level of economic development?
Theories on segregation include dimensions such as social inequality, globalization, migration and ethnicity diversity, economic development, welfare and housing regimes (Madrazo & Van Kempen, Citation2012; Musterd & Ostendorf, Citation1998; Sassen, Citation2001; Wu, Citation2005). We expect that factors like globalization, economic development, and the liberalization of housing markets all become more important over time. However, most of the literature is built on North American and European evidence, where the economic transition is mainly from manufacturing industry to post-industrial service sector industry. China’s experience is more hybrid. Some cities have been undergoing a similar process as those in the western context, while others are transforming from an agriculture-dominant development stage to manufacturing industry. The question then is whether theories developed in the western context also hold for the Chinese context? How exactly will the factors mentioned above, affect different cities and impact on segregation? We seek for theoretical renewal and (re)construction (Peck, Citation2015), by searching for a dialogue between conventional and seemingly universal urban theories and Chinese experiences. Although several high-quality segregation studies have been performed in China (see for example, Madrazo & Van Kempen, Citation2012; Monkkonen et al., Citation2017; Shen, Citation2019), there is reason to continue testing and perhaps reformulating the theory in the Chinese context. Especially the potential impact of the level and type of economic development seems to be under-researched. Guangdong province, one of the well-developed regions in China, comprises cities that find themselves in divergent developmental stages; this offers a good opportunity to examine how economic structure and restructuring, along with processes of industrialization and globalization, is manifested in social-spatial patterns.
Theoretical analysis
In order to perform the comparative study, we “begin with our favorite theory” (Burawoy, Citation2009), but with a presumption of ongoing critical reconstruction (Peck, Citation2015). A theoretical framework incorporating structural, institutional and contextual factors in explaining segregation has long been employed (Burgers & Musterd, Citation2002; Musterd & Ostendorf, Citation1998; Tammaru et al., Citation2016). In this paper, we focus on structural and institutional factors. Taking into account the ongoing dynamic economic restructuring grounded on the present development stage, we believe that three dimensions play a crucial role: First, globalization and economic restructuring, which are the main structural factors that inter-dependently shape the macro social-spatial environment. Secondly, Effects of globalization and economic restructuring depend on the historically grown economic structure cities have developed. Thirdly, the housing regime together with the welfare regime it is embedded in, is one of the main institutional settings enhancing or mitigating segregation. They are assumed to form a relatively comprehensive theoretical framework for decomposing the relationship between segregation and economic development.
Globalization and economic restructuring
Economic restructuring associated with globalization is regarded as the main force in shaping the social structure and spatial inequality (Friedmann & Wolff, Citation1982; Sassen, Citation2001). During postwar globalization, the economic structure of advanced capitalist societies has shifted from a manufacturing industry dominated to a tertiary industry dominated character. This transition is argued to correspond with social structural polarization. It comprises an increase of the professional and managerial employees through proliferation of advanced tertiary industries, an indirect attraction of the low-skilled and low-wage employees in consumer service industries catering to the lifestyle of the highly skilled, as well as a shrinking middle class due to the process of de-industrialization (Sassen, Citation2001). When the upper and lower classes become sorted into different areas, new patterns and higher levels of segregation emerge. However, it is also debated that without a large influx of immigrants, working in low-end service industries, the urban social structure may rather develop along lines of professionalization (Friedmann, Citation1986; Hamnett, Citation1994, Citation1996). In addition, segregation may lag behind economic developments. For instance, the level of segregation in the post-socialist cities in Eastern Europe (initially) remained quite low (Kovacs, Citation2020; Marcińczak et al., Citation2015), even though rapidly developing and globally driven market processes could already be observed soon after 1989. The spatial influence of globalization turned out to be mediated by existing structures and other institutional factors, therefore causing time lags in their effects on segregation.
Economic structure
Economic restructuring entails different social and spatial transformations depending on the stage of economic development. In already highly industrialized cities, economic restructuring entails tertiarization in both high- and low-end service industries, leading to higher income inequality and segregation (Monkkonen & Zhang, Citation2014; Reardon & Bischoff, Citation2011). In contrast, in less industrialized economic entities, economic restructuring rather manifests as a shift from agriculture to manufacturing industry: industrialization (Friedmann & Wolff, Citation1982; Wallerstein, Citation1974). This implies an increase of the aggregate income of the low-income workers relative to the rest (Telles, Citation1995). It may hence reduce income inequality and potential segregation.
In addition, the economic structure also influences rather directly the social and spatial structure. An economic structure dominated by manufacturing industries is characterized by skilled and middle-income employment, and hence a large share of middle class in the social structure (Sassen, Citation2001). It contributes to the stability and equality of the income distribution (Bluestone & Harrison, Citation1988), as well as spatial mix as they integrate well with both upper and lower class. In contrast, urban economies that are dominated by the service sector are deemed to be more polarized (Borel-Saladin & Crankshaw, Citation2009). It attracts both high-skilled and high-income employment in the high-end tertiary industries like finance and ICT, and concomitant low-skilled and low-income jobs in low-end tertiary industries like restaurants and hotels (Burgers & Musterd, Citation2002; Sassen, Citation2001).
Welfare state and housing regime
The welfare regime, especially the housing regime, is considered an important mediating factor in translating the socioeconomic structure and restructuring process into local spatial structures (Burgers, Citation1996; Esping-Andersen, Citation1990; Kemeny, Citation2001; Lennartz, Citation2011; Musterd et al., Citation2017). It has been shown that market-oriented liberal housing regimes generally have higher residential segregation levels, whereas social democratic welfare regimes tend to be associated with lower levels of segregation (Allen, Citation2006; Hoekstra, Citation2003; Kemeny, Citation2001; Musterd, Citation2020; Musterd & Ostendorf, Citation1998; Zhou & Ronald, Citation2017). The housing regime explains to a large degree the relatively higher segregation degree in the US compared with Western Europe (Musterd, Citation2005). It is, however, also observed that ongoing liberalization and financialization of the housing market in Western Europe leads to a greater convergence with US cities (Boterman & Van Gent, Citation2014). The Right to Buy scheme in the UK and the project of replacing social rental with ownership housing in the Netherlands are examples of moving toward a more liberal housing market. Over time the Chinese housing regime has also transformed from a socialist to a more liberal regime (Zhou & Ronald, Citation2017). The national housing provision system has been abolished and a greater role of the market is introduced in the 1990s (Wang & Murie, Citation2000). As a result, the residential landscape is transformed from being occupationally mixed with work units as the main housing provider, to more socioeconomically homogeneous, grounded on market-dominant sorting mechanisms.
In general, we thus take a structuralist view, and establish an explanatory model incorporating globalization, the economic structure as well as the housing regime, which together affect segregation. However, we acknowledge that there are alternative models, such as the ecological model. This argues that processes like industrialization and globalization play out differently in different context (see for example, Farley & Frey, Citation1994). The “ecological contexts” of cities including city population size, housing market and functional specifications have strong implications on the evolution of residential segregation patterns. In addition, the spatial assimilation model emphasizes that decreasing socioeconomic inequalities tends to lead to lower levels of segregation (Lichter et al., Citation2015; Reardon & Bischoff, Citation2011). We argue a structuralist view is complementary to other models. The economic structuring and restructuring processes, as shown above, associate with the function specialization perspective of the ecological model, and also sheds light on the occupation and income structure, which is the core of the spatial assimilation model. The contextualized way of analysis is also incorporated in our study. It examines how globalization, the economic structure and the welfare regime affect cities in Guangdong province differently and lead to differentiated social-spatial patterns.
Before we elaborate the empirical analysis, in the data and methods part, we will first clarify which data we will use, what the crucial methodological issues regarding measuring segregation are, what the specificities of the region we investigate are, and which types of methods of analysis we will apply. The paper ends with conclusions and discussion.
Data and methods
The 21 cities in Guangdong province are the focus of our research. Guangdong province, especially the Pearl River Delta area (PRD) has been among the first areas to be exposed to the global capitalist order in the 1970s based on the Reform and Opening policy, and is currently among the most globalized and affluent parts of China. It offers a good opportunity to explore how globalization and economic development influence segregation in China. By analyzing cities in one province, we can keep the contextual factors constant at the provincial and national level to some extent, and focus on the city-level. There are significant economic differences between cities (appendix 1). This enables us to explore how segregation degrees differ among cities with different economic development levels.
The data employed is from the sixth national census of the cities in 2010. The primary spatial unit of the data is subdistricts (townships), with an average population of around 60,000. It is the smallest spatial unit we could obtain to perform a comparative study among cities within a province in China. We are well aware of the fact that this is a larger spatial unit than normally applied in segregation studies. Nevertheless, it is an acceptable size for our purpose. Not only did other scholars, such as Monkkonen et al. (Citation2017) demonstrate that it is a workable unit size, showing interesting variation when they examined segregation in the 20 largest cities in China based on the fifth census data in 2000 at the same township level. In addition, the spatial logics of the township delineation within cities across Guangdong province, are fairly similar. This still enables the comparison of the segregation patterns. Major infrastructures such as highways and railways, and natural barriers like mountains and rivers are usually deployed to draw the boundaries. We believe the similarities in the spatial logics, to some extent, remedy the problem of the MAUP (Modifiable Areal Unit Problem), an often-mentioned problem when aggregated data with predefined spatial units is used (see for example, Fotheringham & Wong, Citation1991; Openshaw, Citation1984), although it does not solve the problem completely. It is to be expected that segregation degrees and segregation patterns change when the boundaries of the spatial units are systematically drawn in a different way. Nevertheless, research has shown that the change in social-spatial inequality tends to be systematic, rather than stochastic when different spatial units are applied (Musterd, Citation2005). This implies that the comparison between cities is still possible.
The township level also has significant theoretical meaning for segregation research. As the basic political-economic administrative organization in China (Li & Wu, Citation2008), it is not “simply or only” a production of neighborhood dynamics (Lichter et al., Citation2015) or a container of micro-segregation. It independently shapes the social-spatial structure and causes “macro-segregation” (Reardon et al., Citation2008; Shen, Citation2019; Wu & Li, Citation2005). For example, it has its own economic and spatial planning system nested into the higher governmental hierarchy, covering aspects in economic development, land use and public housing. These activities may facilitate the inclusion and exclusion of specific population groups (Lichter et al., Citation2015). Furthermore, although neighborhoods are the direct living environment of the residents, they are also economically and socially networked into their surrounding areas including parks, shops, gyms and streets, which are generally organized based on subdistricts in China (Wu & Li, Citation2005). Thus, the social compositions of townships are also implicative of daily encounters and long-term opportunities of the residents.
Following comparative studies on segregation performed in the US and in European cities, the D index (Dissimilarity) is utilized (Lichter et al., Citation2015; Tammaru et al., Citation2016). Its value ranges from 0 (no segregation) to 1 (complete segregation). We use education level for the socioeconomic status index. Education is related to potential income and housing affordability. It is indicative of people’s capability to segregate themselves from the rest and thus indirectly explains the social-spatial differentiation (Marcińczak et al., Citation2013). We categorize people with a bachelor or higher education level as highly educated, senior high education level as moderately educated, and junior high or lower as lower educated. These three categories will be referred to as high, middle, and low education groups. Since people who had only stayed in the city for less than 6 months before the census was conducted were not included, we believe that the “floating population” is underrepresented. They are considered to be overrepresented in poorly educated groups. The city is defined based on its administrative borders. It covers both urban and rural areas. Thus, we expect that the rural-urban division, which is said to be the main source of inequality, will contribute to a large proportion of the segregation within the cities (Shen, Citation2019).
Here, we employ the robust version of Beta regression to explore the relationship between economic development and segregation. Beta regression is typically utilized when the dependent variable is continuous and restrained to the interval of 0 and 1 (see for example, Ferrari & Cribari-Neto, Citation2004), which is the case in our study.Footnote1 The classical beta regression version, namely the mean model with a logit link function, as well as a constant precision parameter have been used. The robust version makes the standard error and the confidence interval of the coefficients more reliable, when our sample is small. We also tried OLS regression model; the shapes of the plots are quite similar although the specific coefficients are somewhat different. It, to some extent, indicates the robustness of our results. Although simple linear relationships are usually used to explore the relationship between economic development and segregation, as in Monkkonen et al. (Citation2017), we observed “somewhat curvilinear” relationships. After comparison, we found the residuals of quadratic regressions are more evenly distributed along the zero line. The theoretical reasons are two-fold. Firstly, from the perspective of individual cities, economic development in the initial stage may provide increasing opportunities to both rural and urban areas, the differences between which have been the main source of inequality in China and both of which are taken into consideration in our study. It hence potentially results in a decrease before it increases social-spatial inequality. Further development may be siphoned and concentrated in the urban areas, due to the fact that cities are more capable in attracting investments, and have a better infrastructure and economies of scale, etc. The rural-urban gap therefore subsequently increases and so does the overall social-spatial inequality. Secondly, and as a parallel process, economically more developed cities may be less segregated at an initial stage, based on a more balanced rural-urban landscape. Further development, however, may lead to more polarized and segregated rural-urban landscapes compared to the less developed cities. The segregation level thus evolves along with the development stage they are in. Thus, quadratic regression fits this theoretical basis.
Due to the small number of case cities, we perform separate univariate regressions. Both the linear and quadratic term of the independent variable are included into the models. shows that the nonlinear relationship is supported by the descriptive analysis. For example, the highest average segregation degrees occur in the city groups with medium Per Capita GDP and manufacturing industry share.
Table 1. Description of the dependent variable and selected independent variables
The segregation degree between the highly educated and the rest (middle and low) is chosen as dependent variable, because it has positive, relatively stable and strong correlations with the other segregation indexes after examination (appendix 2). We believe that the results based on it could also be applied to other segregation indexes to a large extent. A density plot of the segregation degree between highly educated and other people is shown in appendix 3; it has a nearly normal distribution. The independent variables are all standardized, to ensure comparability of the coefficients of separate regressions as well as reduce the multicollinearity between the linear and quadratic terms. Economic development level is measured by Per Capita GDP, and three economic structure related variables, measured by the proportions of agricultural, manufacturing and tertiary GDP to the total GDP, respectively.
To further explain the relationship between segregation and economic development level, we mainly follow the logic of the polarization and segregation theory proposed by Sassen (Citation2001). We focus on globalization, economic structure and restructuring, and the social structure and restructuring-related factors, but also on the housing regime. Globalization is measured by Per Capita FDI. Economic structure and restructuring process factors concern the shares of agriculture, manufacturing and tertiary industries in 2010, as well as their changes between 2000 and 2010. What requires special attention is the social structure and restructuring process. It is operated as the occupational structure and restructuring process. Only the economically active employees are considered. The census data primarily includes six occupational groups: unit head, technicians, clerk and related workers, unskilled service workers, agriculture-related labor, as well as production and equipment operation related workers in 2000 and 2010. It is categorized principally based on skill specialization level, complexity of the task involved and knowledge required. Two points have to be clarified. First, although skilled manual workers in the manufacturing industries are considered as middle class in advanced capital cities, most of the production-related workers are unskilled or semi-skilled workers in labor-intensive manufacturing industries in China. Their income is 90% of the average income in 2000 in China. It decreased to 80% in 2010 and turns out to be among the lowest paid (appendix 4). Thus, it is reasonable to position them as lower class in China. Secondly, although the non-agriculture urban social structure is the main focus for occupational class analysis (See for example, Baum, Citation1997; Burgers & Musterd, Citation2002), we argue that the agriculture-related employees should be included here. Firstly, in Guangdong province, in 2010, 24.6% of the economically active employment is in agriculture; in less developed cities like Yun Fu it is even 68%. Secondly, during the industrialization and urbanization process, employees in agriculture are moving from rural areas to urban areas into non-agricultural jobs, in manufacturing industries and low-end service sectors. Thus, the occupational change in agriculture, manufacturing and low-end service industries are inter-related. Only when all the occupations, including employment in agriculture are considered, a full investigation of the inter-dependent occupational evolvement is possible. In this paper, the relationships between segregation and the shares of the six occupations will be examined.
In the remainder of the paper, we will empirically examine the segregation patterns of the cities in Guangdong province, followed by the Beta regression analysis between segregation and economic development. When we interpret the results, we present outcomes per city-group, based on our main independent variable level of affluence, measured by their per capita GDP relative to each other. Shenzhen, Guangzhou, Foshan, Zhuhai and Zhongshan are the most affluent cities. Dongguan, Huizhou, Jiangmen, Qingyuan, Zhaoqing and Yangjiang are affluent cities. Maoming, Shaoguan, Shantou, Chaozhou and Zhanjiang are less affluent cities. Jieyang, Yunfu, Heyuan, Shanwei and Meizhou are the least affluent cities. In all the tables and figures presented in this paper, cities are presented from most affluent (Shenzhen) to least affluent (Meizhou).
Empirical analysis
Segregation patterns
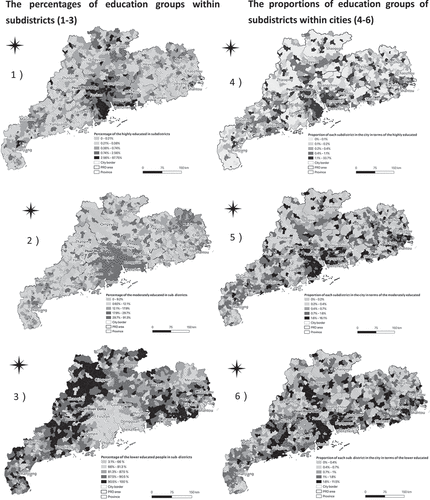
Before presenting segregation patterns of the cities in Guangdong province, we first investigate the socioeconomic composition of the subdistricts in terms of their education level. We divide the subdistricts into 5 groups that contain an equal number of units (). In general, under-educated people are dominant in almost all cities.Footnote2 We find that 80% of the subdistricts is characterized by a population of which less than 2.56% is highly educated (). Also 80% of subdistricts is characterized by a population of which less than 29.7% is moderately educated (). In contrast, 60% of the subdistricts has a population with at least 81.3% lower educated people (). There are clear differences between cities. Cities in the Pearl River Delta area are clusters of subdistricts with relatively high percentages of highly and moderately educated people, while the semi-peripheral and peripheral cities are concentrations of subdistricts dominated by lower educated people (). When we look at the spatial distribution of each education group among subdistricts within each city, their socioeconomic compositions all seem to be heterogeneous (). It suggests an uneven distribution of the education groups. In addition, cities like Dongguan and Foshan in the Pearl River Delta area seem to have relatively more even distributions compared to the rest. This may imply that they have a lower degree of segregation.
Figure 1. The social spatial structures of subdistricts in Guangdong province in terms of educational attainment
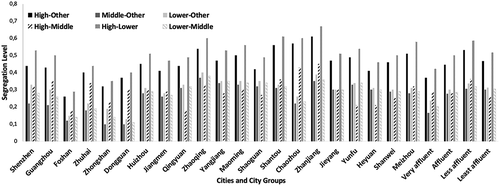
The segregation patterns of the cities echo the socioeconomic composition patterns of the subdistricts (). Segregation between highly and lower educated people is the highest on average, followed by that of the high-middle and low-middle sequentially. However, while the most affluent and least affluent city groups follow that average trend, the high-middle segregation in the affluent and least affluent city groups is lower than the low-middle segregation. In addition, although calculated with a relatively large spatial unit, the segregation degrees are as high as, or even higher than what has been shown in Shanghai in Shen (Citation2019) based on neighborhood spatial units. The segregation degrees of high-low, middle-low and high-middle are 0.51, 0.28 and 0.30 on average among cities in Guangdong province, and 0.41, 0.17 and 0.37 in Shanghai in 2010. This indicates a high segregation level at the subdistrict level.Footnote3 It supports the theory and knowledge that socioeconomic districts of a certain kind often consist of several adjacent neighborhoods, forming certain socioeconomic sectors in cities. Besides, the least segregated cities are predominantly located in the Pearl River Delta area, including Foshan (0.26), Zhongshan (0.32), Dongguan (0.37) and Zhuhai (0.4). In contrast, peripheral or semi-peripheral cities like Zhanjiang (0.61), Chaozhou (0.57), Shantou (0.56) and Meizhou (0.51) are among the relatively less developed but most segregated. It seems to suggest a negative relationship between economic development and segregation.
Figure 2. Segregation degrees of the 21 cities in Guangdong province in 2010
Economic development and segregation
The results of the quadratic Beta regressions between economic development variables and segregation are both reported visually and statistically ( and ). A U-shape relationship could be found here as well (). But most of the cities fall into the left part of the U shape. It indicates a nearly linear and negative relationship between economic development level and the level of segregation. One standard deviation change in economic development, namely 26,081 yuan, decreases the segregation degree by 0.085 on average, based on the average marginal effect (). The diminishing effect is stronger for less developed cities (). It contradicts the positive relationship between segregation and economic development found both in the US (Monkkonen & Zhang, Citation2014; Reardon & Bischoff, Citation2011) and in China (Monkkonen et al., Citation2017). The tipping point is significant and is when Per Capita GDP is 71,194 Yuan, 1.28 standard deviation from the mean Per capita GDP of the 21 cities. Only Zhuhai, Foshan, Guangzhou and Shenzhen passed the tipping point in 2010. It indicates that these cities may develop into a more segregated landscape along with further economic development.
Table 2. Results of separate quadratic Beta regression
Figure 3. Quadratic Beta regressions between segregation and economic development variables
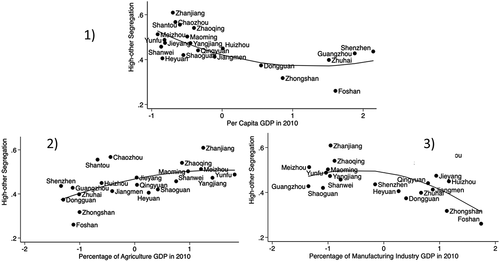
Although urban economies dominated by service sectors show to be more segregated in advanced capitalist cities (Borel-Saladin & Crankshaw, Citation2009), we find that the share of the tertiary industry is not significantly related to the segregation degree (not shown since it is not significant), while cities with a higher share of the agriculture industry are significantly more segregated in China (). On average, a unit of change in the share of agriculture industry, namely 7,93%, associates with on average an increase in segregation degree by 0.049 (). The share of agricultural industry is the only economic development-related factor that is positively related to segregation. In addition, a larger share of the manufacturing industry is nearly linearly and significantly negatively related to segregation (). The industrialization process tends to reduce segregation degrees.
Decomposing the relationship between economic development and segregation
Socioeconomic structure and restructuring
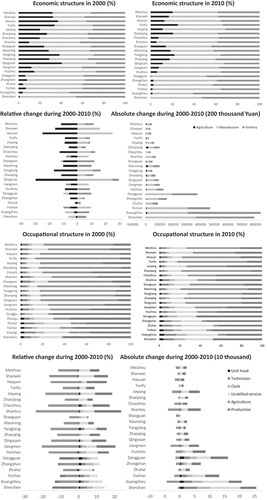
Guangdong province is among the first areas in China to open to the world, and is among the most globalized in China. Globalization, is (one of) the most important driving forces of its economic development. Actually, globalization, measured by Per Capita FDI, is highly correlated with economic development, measured by Per Capita GDP, with a coefficient of 0.8. Its relationship with segregation is similar to that of the economic development level. Initial globalization at first leads to de-segregation; after reaching 507 Dollar per person, further globalization may increase segregation, based on our model ( and ). Globalization indeed leads to economic restructuring, but through varying paths and magnitudes among cities. More developed and affluent cities, which are generally the more globalized, have undergone de-industrialization and high-end tertiarization, while less developed and less affluent cities experienced industrialization and low-end tertiarization during 2000 and 2010 (; appendix 5).
Figure 4. Quadratic Beta regressions between segregation and globalization (1), social structure (2–5) and housing regime (6) related factors
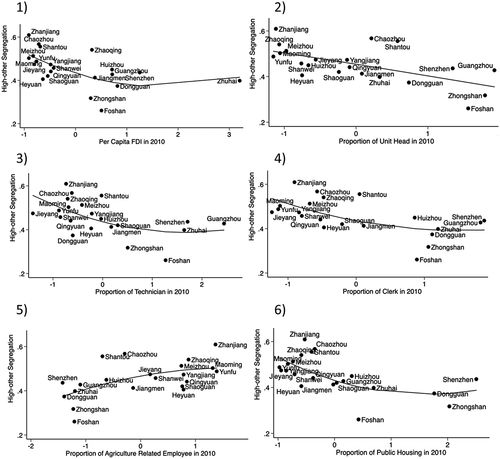
Figure 5. Economic and occupational structure and restructuring processes by city groups
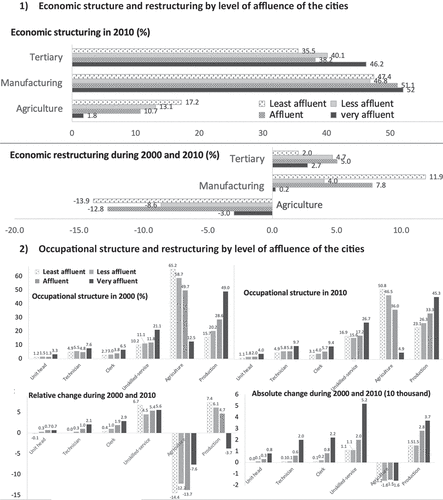
However, there are two aspects worth noticing that distinguish cities in Guangdong province from the advanced capitalist cities like London and Greater Amsterdam and other developed Chinese cities as Beijing and Shanghai. To begin with, due to their semi-peripheral or peripheral locations in the world city system, globalization is mainly epitomized by manufacturing. Cities in general have a dominant share of the manufacturing industry in their economic structures including those undergoing de-industrialization (; appendix 5). They actually have a larger share in manufacturing industries compared to less developed cities. De-industrialization in more developed cities is only concealing the relatively faster growth of the tertiary sector. It masks the fact that the absolute value of the manufacturing industry is still increasing. Although manufacturing industries are “supposed” to be transferred to less developed cities based on governmental industrial relocation policies, most investment remains directed toward more developed cities due to path dependence (World Bank, Citation2011). Instead, professionalization and re-industrialization in capital-intensive and high-tech manufacturing industries such as ICT and advanced equipment manufacturing industries are developing in more developed cities like Guangzhou and Shenzhen. Besides, the increase in the share of the tertiary industry comes at the cost of the agriculture industry, while that of the manufacturing industry remains high and dominant.
This is in contrast with the economic restructuring process in advanced capitalist cities, which is dominated by tertiarization at the cost of manufacturing industries. These characteristics of the economic structure and restructuring are manifest in the occupational structure and restructuring. A higher share of production-related workers and unskilled service employees, as well as a much smaller share of agriculture-related workers can be found in more developed cities (; appendix 5). It corresponds with a higher share of manufacturing and tertiary industries and a smaller share of agricultural industry in more developed cities. This suggests a more professional and also economically less marginalized lower class. Therefore, we expect the income inequality in more affluent cities to be lower. This seems to contradict the common idea that more developed cities generally tend to be more unequal (Sassen, Citation2001). We argue this conclusion is mainly based on occasions where the income inequality between employees in agriculture and non-agriculture is relatively low as in most advanced capitalist cities, or when only the non-agricultural occupational structure is included for inequality observation as in many cases in China based on the rural-urban division. In situations where agricultural occupations are largely discriminated in terms of income compared to non-agricultural employment, it is plausible to postulate lower income inequality when a smaller share of agricultural employment and more professional lower class are observed.
When we look at the occupational change during 2000 and 2010 (; appendix 5), we find that an increase of the professionalized lower class in more affluent cities may have been achieved through a process of incorporating agricultural employees in manufacturing and low-end service industries. Actually, agricultural employees are the only occupational group which decreases in absolute numbers, while all other occupational groups increase in all cities. The share of agricultural employment is positively related to segregation (). This indicates that during the industrialization and tertiarization process, the main process of social structural transformation is the professionalization of the lower class (many of whom having an agricultural background); this helps with de-segregation. Actually, a higher share and a stronger increase of skilled service workers, such as clerks and related workers, as well as managers and professionals, are also observed during the high-end tertiarization process in more affluent cities like Guangzhou (; appendix 5). Although their increase may contribute to rising income inequality, we assume that the relocation of employees from agriculture to manufacturing and low-end service industries is the dominant force affecting the income distribution as they represent the highest share of employment () but earn the lowest (appendix 4).
The geography of the economic and social structure and restructuring contributes to the negative relationship between economic development and segregation. Rural-based industrialization and in-situ urbanization lead to a more even socioeconomic landscape in more affluent cities in the context of globalization and decentralization. Manufacturing-based globalization leads to preferences of capital to move to the suburbs or even rural areas in search of inexpensive labor and land. In addition to that, the decentralized instead of centralized distributional decision-making and fiscal budget system since the reform and opening in 1978, result in a situation where the township becomes the nexus of commercialized and diversified economic activity. Under such conditions, both rural and urban townships are fully stimulated to compete for industrialization opportunities in order to achieve higher economic revenues and benefits. Rural industrialization outside and between major metropolitan centers hence takes a leading role, along with tertiarization of the city center. A dual-track pattern of urbanization (Lin, Citation2001) also takes shape. It consists of a rural-based compact urbanization from the grassroots of the countryside (Ginsburg, Citation1991; McGee, Citation1989) with people who “leave the soil but not the village” (li tu bu li xiang) and “enter the factory but not the city” (jin chang bu jin cheng), as well as a city-based urbanization with the flocking-in of temporary in-migrants for tertiary employment opportunities (Yang, Citation2004). Under strong influence of global capitalism and being exposed to more opportunities, a more even economic and social landscape among the townships emerges. In contrast, the less affluent cities are only included in the competition pool since the beginning of the 21st century based on governmental regional balance projects. Only a small subset of cities benefited from the spilling over from more affluent cities. They are more impacted by the “spontaneously” relocated industrial parks in the suburban and rural areas, contributing to a more fragmented spatial landscape.
Public housing regime
The housing regime is another important dimension potentially resulting in de-segregation. Most of the sample cities fall into the left part of the U-shape; It indicates that the share of public housing is significantly negatively related to segregation (); one standard deviation change, namely 3.6% in the proportion of public housing is associated with a decrease in segregation degree by 0.077 on average, only second to per capita GDP (). First of all, the housing market is more public in more affluent cities. Due to fiscal decentralization, cities have to make a budget for public housing construction. The more economically developed cities tend to have a higher budget, which allows for a more public housing regime. The average shares of public housing amount to 8.38, 4.60, 3.08 and 1.82% from the most to the least affluent city groups in 2010. In addition, how the public housing regime helps mitigate spatial inequality is also related to the industrialization and urbanization process. The housing regime is rural-urban divided, and public housing is not available to rural people. Instead, it has the largest coverage in more affluent cities, with more employment in non-agricultural jobs and in-migrants settling down. Hence, there it has a stronger influence on de-segregation.
Conclusion and discussion
It has long been held that the more globalized and economically developed cities would be more polarized and segregated (see for example, Friedmann & Wolff, Citation1982; Sassen, Citation2001). However, this is mainly established on evidence from advanced capitalist cities or the most developed cities in China. This paper has taken both developed and less developed Chinese cities into consideration (but not the absolute top such as Beijing and Shanghai), and asked how segregation differs in relation to the level of economic development. A negative relationship between segregation and economic development has been found. This contradicts the positive relationship between segregation and economic development found both in the US (Monkkonen & Zhang, Citation2014; Reardon & Bischoff, Citation2011) and in China (Monkkonen et al., Citation2017). The underlying key factor in contributing to the different outcomes in China is the under-industrialized economic development stage. More affluent cities like Shenzhen and Guangzhou in Guangdong province in general have a dominant and higher share of manufacturing industry than the less affluent cities; in addition to that, the economic restructuring process prompted by globalization predominantly regards industrialization, although tertiarization also emerges. Accordingly, unlike the middle-class based occupational structure in highly industrialized western cities, agriculture-related employees dominate the occupational structure of many Chinese cities. The corresponding transformation of the social structure is mainly about the emancipation and professionalization of the lower (land worker) class and incorporating them into the manufacturing and low-end service industries. The more developed cities tend to observe a stronger professionalization process, and are therefore in a better position to enable income increases of the lower class. Consequently, a relatively lower income inequality characterizes the more affluent cities, which is also reflected in more even geographical patterns of social structures. A more public housing regime in more developed cities also facilitates a lower level of segregation.
What also stands out is the occupational structure and the restructuring process. While in the international literature the analysis of the employment structure focuses on urban employment along the line of either Fordist or post-Fordist economic activities (Burgers & Musterd, Citation2002), or being in or out of employment (Baum, Citation1997; Burgers, Citation1996), the agricultural and non-agricultural employment division seems to be the key in understanding the social-spatial structure in Chinese cities. China still has a large pool of rural population and a dual-economy between the urban and rural areas in the first decade of the 21st century. The rural-urban division is still the main source of inequality (World Bank, Citation2011). It might remain so until China passes the Lewies turning point, when the dual economy disappears and labor shortage creates a more competitive labor-demanding market and relatively equal wages of the migrants relative to the urban local people (Bloom & Williamson, Citation1998; Williamson, Citation1998). It is not until then that an occupational class analysis focused on urban employment might depict a relatively comprehensive and representative social structure picture in China. At present, agricultural and non-agricultural employment should be considered simultaneously in social structural analysis. In addition, based on the finding that a lower share of agricultural employment tends to relate to a lower segregation level, we assume that, especially in the short run, further urbanization will support a continuation of the desegregation process. Actually, when we perform Beta regression between the urbanization rate and the degree of segregation, we see a negative relation. Urbanization also explains a substantial share of the variance of segregation. Of course, we acknowledge that this is only an outcome of univariate analysis. More structural analysis is required for further understanding.
The global city thesis (Sassen, Citation2001) states that more globalized cities tend to be more socially polarized and segregated. This thesis appears to be challenged by our study’s finding that there is a negative relation between the globalization level and segregation degree. However, we do not arrive at that conclusion. Rather we interpret our findings that cities in this study find themselves in a different stage of the globalization trajectories: the typical global city thesis is predominantly developed with reference to cities that find themselves in “mature” globalization stages in post-industrial economies. These cities are dominated by advanced business services industries, where highly skilled professional and managerial employees contrast socially and spatially with low-skilled and low-wage employees in consumer service industries; the cities of this study also have attained a position in global networks, but this position is mainly based on (labor intensive) manufacturing industry production, which is characterized by economic gains that are more evenly distributed and in which former agricultural workers now earn higher incomes in manufacturing industry. Therefore, social and spatial contrasts are less striking in general. These outcomes well fit the findings of Burgers and Musterd (Citation2002). They observed that the city of Rotterdam, which still has important manufacturing and port-related industries (like advanced cities in Guangdong province) appeared to be less occupationally polarized and segregated, compared to the advanced services industry-dominated city of Amsterdam. Amsterdam has a more mature position in terms of global connectedness than Rotterdam and different economic profiles. Recently, the Globalization and World Cities Research Network (GAWC Citationn.d. https://www.lboro.ac.uk/gawc/world2018t.html) confirmed the global positions of Amsterdam and Rotterdam. In their authoritative classification they rank cities from Alpha++ (London, New York, the absolute top), Alpha+, Alpha, Alpha-, Beta+, Beta, Beta- to Gamma+, Gamma, Gamma-). Rotterdam received a Gamma+ score; Amsterdam an Alpha-. Amsterdam is more polarized and segregated than Rotterdam. We thus hypothesize that the global city thesis still holds for cities which find themselves at the top globalization level and are dominated by advanced business services. They tend to be unequal. Many other well-connected (also global) cities, however, have other economic histories and profiles. They tend to be less unequal. Our findings in Guangdong province therefore do not rebut the global city thesis, but are complementary, by making more nuanced observations of cities that have taken different trajectories in the globalization process. Together, they tell a contingent story in terms of how globalization process associates with the social and spatial structure and restructuring process (also see Hamnett, Citation2020).
Decentralization of decision-making and financial revenues is one of the main mechanisms in reshaping the social and spatial structure in urbanizing China. While we celebrate that it leads to a more even socioeconomic landscape among townships, and a more public housing regime in more affluent cities, we should also warn that less developed cities are becoming seriously segregated due to the lack of both economic opportunities and welfare transfer. Besides the housing regime shown above, economically more developed cities also have more opportunities in establishing equal access in fields such as education and health, and spread the economic benefits to all people under a decentralized and liberalized welfare regime. In contrast, less affluent cities might fall into stagnation. Perhaps a subtle balance should be established between liberalization and governmental intervention.
As far as we know, this is the first paper to perform a relatively systematic comparative analysis among cities with a large variance in terms of economic development. Through the cross-case comparative conceptualization, abstraction and theorization (Robinson, Citation2011, Citation2005), we seek no exception or contrast (either between global North and South, or between the economically developed and less developed); instead, we tempted to bridge relational dialogue (Mignolo & Felksi & Friedman, Citation2013, p.113; Robinson, Citation2006; Vainer & Parnell & Oldfield, Citation2014, p. 54), with conventional globalization, industrialization, urbanism and segregation theories, and at last the possibility of theoretical renewal and (re)construction (Peck, Citation2015). Outcomes may differ if only fairly globalized and economically developed cities are the focus of research, as indicated by the different result shown by Monkkonen et al. (Citation2017), based on the 20 largest cities in China in 2000. We would like to argue that the findings presented in our paper are more representative of urban China, as China is not only about global cities as Beijing and Shanghai, but also a much larger number of less globalized and developed cities. We did notice that the sizes of the township are relatively bigger in Guangdong province than elsewhere. This is not necessarily a problem for comparing cities within Guangdong. However, when a different spatial logic of township delineation would have been applied in other areas in China, this might cause problems for wider comparisons between provinces. Guangdong province, as (one of) the most globalized regions in China, might still be a specific case; globalization and industrialization seem to play out differently in other regions in China (Farley & Frey, Citation1994). We therefore should be cautious in generalizing our conclusion to other provinces in China. In addition, we only investigated the 21 cities in Guangdong province. Further studies taking more observations into consideration may help to provide further understanding. Although it is shown that the occupational structures tend to be less polarized in more affluent cities compared to less affluent cities, and professionalization instead of polarization seems to be the leading process in shaping the occupational structure in the period 2000–2010, we expect that a more polarized structure and polarization process will develop in the future, resulting in higher levels of segregation. Our models have also shown that cities like Shenzhen and Guangzhou have already reached the right part of the U-shape in terms of economic development and FDI (). In more affluent cities like those in the Pearl River Delta area, de-industrialization has started to emerge. A large number of labor-intensive industries have been moving away; high-tech and knowledge-intensive industries come in place. This may have significant impact on the social structure of cities. Future research in Guangdong province will learn how exactly this will develop.
Disclosure statement
No potential conflict of interest was reported by the authors.
Notes
1. Although 0 and 1 is theoretically possible, it is rarely observed in reality; the segregation levels of our sample cities in Guangdong province range from 0.26 and 0.61.
2. In Guangdong province as a whole, 72.2% of the people have a junior high or low education level; only 3.9% reaches a bachelor or higher education level.
3. Here, we were also able to calculate the segregation degrees at the neighborhood level in Dongguan. We found in general a relatively higher degree in almost all the education segregation indexes at the neighborhood level, compared with the subdistrict level, except for middle-upper segregation (0.18 and 0.30 at the neighborhood and subdistrict level respectively) and upper-low class (0.37 and 0.40 at the neighborhood and subdistrict level respectively). The paired segregation numbers for low-middle being 0.38 and 0.11, upper-other being 0.46 and 0.37, middle-other being 0.16 and 0.10, low-other being 0.20 and 0.
References
- Allen, J. (2006). Welfare regimes, welfare systems and housing in southern Europe. European Journal of Housing Policy, 6(3), 251–277. https://doi.org/10.1080/14616710600973102
- Amin, A., & Graham, S. (1997). The ordinary city. Transactions of the Institute of British Geographers, 22(4), 411–429. https://doi.org/10.1111/j.0020-2754.1997.00411.x
- Baum, S. (1997). Sydney, Australia: A Global City? Testing the Social Polarisation Thesis. Urban Studies, 34(11), 1881–1902. https://doi.org/10.1080/0042098975295
- Bell, D., & Jayne, M. (2009). Small cities? Towards a research agenda. International Journal of Urban and Regional Research, 33(3), 683–699. https://doi.org/10.1111/j.1468-2427.2009.00886.x
- Bloom, D. E., & Williamson, J. G. (1998). Demographic transitions and economic miracles in emerging Asia. World Bank Economic Review, 12(3), 419–455. https://doi.org/10.1093/wber/12.3.419
- Bluestone, B., & Harrison, B. (1988). The growth of low-wage employment: 1963-86. The American Economic Review, 78(2), 124–128. http://www.jstor.org/stable/1818109
- Borel-Saladin, J., & Crankshaw, O. (2009). Social polarisation or professionalisation? Another look at theory and evidence on deindustrialisation and the rise of the service sector. Urban Studies, 46(3), 645–664. https://doi.org/10.1177/0042098008100999
- Boterman, W. R., & Van Gent, W. P. C. (2014). Housing liberalisation and gentrification: The social effects of tenure conversions in Amsterdam. Tijdschrift Voor Economische En Sociale Geografie, 105(2), 140–160. https://doi.org/10.1111/tesg.12050
- Burawoy, M. (2009). The Extended case method. University of California Press.
- Burgers, J. (1996). No polarisation in Dutch cities? Inequality in a corporatist country. Urban Studies, 33(1), 99–105. https://doi.org/10.1080/00420989650012149
- Burgers, J., & Musterd, S. (2002). Understanding urban inequality: A model based on existing theories and an empirical illustration. International Journal of Urban and Regional Research, 26(2), 403–413. https://doi.org/10.1111/1468-2427.00387
- Esping-Andersen, G. (1990). Three worlds of welfare capitalism. Princeton: Princeton University Press.
- Farley, R., & Frey, W. H. (1994). Changes in the segregation of Whites from Blacks During the 1980s : Small steps toward a more integrated society American Sociological Association, 59(1), 23–45. https://doi.org/10.2307/2096131
- Ferrari, S. L. P., & Cribari-Neto, F. (2004). Beta regression for modelling rates and proportions. Journal of Applied Statistics, 31(7), 799–815. https://doi.org/10.1080/0266476042000214501
- Fotheringham, A. S., & Wong, D. W. S. (1991). The modifiable areal unit problem in multivariate statistical analysis. Environment & Planning A, 23(7), 1025–1044. https://doi.org/10.1068/a231025
- Friedmann, J. (1986). The world city hypothesis. Development and Change, 17(1), 69–83. https://doi.org/10.1111/j.1467-7660.1986.tb00231.x
- Friedmann, J., & Wolff, G. (1982). World city formation: An agenda for research and action. International Journal of Urban and Regional Research, 6(3), 309–344. https://doi.org/10.1111/j.1468-2427.1982.tb00384.x
- Ginsburg, N. (1991). The extended metropolis: Settlement transition in Asia. University of Hawaii Press.
- Globalization and World Cities Research Network. (n.d.).The World According to GaWC2020. https://www.lboro.ac.uk/gawc/world2020t.html
- Gu, C. (2001). Social polarization and segregation in Beijing. Chinese Geographical Science, 11(1), 17–26. https://doi.org/10.1007/s11769-001-0003-7
- Hamnett, C. (1996). Social polarisation, economic restructuring and welfare state regimes. Urban Studies, 33(8), 1407–1430. https://doi.org/10.1080/0042098966727
- Hamnett, C. (2020). The changing social structure of global cities: Professionalisation, proletarianisation or polarisation. Urban Studies, 004209802094055. (December 2019). https://doi.org/10.1177/0042098020940556
- Hamnett, C. (1994). Social polarisation in global cities: theory and evidence. Urban studies, 31(3), 401–424. https://doi.org/10.1080/00420989420080401
- Hoekstra, J. (2003). Housing and the welfare state in the Netherlands: An application of Esping-Andersen’s typology. Housing, Theory and Society, 20(2), 58–71. https://doi.org/10.1080/14036090310000634
- Kemeny, J. (2001). Comparative housing and welfare: Theorising the relationship. Journal of Housing and the Built Environment, 16(1), 53–70. https://doi.org/10.1023/A:1011526416064
- Kovacs. (2020). Do market forces reduce segregation? The controversies of post-socialist urban regions of Central and Eastern Europe. In S. Musterd (Ed.), Handbook on urban segregation (pp. 116–133). Edward Elgar.
- Lennartz, C. (2011). Power structures and privatization across integrated rental markets: Exploring the cleavage between typologies of welfare regimes and housing systems. Housing, Theory and Society, 28(4), 342–359. https://doi.org/10.1080/14036096.2011.562626
- Li, Z., & Wu, F. (2008). Tenure-based residential segregation in post-reform Chinese cities: A case study of Shanghai. Transactions of the Institute of British Geographers, 33(3), 404–419. https://doi.org/10.1111/j.1475-5661.2008.00304.x
- Lichter, D. T., Parisi, D., & Taquino, M. C. (2015). Toward a new macro-segregation? Decomposing segregation within and between metropolitan cities and suburbs. American Sociological Review, 80(4), 843–873. https://doi.org/10.1177/0003122415588558
- Lin, G. C. S. (2001). Metropolitan development in a transitional socialist economy: Spatial restructuring in the Pearl River Delta, China. Urban Studies, 38(3), 383–406. https://doi.org/10.1080/00420980120027429
- Madrazo, B., & Van Kempen, R. (2012). Explaining divided cities in China. Geoforum, 43(1), 158–168. https://doi.org/10.1016/j.geoforum.2011.07.004
- Marcińczak, S., Gentile, M., & Stȩpniak, M. (2013). Paradoxes of (post)socialist segregation: Metropolitan sociospatial divisions under socialism and after in Poland. Urban Geography, 34(3), 327–352. https://doi.org/10.1080/02723638.2013.778667
- Marcińczak, S., Tammaru, T., Novák, J., Gentile, M., Kovács, Z., Temelová, J., … Szabó, B. (2015). Patterns of socioeconomic segregation in the capital cities of fast-track reforming postsocialist countries. Annals of the Association of American Geographers, 105(1), 183–202. https://doi.org/10.1080/00045608.2014.968977
- McGee, T. G. (1989). Urbanisasi or kotadesasi? Evolving patterns of urbanization in Asia. Urbanization in Asia.
- Mignolo, W. D. (2013). On comparison: Who is comparing what and why? In Felksi & Friedman (Ed.), Comparison (pp. 99–119). Johns Hopkins University Press.
- Monkkonen, P., Comandon, A., & Zhu, J. (2017). Economic segregation in transition China: Evidence from the 20 largest cities. Urban Geography, 38(7), 1039–1061. https://doi.org/10.1080/02723638.2016.1195992
- Monkkonen, P., & Zhang, X. (2014). Innovative measurement of spatial segregation: Comparative evidence from Hong Kong and San Francisco. Regional Science and Urban Economics, 47(1), 99–111. https://doi.org/10.1016/j.regsciurbeco.2013.09.016
- Musterd, S. (2005). Social and ethnic segregation in Europe: Levels, causes, and effects. Journal of Urban Affairs, 27(3), 331–348. https://doi.org/10.1111/j.0735-2166.2005.00239.x
- Musterd, S. (2020). Urban segregation: Contexts, domains, dimensions and approaches. In S. Musterd (Ed.), Handbook on urban segregation (pp. 2–17). Edward Elgar.
- Musterd, S., Marcińczak, S., Van Ham, M., & Tammaru, T. (2017). Socioeconomic segregation in European capital cities. Increasing separation between poor and rich. Urban Geography, 38(7), 1062–1083. https://doi.org/10.1080/02723638.2016.1228371
- Musterd, S., & Ostendorf, W. (Eds.). (1998). Urban segregation and the welfare state. Routledge.
- Openshaw, S. (1984). Ecological fallacies and the analysis of areal census data (UK, Italy). Environment & Planning A, 16(1), 17–31. https://doi.org/10.1068/a160017
- Peck, J. (2015). Cities beyond Compare? Regional Studies, 49(1), 160–182. https://doi.org/10.1080/00343404.2014.980801
- Reardon, S. F., & Bischoff, K. (2011). Income inequality and income segregation. American Journal of Sociology, 116(4), 1092–1153. https://doi.org/10.1086/657114
- Reardon, S. F., Matthews, S., O’Sullivan, D., Lee, B. A., Firebaugh, G., Farrell, C. R., & Bischoff, K. (2008). The geographic scale of metropolitan racial segregation. Demography, 45(3), 489–514. https://doi.org/10.1353/dem.0.0019
- Robinson, J. (2005). Urban geography: world cities, or a world of cities. Progress in Human Geography,29(6), 757–765. https://doi.org/10.1191/0309132505ph582pr
- Robinson, J. (2006). Ordinary cities. Routledge.
- Robinson, J. (2011). Cities in a world of cities: The comparative gesture. International Journal of Urban and Regional Research, 35(1), 1–23. https://doi.org/10.1111/j.1468-2427.2010.00982.x
- Sassen, S. (2001). The global city : New York. In Princeton paperbacks.
- Shen, J., & Xiao, Y. (2020). Emerging divided cities in China: Socioeconomic segregation in Shanghai, 2000–2010. Urban Studies, 57(6), 1338–1356. https://doi.org/10.1177/0042098019834233
- Tammaru, T., Musterd, S., Van Ham, M., & Marcińczak, S. (2016). A multi-factor approach to understanding socio-economic segregation in European capital cities. In Socio-Economic Segregation in European Capital Cities – East Meets West, (683680), 1–29. https://doi.org/10.4324/9781315758879
- Telles, E. E. (1995). Structural sources of socioeconomic segregation in Brazilian metropolitan areas. American Journal of Sociology, 100(5), 1199–1223. https://doi.org/10.1086/230636
- Vainer, C. (2014). Disseminating ‘best practice’? The coloniality of urban knowledge and city models. In Parnell & Oldfield (Ed.), The Routledge handbook on cities of the global south (pp. 48–56). Routledge.
- Wallerstein, I. (1974). The modem world system. Academic Press.
- Wang, Y. P., & Murie, A. (2000). Social and spatial implications of housing reform in China. International Journal of Urban and Regional Research, 24(2), 397–417. https://doi.org/10.1111/1468-2427.00254
- Williamson, J. G. (1998). Growth, distribution, and demography: Some lessons from history. Explorations in Economic History, 35(3), 241–271. https://doi.org/10.1006/exeh.1998.0701
- World Bank. (2011). Reducing inequality for shared growth in China: strategy and policy options for Guangdong province.The World Bank.
- Wu, F., & Li, Z. (2005). Sociospatial differentiation: Processes and spaces in subdistricts of Shanghai. Urban Geography, 26(2), 137–166. https://doi.org/10.2747/0272-3638.26.2.137
- Wu, F. L. (2005). Sociospatial differentiation: Processes and spaces in subdistricts of Shanghai. Urban Geography, 26(2), 137–166. https://doi.org/10.2747/0272-3638.26.2.137
- Wu, Q., Cheng, J., & Young, C. (2017). Social differentiation and spatial mixture in a transitional city - Kunming in southwest China. Habitat International, 64, 11–21. https://doi.org/10.1016/j.habitatint.2017.03.019
- Yang, F. F. (2004). Services and metropolitan development in China: The case of Guangzhou. Progress in Planning, 61(3), 181–209. https://doi.org/10.1016/j.progress.2003.10.003
- Zhou, J., & Ronald, R. (2017). Housing and welfare regimes: Examining the changing role of public housing in China. Housing, Theory and Society, 34(3), 253–276. https://doi.org/10.1080/14036096.2016.1223165
AppendicesAppendix 1.
Socioeconomic variables of the 21 cities in Guangdong Province in 2010
Appendix 2.
Correlation matrix among 6 segregation indexes
Appendix 3.
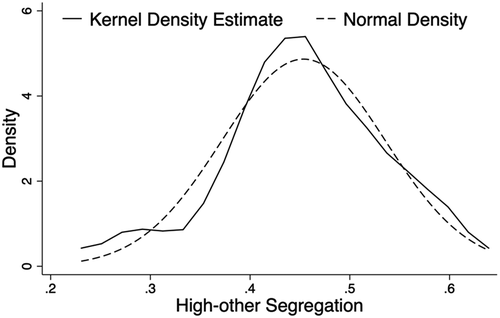
The density plot of segregation degree between highly educated and other people
Note: A kernel density plot of the dependent variable is shown as above; Statistically, the mean of the high-other segregation degree between the highly educated and other people is 0.45, medium being 0.45 (the mean equals to the medium value in a normal distribution), skewness −0.302 (usually the absolute value less than −0.5 indicates approximate symmetry) and Kurtosis 3.16 (the Kurtosis is 3 for a normal distribution). We can in general conclude that the dependent variable is normally distributed
Appendix 4.
The annual income level of industrial sectors in Guangdong
Appendix 5.
Economic and social structure and restructuring process during 2000 and 2010 by city