
 ?Mathematical formulae have been encoded as MathML and are displayed in this HTML version using MathJax in order to improve their display. Uncheck the box to turn MathJax off. This feature requires Javascript. Click on a formula to zoom.
ABSTRACT
The purpose of this study is to compare socioeconomic segregation patterns and levels in Brussels, Copenhagen, Amsterdam, Oslo, and Stockholm with uniform measurements. Previous research has been hampered by conceptual and methodological shortcomings. We use harmonized datasets containing geocoded indicators based on a nearest-neighbors approach. Our analyses offer an unprecedented comparison of patterns and levels of socio-spatial inequalities in European capitals at multiple scales. Using maps, segregation indices and percentile plots, we find that for all cities, the segregation of the rich is much stronger than the segregation of the poor. Macro-scale poverty segregation is most prominent in Stockholm and Brussels, and quite low in Amsterdam, while macro-scale affluence segregation is most pronounced in Oslo. At micro-scales, Brussels and Stockholm stand out with very high local poverty concentrations, indicating high levels of polarization. We interpret differences in the light of spatial inequalities, welfare regimes, housing systems, migration and area-based interventions.
Introduction
Socio-economic segregation is a long-lasting phenomenon in European cities (Cassiers & Kesteloot, Citation2012; Musterd, Citation2005; Tammaru et al., Citation2015) and a subject of concern in urban policy (Bolt, Citation2009; Galster, Citation2007; Kleinhans, Citation2004). An extensive literature has shown that the concentration of deprived populations in specific neighborhoods can represent a threat to social cohesion (Cassiers & Kesteloot, Citation2012), hindering citizen participation (Kühn, Citation2015), access to the labor market (Andersson, Citation2004; Dujardin et al., Citation2008), educational attainment (Eva K. Andersson & Malmberg, Citation2015) and even lead to urban unrest and riots (Malmberg et al., Citation2013; Olzak et al., Citation1996). There is, thus, a need both for measuring the extent of socio-economic segregation and for understanding the processes that shape segregation patterns, for both low-income and high-income groups. As proposed by Marcuse (Citation1997), and earlier by Park (Citation1926), the spatial sorting of rich and poor are governed by very different forces. Because of their low income, poor individuals will be sorted into marginal positions in the housing market, whereas the rich – being able to out-bid other groups in the housing market – will be able to select housing options that are in line with their preferences concerning amenities, esthetic quality, location, social composition and status. In a European setting, an additional factor to be considered is housing policies aimed at improving the position of low-income households on the housing market through subsidies and public-housing options.
In this paper we take advantage of available geo-coded, register-based, individual level data in order to provide strictly comparative measures of socio-economic segregation in five European capital cities: Amsterdam, Brussels, Copenhagen, Oslo, and Stockholm. Geocoded data also allow us to analyze processes of spatial sorting at different geographical scales. This makes it possible for us to assess if segregation patterns for low-income and high-income groups are similar across metropolitan areas and, in this way, to provide a basis for a discussion of the driving forces behind segregation patterns. A guiding hypothesis is that the segregation patterns of high-income groups will be more similar across metropolitan contexts than the segregation patterns of low-income groups. The argument is that the latter will be influenced by different national policies, and that local circumstances will be more important for explaining the establishment of marginal areas.
The potential of using a comparative perspective in studies of socio-economic segregation has been demonstrated in three earlier studies (Musterd, Citation2005; Tammaru et al., Citation2015, van Ham, Tammaru, Ubarevičienė, & Janssen, Citation2021a). These studies conclude that socio-economic segregation in European cities is modest compared to the levels observed in the U.S. (Musterd, Citation2005) and in other cities in Asian and American countries (Marcińczak et al., Citation2015). Still, segregation levels and patterns vary greatly among European cities, which is commonly attributed to differences in welfare states regimes, housing systems and income distributions (Arbaci, Citation2007; Musterd, Citation2005; Tammaru et al., Citation2015; Veneri et al., Citation2020). Furthermore, the studies suggest that higher social classes tend to live more segregated than the lower classes (Musterd, Citation2005; Tammaru et al., Citation2015) and that socio-spatial inequalities have increased in Europe over the last decade (Marcińczak et al., Citation2015; Musterd et al., Citation2017). Yet, as pointed out by the authors, these results need to be interpreted with caution because of limitations in the underlying data (Musterd, Citation2005; Tammaru et al., Citation2015).
In our study, a drawback is that we only have included countries with available geocoded individual-level register data. Thus, improvements in terms of comparability have come at the cost of a more restricted scope. Still, we would argue that this type of effort is valuable since it allows the elimination of important sources of error that are linked to differences in definitions and geographical detail. Accuracy is not only a goal in itself. It also makes the data more valuable as a tool for evaluating competing theories. It becomes rational to give detailed attention to patterns shown in the data when one is confident that those patterns are not the result of mismeasurement.
For the present study, we benefitted from newly available data from Belgium, Denmark, the Netherlands, Norway and Sweden, which allowed us to construct comparable datasets for their five capitals in 2011. Our main purpose is to investigate socio-economic segregation patterns and levels in Brussels, Copenhagen, Amsterdam, Oslo, and Stockholm in a comparative setting.
Our research is based on harmonized geocoded indicators of poverty and affluence. Using a nearest-neighbors approach, we produced comparable measures of socio-economic segregation with a fine level of geographic detail and at multiple scales. Our analyses offer an unprecedented comparison of patterns and levels of socio-spatial inequalities in five European capitals, each with its particular housing system, housing policies and territorial, cultural and migration history.
Background
Previous comparative studies on socio-economic segregation
Until now, comparative studies on socio-economic segregation in Europe have been unable to use a standard for spatial variation in socio-economic inequality (Musterd, Citation2005). Indicators of poverty and affluence have varied a great deal across studies, as have the type of areal units and the methods to measure segregation levels.
In the last decades, three strands of research have attempted to compare socio-economic segregation among European cities. The first one is synthesized by Musterd (Citation2005) in a paper that gathers results from a series of international projects carried out around the year 2000, and which compares segregation levels in 16 European cities. An important obstacle is that poverty and affluence are measured by different indicators depending on the country. Moreover, these indicators refer to small spatial units when available (for instance, ward or neighborhood), but in some cases larger units had to be used. With such differences of measurement, segregation levels (based on the dissimilarity index) are hardly comparable among the 16 cities. Even so, bearing in mind the data limitations, the results suggest that socio-economic segregation is low in European cities compared to American cities. One notable exception is Antwerp, where the segregation of poor households is strikingly high compared to the other cities.Footnote1 Oslo appears as having relatively high segregation based on the concentration of social assistance receivers, whereas Copenhagen was found to have the lowest levels of segregation of low-income households. Amsterdam lies somewhere in the middle of the ranking. In all cases, Musterd (Citation2005, p. 339) stresses that affluent households live much more segregated than low-income households do: whereas the former are able to dissociate from the rest of the population, the latter tend to remain spatially attached to the middle classes.
A second research project examined socio-economic segregation in 13 European cities (Tammaru et al., Citation2015), among which were Amsterdam, Oslo and Stockholm. Although there was an effort to make segregation measures as comparable as possible, the intercity comparison was inevitably affected by data and measurement issues. Socio-economic status was based on occupation, income or education, depending on data availability in each city. Analyses focused on small spatial units; still these varied a great deal from one city to the other. The studies did not employ a single definition of cities’ geographical size: some included the metropolitan area while others were limited to the inner city. Despite these limitations in data, the authors were able to draw interesting conclusions from their comparative approach. In line with Musterd’s intercity comparison (Musterd, Citation2005), the authors argued that segregation is relatively low in Europe compared to other parts of the world (Marcińczak et al., Citation2015), although segregation levels had been on the rise since 2000, except for Amsterdam (Musterd et al., Citation2017). Again, they also found that the affluent classes live much more segregated than the lower classes in all cities. Their main findings related to the cities in the present study are that Stockholm had the highest segregation of the poor and the lowest segregation of the rich among all cities in 2011 (based on the dissimilarity index). Segregation of the rich was the second lowest in Oslo, while it was the second highest in Amsterdam. Both cities have middle positions in the ranking of segregation of the lower classes (fourth and sixth).
More recently, a third project including studies on 24 cities around the world (Van Ham et al., Citation2021a) focused on the links between rising social inequalities and residential segregation. This project also involved a great effort to produce segregation measures that were comparable across cities. All cities were delimited following the OECD definition of Functional Urban Area; furthermore, analyses were based on small spatial units (where possible) and used the same methods (dissimilarity index, location quotients and a common typology) to investigate levels and spatial patterns of segregation of top-, middle- and bottom socioeconomic groups (Van Ham et al., Citation2021b). These groups were defined based on occupation and, in some cases, on income. Of course, comparability is a major challenge in a worldwide project of this scale and the measures in the different cities are not strictly the same; still, the project managed to produce a unique overview of recent segregation processes in many different economic, social and geographic contexts. The only city of our study present in this project was Brussels (Costa & De Valk, Citation2021), which was shown to have low levels of segregation compared to the rest of the world, although segregation seems to be on the rise since 2001 (Van Ham et al., Citation2021b). One interesting finding from this project is that the geography of segregation has been changing in the last decades: in many cities the well-off are moving to central areas while the poor are relocating to the outskirts of urban areas.
Mechanisms behind spatial patterns of socio-economic segregation
Differences in segregation levels among cities are commonly ascribed to the impact of structural factors, namely social inequalities, the organization of housing systems, area-based interventions, housing policies in combination with specific local urban morphology, and migration dynamics. In this section, we discuss these main factors driving patterns of socio-economic inequality across space.
First, social inequalities have often been linked to socioeconomic segregation (see Van Ham et al., Citation2021a). Higher levels of wealth distribution, especially in social-democratic welfare states, are generally linked to lower levels of socioeconomic inequality, and to lower levels of socio-economic segregation (Arbaci, Citation2007; Musterd, Citation2005; Tammaru et al., Citation2015). Denmark, Norway and Sweden are universalistic welfare states, while The Netherlands may be seen as a corporatist or a hybrid welfare state that since the 1990s is moving into a more liberal model (Musterd & Van Gent, Citation2015). Belgium has been characterized as a conservative-corporatist welfare state type, with Arbaci (Citation2007) adding that the housing system makes Belgium a hybrid case. Musterd (Citation2005) describes Belgium as a strong welfare state with a high extent of redistribution and low levels of income inequality.
We examined levels of socioeconomic inequality for each of the countries under study, as they may be associated with socio-economic segregation, using the GINI coefficient based on 2011 Eurostat data. Norway had the lowest coefficient (22.7), while Belgium, Denmark, the Netherlands and Sweden having quite similar levels of around 25–26. Based on these statistics, one may expect Oslo to have the lowest level of socio-economic segregation, and the other capital cities to have slightly higher levels. However, a low GINI coefficient may not be a sufficient condition for low levels of segregation in a European context (Arbaci, Citation2007).
Second, housing systems have been found to drive segregation patterns. The housing systems in the capitals in this study have all been de-regulated over time. Liberalization of the housing market has in most places led to an increase of market influences, for instance, by an increasing share of home ownership and a decreasing share of available rentals. Studies have shown that the liberalization of urban housing markets tends to influence mobility of especially the more affluent groups. General trends in European housing markets over the last few decades are retrenchments of welfare states, cuts in universal housing subsidies, partial privatization of the social housing stock and promotion of owner-occupied housing (Arbaci, Citation2007). Especially the role of the social rented sector is seen as a significant factor behind (changing) patterns of segregation. A relatively small share of social housing tends to be associated with higher levels of socio-economic segregation (Musterd, Citation2005).
The share of social housing varies substantially over the capital cities considered in this paper. In Amsterdam, the share of public housing is as high as 67% (Statistics Netherlands, Citation2011). The Dutch social rented sector, and even more so in Amsterdam, is characterized by a relatively mixed population in terms of income, compared to other countries. Nevertheless, as a result of the sale of social rented dwellings and stricter regulations, Musterd and Van Gent (Citation2015) found that social housing in Amsterdam is increasingly inhabited by the lowest income groups, affecting the overall pattern of poverty segregation. It is also worth noting that the economic crisis hit the Dutch housing market much harder compared to the other countries. During economic crises, people tend to move much less, which may result in decreasing segregation, as was found for Amsterdam (Musterd & Van Gent, Citation2015). However, after the economic crisis, because of increased mobility and rising house prices, socio-economic segregation may increase again. The Belgian housing system has long been exceptionally liberal (De Decker, Citation2008), with housing policies mainly directed toward home ownership and social housing accounting for only 8% of the total housing stock in Brussels (Dessouroux et al., Citation2016). The relationship between the housing system in Norway, Sweden and Denmark and their levels of socio-economic segregation seems more complicated. Norway stands out among the Nordic countries with a very high share of home-ownership, and a very low share of public housing, after the housing market was deregulated in the 1980s. Stockholm has a very constrained housing market, with very long queues for rental housing that especially affects newcomers and youth. Property prices in both Stockholm and Oslo have increased substantially over the last decade, and an increasing share of rentals are transferred to owner-occupied apartments in Stockholm. Andersson and Kährik (Citation2015) show that in Stockholm in the period 1990–2010, the share of public rentals went down from 19 to 7% in the inner city, and from 31 to 17% in the inner suburbs. As a result, low-income groups are forced into multifamily housing estates in suburbs much further away from the city center. Such developments likely influence patterns of poverty segregation. The Danish situation is characterized by a substantial social housing sector in a strongly regulated housing market (Andersen et al., Citation2000). Copenhagen has a very tight housing market (Skovgaard Nielsen, Citation2017) with a social housing sector increasingly being residualized (Abramsson & Borgegård, Citation1998). Summarizing our expectations for the effects on socioeconomic segregation, we may expect Amsterdam to have the lowest levels of socioeconomic segregation, mostly based on the substantial size of social housing in the city. For similar reasons, segregation might be relatively low in Copenhagen as well. Slightly higher segregation may be expected for Stockholm, based on the combination of the unitary housing regime and decreasing rental sector. The highest levels may be seen in Oslo, where the share of homeownership is substantial, and in Brussels, with very little social housing and a liberal housing market.
Third, another major factor influencing patterns of socio-economic segregation are area-based interventions. Especially, interventions directed toward an increasing social mix have been implemented in all cities of the study, with the aim of decreasing deprivation and increasing social cohesion, for instance, by new construction or tenure conversion. Bergsten and Holmqvist (Citation2013) and Roger Andersson et al. (Citation2010) evaluate such interventions for Sweden and conclude that none of these have managed to lead to decreased segregation levels. Andersen (Citation2002), based on Danish segregation research, argues that we need to understand deprived areas as excluded places in order to assess the effects of area-based interventions. In Norway, especially long-term initiatives that join public and private actors have led to positive effects on large housing estates (Brattbakk & Hansen, Citation2004). Uitermark (Citation2003) argues that the need for social mixing policy may be questioned in the Netherlands, as concentrations of poverty are relatively low. Musterd (Citation2005) speculates that Dutch policies might have been more efficient in intervening in deprived areas compared to for instance, Sweden. Especially in Amsterdam, low-income groups have benefited from local policies to increase the social mixing of income groups (Boterman et al., Citation2020). In Brussels, policies aimed at revitalizing neighborhoods and increasing social mix are targeted at a delimited area encompassing the most deprived neighborhoods (Dessouroux et al., Citation2016; Romainville, Citation2010), although there is no evidence to date that these policies are effective in reducing segregation.
Fourth, housing policies in combination with specific local urban morphology contribute to segregation patterns. In most European cities, large housing estates were built in the urban fringes in the 1960s and 1970s. At first, such locations attracted younger native populations, but over time, these populations aged and since the 1980s, they have been partially replaced by more and more disadvantaged groups, such as newly arrived migrants (see Hess et al., Citation2018). The uneven spatial distribution of housing tenure types across cities contributes to different patterns of segregation of poverty and affluence. The poorest groups generally end up in more disadvantaged neighborhoods with cheaper housing, while the segregation of affluent households may be more driven by choice, such as preferences for high-quality housing, good neighborhoods and affluent neighbors (Marcuse, Citation1997). Thus, purchasing power and socioeconomic homophily contributes to the segregation of the most affluent. Varying European housing policies on how to house low-income groups have contributed to locally varying segregation patterns. In Copenhagen, postwar urban growth took the form of the middle class leaving the city center for the north and the northwest. The larger housing estates in the south and southwest instead increasingly became populated by more marginalized populations (Andersen et al., Citation2000). Private rentals are most common in the central city, while owner occupied housing is predominantly found in the outermost ring of the urban area. Brussels can be characterized by deprived central neighborhoods and prosperous outskirts, which is due to long-term housing policies and territorial processes (Costa & De Valk, Citation2021). This spatial duality results from postwar suburbanization processes, when the middle class left central areas and labor migrants moved in, in later decades followed by mostly non-European migrants. European expats on the other hand live in more affluent areas, either centrally or in the urban fringes. In Amsterdam, urban development policies have led to a change in those living in the central parts of the city, from working class to mixed income households (Sleutjes et al., Citation2019). Compared to the other cities, the pattern of households in social housing shows a large spatial variation. Sharply increasing housing prices led those with lower incomes, such as migrants, to move to surrounding areas, while inner city areas gentrified (Hochstenbach & Van Gent, Citation2015). Oslo is characterized by a persistent east-west divide, a remnant of the 19th century that has persisted over time. The relatively poor east was the main place where relatively large-scale affordable housing projects were located during processes of postwar suburbanization, while the west, including an affluent strip along the eastern side of the Oslo fjord in the south mostly houses affluent households (Myhre, Citation2017; Wessel, Citation2017). The housing estates were much more small-scale compared to Stockholm (Andersen et al., Citation2016), where large-scale housing projects were developed in the 1960s, mostly in the outskirts of the city, and notably in the northwest and the southeast (Andersson & Bråmå, Citation2018). The large-scale conversion of public multifamily housing into market-based cooperate housing has contributed to increasing levels of socio-economic segregation, with households in non-converted public housing in the suburbs becoming relatively poorer compared to those in converted housing (Andersson & Turner, Citation2014). The city’s fragmented urban fabric, especially in the city periphery, has worsened segregation between groups (Rokem & Vaughan, Citation2019). In sum, although it is difficult to advance expectations in respect to segregation levels, we can expect that housing policies combined with specific urban morphology will differently shape the segregation patterning in the five cities under study.
Fifth, the interrelations between migration dynamics and segregation patterns is an important research topic that deserves some attention as well. All capitals in this study have seen large increases in migration flows during the last decades, but absolute and relative numbers have by far been largest for Sweden. Ethnic segregation in the countries in this study is highest for the Netherlands and Belgium on a macro scale, and lowest for Denmark and Norway. On the smallest scale level, ethnic segregation is quite similar across countries, but highest for Belgium and lowest for Norway (Andersson, Malmberg et al., Citation2018; Rogne et al., Citation2019), though local urban segregation patterns may be quite different from those at the national scale. There are studies evidencing the link between deprived areas and high densities of immigrants: e.g. Costa and De Valk (Citation2018) found that ethnic and socio-economic segregation clearly overlap in Brussels, in a process of large-scale isolation of deprived migrants in central neighborhoods. But the relationship is by no means universal (Wessel, Citation2015). Based on these studies, it may be expected that socioeconomic segregation may be highest in Amsterdam and Brussels, and lowest in Copenhagen and Oslo, but that there are differences by scale level.
The link between migration and segregation may be also related to the cities’ global connectedness. The more connected a city is, the more it attracts affluent workers for high-profile jobs and in companies and international institutions, and also low-skilled workers in the consumer service sector (Musterd et al., Citation2017; Sassen, Citation2001). According to the GaWK’s 2012 city classification, Brussels and Amsterdam are the most globally connected of the five cities (Alpha), followed by Stockholm (Alpha-), Copenhagen (Beta+) and Oslo (Beta) (Globalization and World Cities Research Network, Citation2012). We might therefore expect socioeconomic segregation to be highest in Amsterdam and Brussels.
Migration flows to, from and within metropolitan areas may also impact on levels of socio-economic segregation. The theory of spatial assimilation states that with increasing socio-economic status, migrants tend to move from deprived areas and to more affluent areas. However, the evidence for the theory in the cities under examination is mixed. Rogne (Citation2018) finds that descendants of non-western migrants in Oslo that are economically successful more often move to neighborhoods that are more affluent and contain lower shares of non-western migrants. However, he also finds that the contribution of descendants of non-western migrants to both ethnic and socio-economic segregation is insignificant. Vogiazides (Citation2018) finds that it is mostly recently arrived migrants in Stockholm that move away from distressed areas, while other migrants stay put; while Vogiazides and Chihaya da Silva (Citation2019) find that being employed and highly educated increases the probability for migrants to move to more affluent neighborhoods. Settlement patterns are also caused by ethnic preference among migrants, to move to co-ethnics in certain parts of urban areas (Van Ham & Manley, Citation2009). In addition, natives’ avoidance of deprived or immigrant-dense areas also influences segregation patterns (Bråmå, Citation2006; Zorlu & Latten, Citation2009). In Denmark and Sweden, natives have been found to be more likely to leave immigrant-dense neighborhoods (Andersen et al., Citation2016).
In sum, we have a series of expectations for the five capitals in our study based on the factors shaping the geographical patterns of socio-economic segregation, that are summarized in below. These expectations are partly contradictory and likely scale-dependent, and we do not expect a single factor to explain differences between cities. Hence, it is unfeasible to formulate general hypotheses on the levels and patterns of segregation in the five cities. Still, we will discuss our results in the light of these different expectations in the discussion section.
Table 1. Summary of expectations: how the drivers of spatial inequalities might contribute to the levels and patterns of socioeconomic segregation in each city (relative to the other cities)
Methodological challenges in comparative studies
There are at least three major methodological challenges in international comparisons of socio-economic segregation: differences in spatial units, lack of standard segregation measures, and issues related to the scale of segregation.
Most studies use data that are aggregated for fixed administrative subdivisions. Analyses based on administrative boundaries are hampered by a range of issues (Clark et al., Citation2015), namely the Modifiable Area Unit Problem (MAUP) (Nielsen & Hennerdal, Citation2017; Openshaw, Citation1984;) that states that outcomes highly depend on the way geographical units are defined. With inter-country comparisons, the problem is aggravated, as spatial units that represent data tend to differ structurally between countries and regions and over time. Research on the MAUP suggests that segregation research will not be able to progress until this problem is addressed in a credible way (Openshaw, Citation1984). In addition, differences in population data systems between countries – with dissimilar types of data and output geographies – add to the difficulties of international comparisons (Shuttleworth & Lloyd, Citation2009).
Another factor that further complicates comparison of levels of socio-economic segregation across cities and countries is that there is no standard of segregation measurement. Some of the most used indices are the dissimilarity index and the exposure index (Clark, Citation2015), with a number of indices especially suitable for geographical studies (Brown & Chung, Citation2006).
A third methodological issue that studies increasingly give notice to is that segregation processes occur at different scales. American segregation researchers have started to make a distinction along geographical levels, and between micro and macro scale segregation (Fisher et al., Citation2004; Lichter et al., Citation2015; Reardon et al., Citation2008). Others have modified segregation and isolation indices by introducing spatially weighted matrices to reflect the extent of contact between spatial units (e.g. Wong, Citation2004). Andersson, Malmberg et al. (Citation2018) describe the recent surge in studies advocating a multiscalar measurement of segregation. Instead of focusing on either large neighborhood scales or small-scale predefined administrative areas, as most previous studies have done, a multiscalar design examines segregation levels depending on the size of the neighborhood (Fisher et al., Citation2004; Hennerdal & Nielsen, Citation2017; Lichter et al., Citation2015; Reardon et al., Citation2008). As Fowler (Citation2016) argues, there is no correct scale for measuring segregation; instead, segregation should be measured continuously at different scales to capture both large-scale divisions and segregated “pockets”. A multiscalar approach is also able to take into account varying local levels of segregation, which may be hidden when only considering single measures of segregation levels for a whole city.
In the last few years, increasing attention has been given to an innovative multiscalar approach that uses individualized neighborhoods instead of predefined administrative units (Andersson, Lyngstad et al., Citation2018; Andersson, Malmberg et al., Citation2018; Chaix et al., Citation2009; Fowler, Citation2016; Östh et al., Citation2014; Petrović et al., Citation2021; Reardon et al., Citation2009; Sleutjes et al., Citation2018). Individualized neighborhoods are defined as neighborhoods based on a pre-determined number of nearest neighbors, independently of administrative borders. Alternatively, individualized neighborhoods can be based on a fixed distance radius. A main advantage of the approach is that it can be applied in the same way in different national contexts, resulting in measures of segregation that are exactly comparable and that offer a solution to the MAUP. By using different sizes of neighborhoods, measured as different numbers of nearest neighbors, several scales can be included in the analysis.
There may be disadvantages using multiscalar individualized neighborhoods as well. Depending on the research question, the use of administrative areas might be useful. An example of such a case could be when one is interested in the effect of policy measures on certain geographical levels. Second, a consequence of the method is that the geographical size of the individualized neighborhoods varies substantially depending on population density. The five cities under study have different morphologies (e.g. the presence of water in Scandinavian capitals; or the flat and densely populated urban areas in Brussels and Amsterdam). Andersson, Malmberg et al. (Citation2018) show that notwithstanding this variation in the five countries under study, people live in local neighborhoods that are similarly structured. Moreover, using overlapping individualized neighborhoods instead of fixed geographical subdivisions does not allow the use of multilevel statistical models for analyzing the contribution of different spatial scales to the variation in neighborhood composition (Jones et al., Citation2015). Thus, individualized neighborhoods should be considered as one approach to segregation measurements that needs to be complemented by other approaches.
Aims and research questions
The increase in availability of geocoded individual register data opens up possibilities for multiscalar studies of segregation patterns within and across countries. To study residential segregation in five European capitals we use such data for Belgium, Denmark, the Netherlands, Norway and Sweden, and construct individualized scalable neighborhoods to examine patterns of segregation. Using these unique data and methods, this paper aims at overcoming the typical methodological limitations in international comparisons and accurately compare segregation levels and patterns of poverty and affluence in the five countries’ capitals. We address the following research questions:
To what extent do socio-economic segregation patterns vary across European capitals and at different scales?
How can these segregation patterns be interpreted in the light of inter-country structural differences such as welfare regimes, housing systems, income distribution and migration dynamics?
Data and methods
Data and indicators
We use geocoded register data provided by the statistical offices of the five countries for 2011. The unit of analysis is the grid obtained by x and y coordinates. In Belgium, Denmark, Norway and the Netherlands, indicators were computed for each 100 m*100 m grid cell. For Sweden, coordinates are aggregated into 250 m*250 m grids in urban areas and 1000 m*1000 m grids outside urban areas. Details are provided in Nielsen et al. (Citation2017).
For each grid cell, indicators of poverty and affluence were computed based on income data from national registers maintained by the tax authorities. For the poverty indicator we used disposable income after social transfers. For the affluence indicator we used taxable earned income from wages and net-earnings from self-employment. There are differences in what is included in the income measured (see Nielsen et al., Citation2017).Footnote2 In Belgium, for example, it is not possible to distinguish between disposable income and taxable earned income, and the latter was used in both indicators. In addition, we had to exclude all null incomes in Belgium – mostly from international workers – to avoid bias.Footnote3 Income data in the Netherlands do not include rent subsidies and capital income. Some countries include certain grants in the data, while others do not. Therefore, income data are not strictly comparable among countries. But, as argued below, our analyses are still able to provide insights into segregation patterns despite these issues. Moreover, we use measures of relative income rank, that are likely to be less sensitive to different definitions compared to direct measures of income.
The poverty indicator is based on the Eurostat definition of the “at-risk-of-poverty rate”, defined as the share of people with an equivalised disposable income below the at-risk-of-poverty threshold, which is set at 60% of the national median equivalised disposable income after social transfers. Due to difficulties in finding a common definition of households with data from the five countries, our measure is defined for individuals who are aged 25 or above.
The affluence indicator is based on taxable earned income for those aged 25 to 64 years old. People are ranked according to their income and grouped into deciles. Persons in the highest income decile at the national level are defined as high-income earners.
In sum, the indicators used in the paper are the following:
poverty: the share of persons aged 25 or above with a personal disposable income below 60% of the median level;
affluence: the share of persons aged 25 to 64 whose taxable earned income is in the highest decile.
It is important to note that our poverty indicator also captures retirees with low retirement incomes and some people with low incomes who should not be considered poor, including individuals with high wealth but low income and people with low individual incomes but with high-income spouses. In addition, we are not able to control for receiving social benefits.
Definition of study space and multiscalar individualized neighborhoods
For comparability purposes across the five cities, we demarcated metropolitan areas of equal area. These extend over a 25 km radius around each city’s central train station. The central stations were chosen as a central point because they are a common reference as the city center, especially for commuters. Using this definition, we attempted to encompass all the neighborhoods that are linked to the cities’ labor market and commuting zones – that is, where the cities’ inhabitants reside, even if it is outside of their administrative boundaries.
In each of the five metropolitan areas, we constructed individualized neighborhoods at multiple scales. First, the territory was divided into small-scale grids (250 m*250 m in Stockholm; 100 m*100 m elsewhere). Next, we used individual geocoded register data to identify the population residing inside each grid. The individualized neighborhoods were constructed by expanding a geographic buffer around each grid cell using the EquiPop software (Östh et al., Citation2015) until the 200; 1,600; 12,800; and 51,200 nearest neighbors were obtained. In this way, we constructed strictly comparable units across the five cities at four different scales, varying from individuals’ immediate surroundings to urban areas, with a high level of geographic detail and independent of administrative borders.
In the end, we obtained five datasets (one per city) with two indicators (affluence and poverty) calculated for individualized neighborhoods at four scale-levels (k = 200; 1,600; 12,800; 51,200).
Methods
We use methods that focus on the spatial representation of poor and affluent, as opposed to spatial concentration (see Andersson, Malmberg et al., Citation2018). In other words, we do not compare the proportion of poor (affluent) inhabitants with respect to the neighborhood population; instead, we relate these proportions to each city’s overall levels of poverty and affluence. The question we are looking at is how many of the city’s poor (affluent) population live in each neighborhood and to what extent they are over/ underrepresented in certain neighborhoods. We believe this strategy minimizes the risk of bias that may arise from the slight differences in definitions in income data in the five countries.
We use three tools to examine segregation patterns and levels: the dissimilarity index (DI), representation of poor (affluent) in neighborhood percentiles, and the mapping of location quotients.
The first tool is the DI, the most widely used aggregate measure of segregation (Duncan & Duncan, Citation1955; Massey & Denton, Citation1988). The way the DIs are calculated for individualized neighborhoods are slightly different from the typical formulas used in the case of fixed geographical units (Malmberg et al., Citation2018). We started by ordering all individuals in each city by the proportion of poor (affluent) people in their individualized neighborhood at a given scale.Footnote4 Next, we divided them in percentiles, or bins, containing 1% of the population each (see Andersson, Malmberg et al., Citation2018). DIs are obtained by taking the sum of the absolute differences between the representation of poor (affluent) and the representation of non-poor (non-affluent) in each bin, divided by two (Andersson, Malmberg et al., Citation2018):
The DI can thus be considered as a synthetic measure of representation at the level of metropolitan areas. Its values vary between 0 and 100; 0 denoting that poor and non-poor (affluent and non-affluent) are equally represented in all neighborhoods; and 100 signifying that the poor (affluent) are not present at all in neighborhoods with non-poor (non-affluent).
For the second tool, the representation of poor (affluent) persons with feature F in a given bin i is obtained by the number of poor (affluent) individuals in the bin divided by the total number of poor (affluent) individuals in the metropolitan area (Andersson, Malmberg et al., Citation2018):
If poor (affluent) residents were equally distributed across the metropolitan area, each bin would contain 1% of the total poor (affluent) population; that is, a value of 1% means equal representation. Values lower than 1% denote under-representation whereas values higher than 1% signify over-representation. As shown below, this tool allows us to examine how much of the cities’ population live in neighborhoods where the poor (affluent) are over- and under-represented.
Third, as we are interested in the location and extension of poor and affluent areas, we map the representation of poor and affluent residents in neighborhoods. To this end, we computed and mapped the location quotients (LQ) of poverty and affluence at the four scales in each metropolitan area. The location quotient compares the share of the subgroup in question (here poor/affluent) in a neighborhood to the share of the subgroup in the total area (here the metropolitan area). It is a measure of the relative density or area concentration, and has the advantage of being simple and straightforward (Brown & Chung, Citation2006). It may be seen as a spatial variant of the percentile plots. Spatial patterns, including spatial outliers, can be identified using the LQ. If the LQ is 1, it means that there is a match between the neighborhood’s share of poor (affluent) and the total area’s share of poor (affluent); values lower than 1 indicate that poor (affluent) residents are under-represented in the neighborhoods; values higher than 1 indicate that poor (affluent) residents are over-represented in the neighborhoods relative to a perfectly even distribution in the metropolitan area.Footnote5,
Findings
presents the total population in the five metropolitan areas delimited in the study and the overall shares of the population at risk of poverty and with high income. These overall shares may not be strictly comparable among cities due to the differences in income definitions mentioned above. Still, bearing in mind that levels of poverty and affluence are indicative, it is interesting to note that the three Scandinavian capitals cities have somewhat lower shares of residents at risk of poverty compared to Brussels and Amsterdam. Overall levels of socio-economic inequality may suggest higher levels of socio-economic segregation (Reardon & Bischoff, Citation2011), although the relation is far from linear. On the other hand, the share of persons with high income is higher in the Scandinavian cities. Brussels and Amsterdam are the most populated metropolitan areas: population density is knowingly higher in Belgium and the Netherlands and, furthermore, the three Scandinavian areas encompass significant extents of water and/or forest.
Table 2. Total population and overall levels of poverty and affluence in the five metropolitan areas
presents dissimilarity indices for each city and scale level. The DI values show that segregation becomes less pronounced as the neighborhood scale is increased. This is an important feature of the MAUP (Olteanu et al., Citation2019); larger areal units are more homogeneous than smaller units, and it underscores the relevance of paying attention to scale in the study of segregation. Brussels and Stockholm have the highest dissimilarity indices for poverty at every scale, and Amsterdam shows the lowest segregation of the poor at higher scales. For Brussels, the DIs show that segregation of the poor changes relatively little as the scale increases. Brussels is the only city with substantial large-scale poverty segregation; the DI for poverty is still 29 at the level of 51,200 nearest neighbors, which is double that of Oslo and Copenhagen and more than triple that of Amsterdam.
Table 3. Dissimilarity index (percent) of poverty and affluence in the five metropolitan areas
The second part of shows the DI for high income. Compared to the concentration of poverty in capital cities, segregation by high income is much more severe.Footnote6 At the smallest scale levels, about 55 to 71% of the population would have to move to create an equal distribution of high income across metropolitan areas. Segregation by high income at small scale levels is nearly double that of the level of poverty segregation in most capitals. Stockholm stands out as the most segregated at lower scales, while large-scale segregation is lowest in Amsterdam. In Oslo, high-income groups to the highest extent live in segregated neighborhoods at the highest k-level (a pattern also documented by Toft (Citation2018)).
Although segregation levels necessarily become lower when the neighborhood scale is increased, this decline by no means follows a regular pattern. In some cases, for example, with respect to poverty in Amsterdam, the decline is strong; whereas in others, for example, with respect to poverty in Brussels, there is very little decline in segregation with increasing scale. Another contrast is between Stockholm and Oslo with respect to high income earners. In Stockholm, segregation declines quite rapidly with increasing scale for high income earners whereas in Oslo the decline is weak, resulting in Stockholm being more segregated than Oslo for smaller scales, but Oslo being more segregated than Stockholm at larger scales. As we shall see from the maps below, this is related to the spatial structure of segregation; the DI decreases more with higher scales if segregation takes the form of micro-scale “pockets” (examples: top-income in Stockholm and Amsterdam) rather than macro-scale divisions (examples: top-income in Oslo, at risk of poverty in Brussels).
show the percentile plots for poverty and affluence, respectively, in the five capitals, at four different scales. These plots depict the representation of poor and affluent residents in neighborhood bins, providing a more detailed presentation of over- and under representation. The left plot shows percentiles 0–60 while the right plot shows percentiles 60–100. This is done to facilitate the visualization of values at both ends of the distribution (note that the two plots have different scales on the y-axis). Taking the two upper plots in as an example, these can be interpreted as follows. Each percentile contains 1% of a city’s population; hence, if poor residents were equally represented in neighborhoods, each percentile would contain 1% of the city’s poor. In the absence of segregation, the curves in the plots would therefore be horizontal at 1%. Points below this line mean that poor residents are under-represented in neighborhoods, whereas points above it reflect over-representation of the poor. The left plot shows the neighborhoods, formed by the 200 nearest neighbors, with lower representation of poor residents. At the 10th percentile, Stockholm has a value below 0.55: this means that 10% of Stockholm’s population lives in neighborhoods that have less than 55% of the share of the poor population than what we would find in a situation where this segment of the population is evenly distributed.
Figure 1. Representation of persons at risk of poverty in percentiles
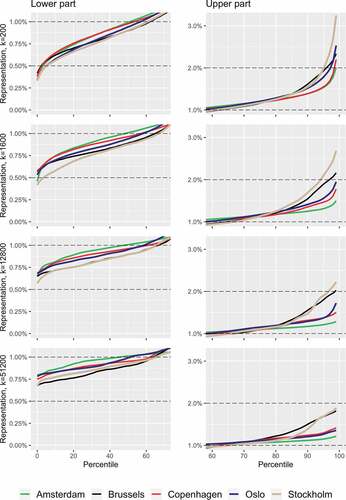
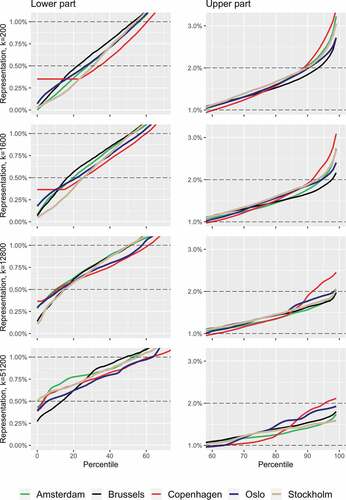
Figure 2. Representation of persons with high income in percentiles*
From , which describes the over- and under representation of persons at risk of poverty, we see that at the smallest neighborhood scale (k = 200), Stockholm has the highest levels of segregation of persons at risk of poverty. This is particularly pronounced at the top-end of the distribution, where a few neighborhoods have a stark overrepresentation of persons at risk of poverty. This is also true at the intermediate scale of k = 1,600, where there is also a clear under representation at the lower end of the distribution. At higher scales, the levels of segregation in Stockholm are similar to those found in Brussels (k = 12,800), or even surpass them (k = 51,200). This suggests that Brussels, followed by Stockholm, has the highest levels of macro-scale segregation of people at risk of poverty.
describes the over- and under representation of persons with high incomes. Here, we see that when we study micro-scale neighborhoods (k = 200), Copenhagen appears to have the lowest levels of under representation and the highest levels of overrepresentation of people with high incomes across much of the distribution. However, the data is capped below the 25th percentile, and thus not comparable at the bottom quarter of the distribution. At k = 1,600, neighborhoods in Stockholm have the most pronounced under representation of people with high incomes, indicating that some neighborhoods in Stockholm have relatively few high-income individuals, compared to the other cities. Meanwhile, the highest overrepresentation of high-income individuals can still be found in neighborhoods in Copenhagen. Studying large-scale neighborhoods at k = 12,800 reveals a similar pattern, except that the patterns of over- and under representation in Brussels here closely follow those found in Stockholm, and suggest that some neighborhoods have a substantial under representation of people with high incomes. As for macro-scale neighborhoods (k = 51,200), the lowest levels of under representation can be found in Brussels, where high-income individuals are starkly underrepresented in some neighborhoods. Meanwhile, high-income individuals are most overrepresented in neighborhoods in Copenhagen, followed by Oslo, indicating strong patterns of macro-scale segregation of the most affluent segment of the population. These patterns correspond well with the DI results. Another interesting feature of these plots is that they confirm the stronger segregation of the rich than of the poor. Overall, the percentile plots for individuals at risk of poverty are closer to the horizontal 1% line than the plots for high income individuals. This pattern of pronounced high-income segregation is also in line with previous studies (Musterd et al., Citation2017).
To provide a more in-depth description of the segregation patterns in the five cities, we include maps in . These depict the location quotients of poverty and affluence in the five capitals. They allow us to locate the highest and lowest concentrations of poor and affluent residents in the cities and to compare spatial patterns of segregation. The maps in reveal the most detailed segregation patterns at the micro-level (k = 200). For Brussels, we see that persons at risk of poverty are primarily concentrated in the densely populated neighborhoods situated at the nineteenth-century industrial belt, northwest of the city center. This area – known as the “poor croissant” – has a high concentration of immigrant-origin minorities (Costa & De Valk, Citation2018). Persons with high incomes are primarily overrepresented in southeastern municipalities near the Sonian Forest and starkly underrepresented in the abovementioned “poor croissant”, showing that these areas are not just characterized by an overrepresentation of the poor, but also a striking absence of the rich; a feature also apparent in the percentile plot (, k = 51,200). These overall patterns are also clearly visible at higher neighborhood scales () and explain the relatively stable DI across scales.
Figure 3. Location quotients for poverty at k = 200
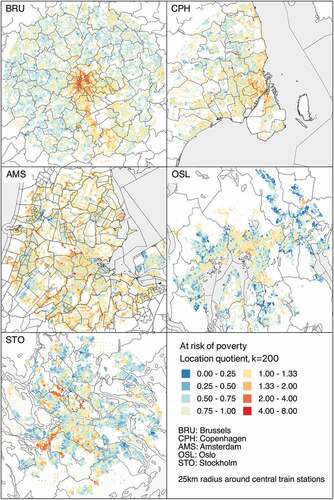
Figure 4. Location quotients for poverty at k = 1,600
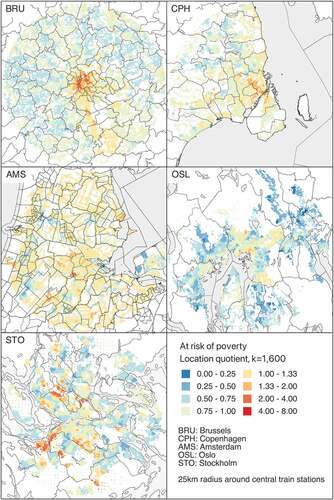
Figure 5. Location quotients for poverty at k = 12,800
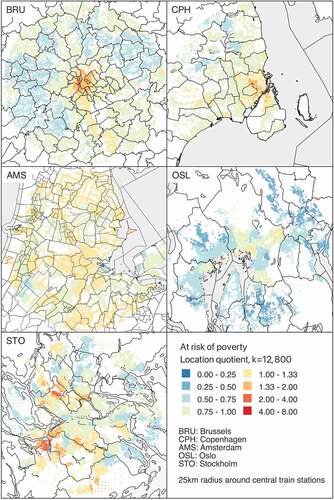
Figure 6. Location quotients for poverty at k = 51,200
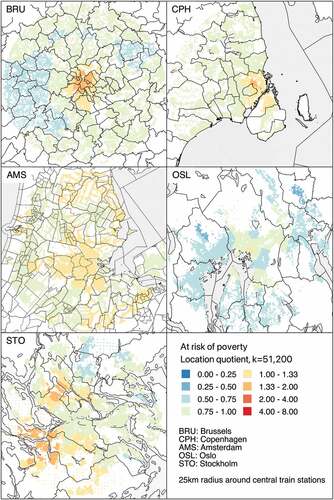
Figure 7. Location quotients for affluence at k = 200
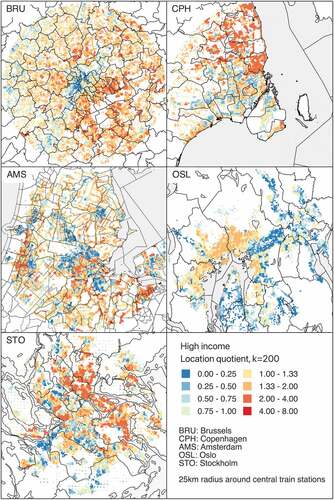
Figure 8. Location quotients for affluence at k = 1,600
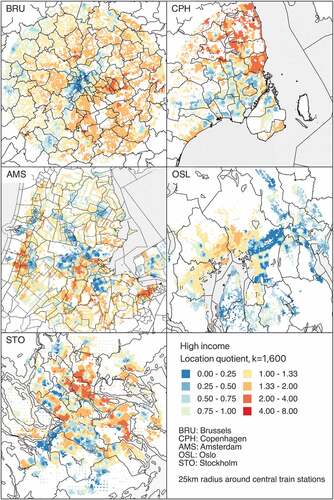
Figure 9. Location quotients for affluence at k = 12,800
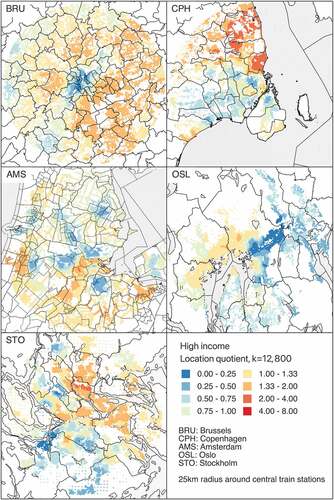
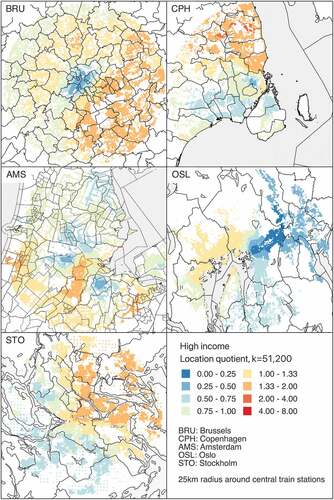
Figure 10. Location quotients for affluence at k = 51,200
In Copenhagen, however, people at risk of poverty are much less geographically concentrated than in Brussels, although they are overrepresented in central neighborhoods also here – particularly in neighborhoods in Nørrebro, Bispebjerg, Vesterbro and the city center (). Compared to people at risk of poverty, the overrepresentation of high-income individuals is much starker and concentrated in the municipalities north and west of the city center, still reflecting postwar mobility patterns of the middle class (). The patterns for this group also reveal a clear under representation in central, southern and western parts of the urban area.
The Amsterdam maps of the representation of people at risk of poverty primarily show that there is little segregation of this group in the city (), consistent with a recent study by Petrović et al. (Citation2021). The most important exceptions are areas in Westpoort, which is an industrial area, where in 2011 a homeless shelter was located, and an area in Zuid, south of the Olympic stadium, where many homeless people were registered as resident to receive support and mail. In other words, these clusters do not necessarily reflect residential choices, and they more or less disappear at higher neighborhood scales (), as was also evident from the DIs. The segregation patterns for high-income individuals are much more pronounced, although they take the form of segregated pockets, rather than large-scale divisions. This group is overrepresented in the municipalities of Gooise Meren and Huizen in the east, Amstelveen in the south, Bloemendaal and Heemstede in the west, and in the Centrum, Zuid and Oost boroughs in Amsterdam. In the Amsterdam urban area, however, the residential patterns of high-income individuals are also characterized by strong under representation in a belt of neighborhoods in the boroughs of Nieuw-West, West, Westpoort, and Noord, as well as in Zuidoost, and in the municipalities of Zaanstad and Purmerend in the north, Almere in the east, and Heemskerk, Beverwijk, Velsen and Haarlem in the west. Thus, relatively deprived neighborhoods in Amsterdam are not so much characterized by an overrepresentation of the poor as an absence of the rich.
In Oslo, the most detailed maps show that individuals at risk of poverty are relatively dispersed, though they are overrepresented particularly in the city center and in neighborhoods in the southern (Holmlia and Søndre Nordstrand) and eastern (Groruddalen) parts of the city; areas dominated by apartment buildings and with high concentrations of ethnic minorities (Wessel, Citation2015, Citation2017). Some of the neighborhoods in the north, where this group is overrepresented, are primarily student dwellings (). The segregation patterns of high-income individuals, however, are quite striking, showing a macro-level pattern of strong overrepresentation in the southwestern and western parts of the city, and the municipalities of Asker and Bærum west of the city – in hilly, sea-facing neighborhoods primarily dominated by detached houses. The under representation of people with high incomes in the eastern and southeastern districts is equally striking (), and the characteristic east/west divide remains apparent at larger scales (), in line with the DI results.
Maps of Stockholm show that individuals at risk of poverty are most overrepresented in the Rinkeby-Kista and Spånga-Tensta boroughs in the northwest, the Skärholmen borough and neighborhoods in the municipalities of Huddinge and Botkyrka in the southwest (): densely populated areas with high concentrations of immigrant-origin minorities that were object of the Million Housing Program in the 1960s. Individuals with high incomes are most overrepresented in neighborhoods north and east of the city center, such as the municipalities of Danderyd, Täby, Lidingö, Vaxholm and Nacka (), which are among the Swedish municipalities with the highest median income (Statistics Sweden, Citation2020). The under representation of top-income individuals in the Stockholm urban area closely mirrors the overrepresentation of individuals at risk of poverty. This spotted pattern of small-scale segregation explains both the high DI values at small scales, and the reduction in DIs with larger scales.
As these maps show, segregation patterns vary substantially between European cities. For instance, while Brussels is characterized by the concentration of poverty in the city center, relatively poor neighborhoods are more geographically dispersed in the other cities, though inner-city poverty concentrations can to some extent be found in Copenhagen and Oslo as well. The maps show a clear macro-level east-west divide in Oslo, a center-periphery divide in Brussels, a north-south division in Copenhagen while spatial patterns are more complex in Stockholm and Amsterdam. But there are some obvious (and unsurprising) common features across most cities; individuals at risk of poverty are primarily overrepresented in neighborhoods with a high population density dominated by apartment buildings, and with high concentrations of immigrant background minorities. In other words, socioeconomic segregation, ethnic segregation and housing are closely interconnected. Additionally, most poor neighborhoods are characterized more by the absence of high-income individuals than by concentrated poverty. High-income individuals are much more segregated than individuals at risk of poverty are, and tend to be overrepresented in suburban neighborhoods dominated by detached houses.
Discussion and conclusions
This paper has presented unique data on socio-economic segregation in Northwestern European capital cities in 2011. The data and methods used in the paper allow for truly comparable dissimilarity indices, maps and percentile plots. For the first time, we are able to draw conclusions on the levels and patterns of socio-economic segregation in Brussels, Copenhagen, Amsterdam, Oslo and Stockholm in a comparative perspective.
The unique geocoded register data in combination with a multiscalar approach solves the previous problems that have prevented good comparative segregation studies. In addition, conceptual issues could largely be solved as well, by adapting joint definitions of indicators of poverty and affluence. The resulting measures of socioeconomic segregation at multiple scales offer a first-time comparison of patterns and levels of socio-spatial inequalities in five European capitals.
Our main conclusion is that for all cities, the level of segregation by affluence is much higher than that of segregation by poverty, at every scale. Macro-scale poverty segregation is most prominent in Stockholm and Brussels, and quite low in Amsterdam. At micro scales, Brussels and Stockholm stand out with a presence of local pockets of poverty. In such poor neighborhoods, there are few non-poor, indicating high levels of polarization. Macro-scale affluence segregation is most pronounced in Oslo (which is very different from the results from Tammaru et al., Citation2015), followed by Brussels, Copenhagen, Stockholm and Amsterdam.
We have suggested that a combination of welfare regimes, housing market systems, area-based policies, migration dynamics and preferences all influence patterns of socio-economic segregation, and that the country- and city-specific histories and circumstances matter in explaining spatial patterns of poverty and affluence. For Brussels, we expected quite high levels of socioeconomic segregation, based on patterns of social inequality, a small share of social housing, limited area-based interventions, high levels of ethnic segregation, as well as long-term territorial processes that have produced a divided city, with little evidence of declining segregation. Indeed, we find that macro-scale poverty is widespread in Brussels, with levels of poverty segregation double that of Oslo and Copenhagen and triple that of Amsterdam. The high poverty concentration indicates strong geographical polarization with little sign of mixing with high income groups, especially in the centrally located “poor croissant”, the 19th century industrial belt around the historical city center. The clear duality between densely populated poor zones in the center and vast affluent zones in the periphery explains why segregation in Brussels is a particularly large-scale phenomenon.
We expected similarly high levels of socioeconomic segregation in Stockholm, compared to Brussels. In Stockholm, the Swedish universal welfare state may be associated with lower social inequality, but a limited social housing sector combined with a very hard to access housing market for newcomers, may drive newly arrived immigrants and low-income groups to multifamily housing in the suburbs. This, combined with non-effective area-based interventions and large migration flows that have intensified ethnic segregation processes, led us to expect that overall levels of socioeconomic segregation would be relatively high. Indeed, macro-level socioeconomic segregation is relatively high in Stockholm, though slightly lower than in Brussels. The maps evidence the large number of high poverty areas, reflected in high levels of micro-scale poverty segregation, especially in the northwest and the southwest, with a few spatial outliers. Segregation by affluence is relatively high as well, particularly at lower scale levels; with the most affluent areas, where very few poor people reside, mostly being located in the northeast and the west of the city.
For Oslo, we had mixed expectations. Persistent geographical patterns of poverty in the east and affluence in the west of the city, due to historical territorial and housing processes, in combination with a context of predominant home ownership and a very small public housing sector, would imply relatively high levels of socioeconomic segregation; whereas the universalistic welfare state, some successful area-based interventions, and relatively low levels of ethnic segregation may be associated with lower levels of socioeconomic segregation. What we find is that macro-scale affluence segregation in Oslo is the highest for the five capitals in this study, while large-scale poverty segregation is relatively lower. This is reflected in the maps, showing that high poverty areas are relatively dispersed, while the geographical patterns of affluence show large-scale concentrations in the southwest and west of Oslo, sometimes called the “golden ghettos” (Ljunggren, Citation2017).
Based on the mechanisms that are supposed to cause higher socioeconomic segregation, we expected the lowest levels for Copenhagen. Here, social inequalities are relatively low, and the city has a large social housing sector, while Denmark as a whole has experienced modest migration flows, and quite low levels of ethnic segregation. Indeed, poverty segregation is relatively low, with some areas with higher concentrations in central neighborhoods and the southwest, while segregation by affluence is high for Copenhagen at all scale levels. The substantial macro-scale affluence segregation is probably due to the fact that many of the rich neighborhoods are located in an extensive homogeneous area north of the city, near the coast.
Finally, the expectations for Amsterdam were mixed, with lower levels of socioeconomic segregation expected based on the extensive social housing sector and positive effects of area interventions and housing policies, but higher levels expected due to generally high levels of ethnic segregation, relatively high social inequality, and the liberal nature of the welfare state. Our results indicate that levels of both macro-scale poverty and affluence segregation are among the lowest for Amsterdam, in comparison with the other capitals. Poverty segregation is much lower compared to, for instance, Brussels, which is equally densely populated. Affluence segregation, though much higher than poverty segregation, is relatively low as well, though at the smallest scales, we see a large number of high income segregation pockets across the city, including some in the central city, which makes this a particularity for Amsterdam.
The paper has used three different methods to study the spatial distribution of socio-economic segregation, namely the dissimilarity index (DI), percentile plots and location quotients. The latter are seldom used in segregation studies, but as they are suitable for comparisons across time and contexts, they are a promising method to spatial segregation studies (see Van Ham et al., Citation2021a). Each of these methods revealed different aspects of segregation in all five cities; levels, distributions and geographical patterns at different scales. What these results clearly show is that segregation should be examined using a multitude of indices and scales, including explicitly geographical indicators. Segregation levels, the geographical patterns of segregation, the distribution of neighborhoods as well as the scale of urban segregation are affected by a wide array of factors, including idiosyncratic, historical and contextual processes that may vary widely across cities. Just as no single model or theory alone can adequately explain differences in segregation patterns between contexts, no single tool or single scale can capture the many nuanced details that characterize urban residential segregation. In our view, this also implies that progress in understanding segregation processes cannot be made without measures that capture differences between urban areas in a reliable way. The approach presented in this paper provides robust descriptive results that can serve as an inspiration for both theory building and for the testing of hypotheses.
Even though we attempted to include income measures that were based on general standards, and to a very large extent were similar and therefore comparable between the capital cities, some methodological limitations remain. The poverty indicator is based on individual income; as household income or wealth was not available for all countries. Small differences in the definitions of poverty and affluence may affect some of the small-scale geographical patterns. We have not been able to control for social benefits, which may have led to some local anomalies such as in the Bijlmermeer in Amsterdam. In Brussels, non-working spouses and international workers are not included in the income data. In all of the cities, levels of poverty may be affected by high shares of non- or part-time working individuals, particularly women, in otherwise affluent households, individuals with high wealth and low incomes, or retirees.
Further research will hopefully be able to use similar data to reexamine the theories that explain segregation patterns, to study neighborhood effects on individual outcomes in a comparative perspective, and to assess effects of different policy interventions.
Acknowledgments
We thank Henning Christiansen at Statistics Denmark for the Danish data preparation, Helga de Valk and Joeke van Kuyvenhoven for useful comments, and the anonymous reviewers for comments and suggestions that have greatly improved our work.
Disclosure statement
No potential conflict of interest was reported by the author(s).
Additional information
Funding
Notes
1. Although Brussels did not figure in the comparison, it is plausible to assume that segregation levels of poor households based on similar data would have been high as well, as Belgian cities have very similar segregation patterns (see Costa & De Valk, Citation2018)
2. In contrast to the technical report (Nielsen et al., Citation2017), the Swedish data used to construct the poverty indicator is measured at individual and not household level.
3. Tax returns in Belgium include all null income declarations. These produce a bias in income data because international workers do not pay taxes in Belgium, and falsely appear as being poor. In order to address this bias, we excluded null incomes from the data. The change mostly leaves out wealthy international workers and non-working spouses, and not poor households. This is because households that depend on social assistance do not appear as having null income in tax returns. The exclusion of international workers is not ideal because they obviously participate in the spatial distribution of poverty and affluence in Brussels. However, our tests have shown that the data is consistent and suitable for our purposes in this article. Furthermore, we can assume that neighborhoods that cluster wealthy international workers also cluster wealthy domestic workers. More details on this issue are available upon request.
4. As explained, neighborhoods were constructed by expanding geographical buffers around grids; however, we can consider that each inhabitant of a grid has their own individualized neighborhood.
5. Thresholds based on a difference of one standard deviation, namely 1.2 for a significant concentration/segregation of subgroups and 0.85 for a significant under-representation, are used in the literature (Brown & Chung, Citation2006; Brown et al., Citation1996), but depend on specific distributions.
6. The age groups for measuring segregation of the poor and the affluent are slightly different, which may mean the indices are not strictly comparable.
References
- Abramsson, Marianne, & Borgegård, Lars-Erik. (1998). Changing welfare states and social housing: Consequences for spatial segregation – Reviewed. Scandinavian Housing and Planning Research, 15(3), 149–173. https://doi.org/10.1080/02815739808730453
- Andersen, Hans Skifter, Andersen, Hans Thor., & Ærø, Thorkild. (2000). Social polarisation in a segmented housing market: Social segregation in greater Copenhagen. Geografisk Tidsskrift-Danish Journal of Geography,100(1), 71–83. https://doi.org/10.1080/00167223.2000.10649440
- Andersen, Hans Skifter, Andersson, Roger, Wessel, Terje, & Vilkama, Katja. (2016). The impact of housing policies and housing markets on ethnic spatial segregation: Comparing the capital cities of four Nordic welfare states. International Journal of Housing Policy,16(1), 1–30. https://doi.org/10.1080/14616718.2015.1110375
- Andersen, Hans Skifter. (2002). Excluded places: The interaction between segregation, urban decay and deprived neighbourhoods. Housing, Theory and Society, 19(3–4), 153–169. https://doi.org/10.1080/140360902321122860
- Andersson, Eva K., Lyngstad, Torkild H., & Sleutjes, Bart. (2018). Comparing patterns of segregation in North-Western Europe: A multiscalar approach. European Journal of Population, 34(2), 151–168. https://doi.org/10.1007/s10680-018-9477-1
- Andersson, Eva K., & Malmberg, Bo. (2015). Contextual effects on educational attainment in individualised, scalable neighbourhoods: Differences across gender and social class. Urban Studies, 52(12), 2117–2133. https://doi.org/10.1177/0042098014542487
- Andersson, Eva K., Malmberg, Bo, Costa, Rafael, Sleutjes, Bart, Stonawski, Marcin J., De, Valk, & Helga, A. G. (2018). A comparative study of segregation patterns in Belgium, Denmark, the Netherlands and Sweden: Neighbourhood concentration and representation of non-European migrants. European Journal of Population, 34(2), 251–275. https://doi.org/10.1007/s10680-018-9481-5
- Andersson, Eva. (2004). From valley of sadness to hill of happiness: The significance of surroundings for socioeconomic career. Urban Studies, 41(3), 641–659. https://doi.org/10.1080/0042098042000178726
- Andersson, Roger, & Kährik, Anneli. (2015). Widening gaps. Segregation dynamics during two decades of economic and institutional change in Stockholm. In Tiit Tammaru, Szymon Marcinczak, Maarten Van Ham, & Sako Musterd (Eds.), Socio-economic segregation in European capital cities: East meets west (pp. 112–128). Routledge.
- Andersson, Roger, & Bråmå, Åsa. (2018). The Stockholm estates—A tale of the importance of initial conditions, macroeconomic dependencies, tenure and immigration. In Daniel Baldwin Hess, Tiit Tammaru, & Maarten van Ham (Eds.), Housing estates in Europe: Poverty, ethnic segregation and policy challengespp. 361–387. Springer.
- Andersson, Roger, Bråmå, Åsa, & Holmqvist, Emma. (2010). Counteracting segregation: Swedish policies and experiences. Housing Studies, 25(2), 237–256. https://doi.org/10.1080/02673030903561859
- Andersson, Roger, & Turner, Lena Magnusson. (2014). Segregation, gentrification, and residualisation: From public housing to market-driven housing allocation in inner city Stockholm. International Journal of Housing Policy, 14(1), 3–29. https://doi.org/10.1080/14616718.2013.872949
- Arbaci, Sonia. (2007). Ethnic segregation, housing systems and welfare regimes in Europe. International Journal of Housing Policy, 7(4), 401–433. https://doi.org/10.1080/14616710701650443
- Bergsten, Zara, & Holmqvist, Emma. (2013). Possibilities of building a mixed city – Evidence from Swedish cities. International Journal of Housing Policy, 13(3), 288–311. https://doi.org/10.1080/14616718.2013.809211
- Bolt, Gideon. (2009). Combating residential segregation of ethnic minorities in European cities. Journal of Housing and the Built Environment, 24(4), 397–405. https://doi.org/10.1007/s10901-009-9163-z
- Boterman, Willem R., Musterd, Sako, & Manting, Dorien. (2020). Multiple dimensions of residential segregation. The case of the metropolitan area of Amsterdam. Urban Geography42(4), 481–506.. https://doi.org/10.1080/02723638.2020.1724439
- Bråmå, Åsa. (2006). White flight? The production and reproduction of immigrant concentration areas in Swedish cities. Urban Studies, 43(7), 1127–1146. https://doi.org/10.1080/00420980500406736
- Brattbakk, Ingar, & Hansen, Thorbjørn. (2004). Post-war large housing estates in Norway: Well-kept residential areas still stigmatised? Journal of Housing and the Built Environment, 19(3), 311–332. https://doi.org/10.1007/s10901-004-0697-9
- Brown, Lawrence A., & Chung, Su-Yeul. (2006). Spatial segregation, segregation indices and the geographical perspective. Population, Space and Place, 12(2), 125–143. https://doi.org/10.1002/psp.403
- Brown, Lawrence A., Lobao, Linda M., & Verheyen, Anthony L. (1996). Continuity and change in an old industrial region. Growth and Change, 27(2), 175–205. https://doi.org/10.1111/j.1468-2257.1996.tb00902.x
- Cassiers, Tim, & Kesteloot, Christian. (2012). Socio-spatial inequalities and social cohesion in European cities. Urban Studies, 49(9), 1909–1924. https://doi.org/10.1177/0042098012444888
- Chaix, Basile, Merlo, Juan, Evans, David, Leal, Cinira, & Havard, Sabrina. (2009). Neighbourhoods in eco-epidemiologic research: Delimiting personal exposure areas. A response to Riva, Gauvin, Apparicio and Brodeur. Social Science & Medicine, 69(9), 1306–1310. https://doi.org/10.1016/j.socscimed.2009.07.018
- Clark, William A. V. (2015). Residential segregation: Recent trends. International Encyclopedia of the Social and Behavioral Sciences, 20, 549–554. https://doi.org/10.1016/B978-0-08-097086-8.72134-9
- Clark, William, Andersson, Eva, Östh, John, & Malmberg, Bo. (2015). A multi-scalar analysis of neighbourhood composition in Los Angeles 2000-2010: A location based approach to segregation and diversity. Annals of the Association of American Geographers, 105(6), 1260–1284. https://doi.org/10.1080/00045608.2015.1072790
- Costa, Rafael, & De Valk, Helga A. G. (2021). Socio-spatial disparities in Brussels and its hinterland. In Maarten van Ham, Tiit Tammaru, Rūta Ubarevičienė, & Heleen Janssen (Eds.), Urban socio-economic segregation and income inequality. A global perspective (pp. 271–292). Springer.
- Costa, Rafael, & De Valk, Helga A. G. (2018). Ethnic and socioeconomic segregation in Belgium: A multiscalar approach using individualised neighbourhoods. European Journal of Population, 34(2), 225–250. https://doi.org/10.1007/s10680-018-9480-6
- De Decker, Pascal. (2008). Facets of housing and housing policies in Belgium. Journal of Housing and the Built Environment, 23(3), 155–171. https://doi.org/10.1007/s10901-008-9110-4
- Dessouroux, Christian, Bensliman, Rachida, Bernard, Nicolas, De Laet, Sarah, Demonty, François, Marissal, Pierre, & Surkyn, Johan. (2016). Housing in Brussels: Diagnosis and challenges. BSI synopsis. Brussels Studies, 99[Online]. https://doi.org/10.4000/brussels.1353
- Dujardin, Claire, Selod, Harris, & Thomas, Isabelle. (2008). Residential segregation and unemployment: The case of Brussels. Urban Studies, 45(1), 89–113. https://doi.org/10.1177/0042098007085103
- Duncan, Otis D., & Duncan, Beverly. (1955). A methodological analysis of segregation indexes. American Sociological Review, 20(2), 210–217. https://doi.org/10.2307/2088328
- Fisher, Claude S., Stockmayer, Gretchen, Stiles, J., & Hout, Michael. (2004). Distinguishing the geographical levels and social dimensions of US metropolitan segregation, 1960-2000. Demography, 41(1), 37–59. https://doi.org/10.1353/dem.2004.0002
- Fowler, Christopher S. (2016). Segregation as a multiscalar phenomenon and its implications for neighborhood-scale research: The case of South Seattle 1990-2010. Urban Geography, 37(1), 1–25. https://doi.org/10.1080/02723638.2015.1043775
- Galster, George. (2007). Should policy makers strive for neighborhood social mix? An analysis of the Western European evidence base. Housing Studies, 22(4), 523–545. https://doi.org/10.1080/02673030701387630
- Globalization and World Cities Research Network. (2012). The world according to GaWK 2012. Retrieved December 10, 2018, From https://www.lboro.ac.uk/gawc/world2012.html.
- Hennerdal, Pontus, & Nielsen, Michael M. (2017). A multiscalar approach for identifying clusters and segregation patterns that avoids the modifiable areal unit problem. Annals of the American Association of Geographers, 107(3), 555–574. https://doi.org/10.1080/24694452.2016.1261685
- Hess, Daniel Baldwin, Tammaru, Tiit, & Van Ham, Maarten. (2018). Housing estates in Europe: Poverty, ethnic segregation and policy challenges. Springer.
- Hochstenbach, Cody, & Van Gent, Wouter P. C. (2015). An anatomy of gentrification processes: Variegating causes of neighbourhood change. Environment and Planning A, 47(7), 1480–1501. https://doi.org/10.1177/0308518X15595771
- Jones, Kelvyn, Johnston, Ron, Manley, David, Owen, Dewi, & Charlton, Chris. (2015). Ethnic residential segregation: A multilevel, multigroup, multiscale approach exemplified by London in 2011. Demography, 52(6), 1995–2019. https://doi.org/10.1007/s13524-015-0430-1
- Kleinhans, Reinout. (2004). Social implications of housing diversification in urban renewal: A review of recent literature. Journal of Housing and the Built Environment, 19(4), 367–390. https://doi.org/10.1007/s10901-004-3041-5
- Kühn, Manfred. (2015). Peripheralization: Theoretical concepts explaining socio-spatial inequalities. European Planning Studies, 23(2), 367–378. https://doi.org/10.1080/09654313.2013.862518
- Lichter, Daniel T., Parisi, Domenico, & Taquino, Michael C. (2015). Toward a new macro-segregation? Decomposing segregation within and between metropolitan cities and suburbs. American Sociological Review, 80(4), 843–873. https://doi.org/10.1177/0003122415588558
- Ljunggren, Jørn (Ed.). (2017). Oslo - ulikhetenes by [Oslo - the city of differences]. Cappelen Damm Akademisk.
- Malmberg, Bo, Andersson, Eva K., Nielsen, Michael M., & Haandrikman, Karen. (2018). Residential segregation of European and non-European migrants in Sweden: 1990-2012. European Journal of Population, 34(2), 169–193. http://doi.org/10.1007/s10680-018-9478-0
- Malmberg, Bo, Andersson, Eva K., & Östh, John. (2013). Segregation and urban unrest in Sweden. Urban Geography, 34(7), 1031–1046. https://doi.org/10.1080/02723638.2013.799370
- Marcińczak, Szymon, Musterd, Sako, Van Ham, Maarten, & Tammaru, Tiit. (2015). Inequality and rising levels of socio-economic segregation: Lessons from a pan-European comparative study. In Tiit Tammaru, Szymon Marcinczak, Maarten Van Ham, & Sako Musterd (Eds.), Socio-economic segregation in European capital cities: East meets west (pp. 358–382). Routledge.
- Marcuse, Peter. (1997). The enclave, the citadel, and the ghetto: What has changed in the post-Fordist US city. Urban Affairs Review, 33(2), 228–264. https://doi.org/10.1177/107808749703300206
- Massey, Douglas S., & Denton, Nancy A. (1988). The dimensions of residential segregation. Social Forces, 67(2), 281–315. https://doi.org/10.2307/2579183
- Musterd, Sako. (2005). Social and ethnic segregation in Europe: Levels, causes and effects. Journal of Urban Affairs, 27(3), 331–348. https://doi.org/10.1111/j.0735-2166.2005.00239.x
- Musterd, Sako, & Van Gent, Wouter. (2015). Changing welfare context and income segregation in Amsterdam and its metropolitan area. In Tiit Tammaru, Szymon Marcinczak, Maarten Van Ham, & Sako Musterd (Eds.), Socio-economic segregation in European capital cities: East meets west (pp. 66–85). Routledge.
- Musterd, Sako, Marcińczak, Szymon, Van Ham, Maarten, & Tammaru, Tiit. (2017). Socioeconomic segregation in European capital cities. Increasing separation between poor and rich. Urban Geography, 38(7), 1062–1083. https://doi.org/10.1080/02723638.2016.1228371
- Myhre, Jan E. (2017). Oslos historie som delt by [Oslo’s history as a divided city]. In Jørn Ljunggren (Ed.), Oslo - ulikhetenes by (pp. 31–56). Cappelen Damm Akademisk.
- Nielsen, Michael M., Haandrikman, Karen, Christiansen, Henning, Costa, Rafael, Sleutjes, Bart, Rogne, Adrian F., & Stonawski, Marcin J. (2017). Residential segregation in 5 European countries: Technical report. ResSegr Working Paper 2017: 2. Stockholm University.
- Nielsen, Michael M., & Hennerdal, Pontus. (2017). Changes in the residential segregation of immigrants in Sweden from 1990 to 2012: Using a multi-scalar segregation measure that accounts for the modifiable areal unit problem. Applied Geography, 87, 73–84. https://doi.org/10.1016/j.apgeog.2017.08.004
- Olteanu, Madalina, Randon-Furling, Julien, & Clark, William A. V. (2019). Segregation through the multiscalar lens. Proceedings of the National Academy of Sciences, 116(25), 12250–12254. https://doi.org/10.1073/pnas.1900192116
- Olzak, Susan, Shanahan, Suzanne, & McEneaney, Elizabeth H. (1996). Poverty, segregation, and race riots: 1960 to 1993. American Sociological Review, 61(4), 590–613. https://doi.org/10.2307/2096395
- Openshaw, Stan. (1984). The modifiable areal unit problem. Concepts and techniques in modern geography (Vol. 38). GeoBooks.
- Östh, John, Malmberg, Bo, & Andersson, Eva. (2014). Analysing segregation with individualized neighbourhoods defined by population size. In Christopher D. Lloyd, Ian G. Shuttleworth, & David W. Wong (Eds.), Social-spatial segregation: Concepts, processes and outcomes (pp. 135–161). Policy Press.
- Östh, John, Clark, William A. V, & Malmberg, Bo. (2015). Measuring the scale of segregation using k-nearest neighbor aggregates. Geographical Analysis, 47(1), 1–16. https://doi.org/10.1111/gean.12053
- Park, Robert E. (1926). The concept of position in sociology. Papers and Proceedings of the American Sociological Society, 20, 1–14.
- Petrović, Ana, David, Manley, & Van Ham, Maarten. (2021). Multiscale contextual poverty in the Netherlands: Within and between-municipality inequality. Applied Spatial Analysis and Policy. https://doi.org/10.1007/s12061-021-09394-3
- Reardon, Sean F., & Bischoff, Kendra. (2011). Income inequality and income segregation. American Journal of Sociology, 116(4), 1092–1153. https://doi.org/10.1086/657114
- Reardon, Sean F., Farrell, Chad R., Matthews, Stephen A., O’Sullivan, David, Bischoff, Kendra, & Firebaugh, Glenn. (2009). Race and space in the 1990s: Changes in the geographic scale of racial residential segregation, 1990–2000. Social Science Research, 38(1), 55–70. https://doi.org/10.1016/j.ssresearch.2008.10.002
- Reardon, Sean F., Matthews, Stephen A., O’Sullivan, David, Lee, Barrett A., Firebaugh, Glenn, Farrell, Chad R, & Bischoff, Kendra. (2008). The geographic scale of metropolitan racial segregation. Demography, 45(3), 489–514. https://doi.org/10.1353/dem.0.0019
- Rogne, Adrian F. (2018). Ethnic segregation, economic segregation and the ‘second generation’. The moving patterns of the descendants of non-western immigrants in Oslo. ResSegr Working Paper 2018:1. Stockholm: Stockholm University.
- Rogne, Adrian F., Andersson, Eva K., Malmberg, Bo, & Lyngstad, Torkild H. (2019). Neighbourhood concentration and representation of non-European migrants. New results from Norway. European Journal of Population,36(1), 71–83. https://doi.org/10.1007/s10680-019-09522-3
- Rokem, Jonathan, & Vaughan, Laura. (2019). Geographies of ethnic segregation in Stockholm: The role of mobility and co-presence in shaping the ‘diverse’ city. Urban Studies, 56(12), 2426–2446. https://doi.org/10.1177/0042098018795561
- Romainville, Alice. (2010). Who benefits from home ownership support policies in Brussels? Brussels Studies, 34 [Online]. https://doi.org/10.4000/brussels.742
- Sassen, Saskia. (2001). The global city: New York, London, Tokyo (2nd ed.). Princeton University Press.
- Shuttleworth, Ian, & Lloyd, Christopher D. (2009). Are Northern Ireland’s communities dividing? Evidence from geographically consistent population data 1971-2001. Environment and Planning A, 41(1), 213–229. https://doi.org/10.1068/a40163
- Skovgaard, Nielsen, Rikke. (2017). The potentials of a strong social housing sector: The case of Turks and Somalis in the Copenhagen housing market. Housing, Theory and Society, 34(4), 458–476. https://doi.org/10.1080/14036096.2016.1274678
- Sleutjes, Bart, De Valk, Helga A. G, & Ooijevaar, Jeroen. (2018). The measurement of ethnic segregation in the Netherlands: Differences between administrative and individualized neighbourhoods. European Journal of Population, 34(2), 195–224. https://doi.org/10.1007/s10680-018-9479-z
- Sleutjes, Bart, Ooijevaar, Jeroen, & De Valk, Helga A. G. (2019). Residential segregation in the Amsterdam metropolitan region: A longitudinal analysis using scalable individualised neighbourhoods. Tijdschrift voor Economische en Sociale Geografie, 110(3), 359–377. https://doi.org/10.1111/tesg.12356
- Statistics Netherlands. (2011). StatLine, statistical database. Retrieved26 April 2016, from http://statline.cbs.nl
- Statistics Sweden (2020). Total income from employment and business 2000 and 2016–2018, by municipality. Median values in 2018 prices [web page]. Retrieved 12 August 2020, from www.scb.se/en/finding-statistics/statistics-by-subject-area/household-finances/income-and-income-distribution/income-and-tax-statistics/pong/tables-and-graphs/income–persons-counties-and-municipalities/total-income-from-employment-and-business-2000-and-20162018-2018-preliminary-by-municipality.-median-values-in-2018-prices/
- Tammaru, Tiit, Marcińczak, Szymon, Van Ham, Maarten, & Musterd, Sako. (2015). Socio-economic segregation in European capital cities: East meets west. Routledge.
- Toft, Maren. (2018). Enduring contexts: Segregation by affluence throughout the life course. The Sociological Review, 66(3), 645–664. https://doi.org/10.1177/0038026117741051
- Uitermark, Justus. (2003). Social mixing’ and the management of disadvantaged neighbourhoods: The Dutch policy of urban restructuring revisited. Urban Studies, 40(3), 531–549. https://doi.org/10.1080/0042098032000053905
- Van Ham, Maarten, Tammaru, Tiit, Ubarevičienė, Rūta, & Janssen, Heleen. (2021b). Rising inequalities and a changing social geography of cities. An introduction to the global segregation book. In Maarten Van Ham, Tiit Tammaru, Rūta Ubarevičienė, & Heleen Janssen (Eds.), Urban socio-economic segregation and income inequality. A global perspective (pp. 3–26). Springer.
- Van Ham, Maarten, & Manley, David. (2009). Social housing allocation, choice and neighbourhood ethnic mix in England. Journal of Housing and the Built Environment, 24(4), 407–422. https://doi.org/10.1007/s10901-009-9158-9
- Van Ham, Maarten, Tammaru, Tiit, Ubarevičienė, Rūta, & Janssen, Heleen. (2021a). Urban socio-economic segregation and income inequality: A global perspective. Springer.
- Veneri, Paolo, Comandon, Andre, Garcia-López, Miquel-Àngel, & Daams, Michiel N. (2020). What do divided cities have in common? An international comparison of income segregation. Journal of Regional Science,61(1), 162–188. https://doi.org/10.1111/jors.12506
- Vogiazides, Louisa. (2018). Exiting distressed neighbourhoods: The timing of spatial assimilation among international migrants in Sweden. Population, Space and Place, 24(8), e2169. https://doi.org/10.1002/psp.2169
- Vogiazides, Louisa, & Chihaya da Silva, Guilherme K. (2019). Migrants’ long-term residential trajectories in Sweden: Persistent neighbourhood deprivation or spatial assimilation? Housing Studies, 35(5), 875–902. https://doi.org/10.1080/02673037.2019.1636937
- Wessel, Terje. (2015). Economic segregation in Oslo. Polarisation as a contingent outcome. In Titt Tammaru, Szymon Marcińczak, Maarten Van Ham, & Sako Musterd (Eds.), Socio-economic segregation in European capital cities: East meets west (pp. 129–148). Routledge.
- Wessel, Terje. (2017). Det todelte Oslo - etniske minoriteter I øst og vest [Oslo in two parts - ethnic minorities in the east and west]. In J. Ljunggren (Ed.), Oslo - ulikhetenes by (pp. 81–104). Cappelen Damm Akademisk.
- Wong, David W. S. (2004). Comparing traditional and spatial segregation measures: A spatial scale perspective. Urban Geography, 25(1), 66–82. https://doi.org/10.2747/0272-3638.25.1.66
- Zorlu, Aslan, & Latten, Jan. (2009). Ethnic sorting in the Netherlands. Urban Studies, 46(9), 1899–1923. https://doi.org/10.1177/0042098009106023