
 ?Mathematical formulae have been encoded as MathML and are displayed in this HTML version using MathJax in order to improve their display. Uncheck the box to turn MathJax off. This feature requires Javascript. Click on a formula to zoom.
ABSTRACT
This 20-month study of a prairie hillslope seep system builds upon and extends the soil moisture record from a previous study conducted during the most extreme drought ever recorded in Texas. We seek to improve understanding of how prolonged drought impacts seep-headwater hydrology, and to determine how well dominant vegetation reflects changes in volumetric soil moisture (θv). Results show the entire hillslope saturates after storm events, but due to severe drought, no surface runoff or channel flow was recorded. We documented changes in soil moisture, with the highest θv occurring along the deeper footslope soils. We hypothesize hyperseasonal environments, or seasonal waterlogging/desiccation of upland vegetation in poorly drained soils, exist in the study area and are the first to quantify hyperseasonality, or % change in magnitude of θv throughout a hydrologic year. The seep and riparian plots aligned with lower hyperseasonality, indicating seasonal hypoxia, but not complete desiccation. High hyperseasonality occurred along the midslope barrens, indicative of a true hyperseasonal environment. We suggest a ≥ 90% threshold would likely indicate true hyperseasonal cyclicity of anaerobic and xeric regimes. Our results provide insight to how extreme drought impacts seep-headwater systems, and how predicted hotter, drier conditions may alter their hydrologic regime.
Introduction
Headwater streams provide fundamental connectivity between uplands and higher order channels. They are critical for landscape morphology and ecosystem functioning (Costigan et al., Citation2015; Dodds et al., Citation2004; Hack & Goodlett, Citation1960), and provide valuable ecosystem services in a variety of chemical, physical, and biological contexts (Doyle et al., Citation2002; Levick et al., Citation2008; Llado & Slattery, Citation2015; Swadek & Burgess, Citation2012). Headwaters are often associated with features such as seeps, springs, and riparian wetlands that provide inflow from precipitation, surface runoff, and groundwater (Alexander et al., Citation2007). Although these first- and second-order channels comprise roughly 70% of the total channel length across a landscape, they are often undervalued and vulnerable to significant alteration from land use change (Wohl, Citation2017).
Within grassland prairie ecosystems, the beginnings of headwater streams typically form at the convergence of hillslopes that lack riparian woodland canopies and constantly fluctuate between flooding and drying (Dodds et al., Citation2004). Hillslope seeps, often associated with the upmost reaches of prairie headwater streams, occur along the sides of hills where distinct lateral and vertical changes in subsurface substrate cause infiltrated water to flow laterally (Libala et al., Citation2020; Vidon & Hill, Citation2004). During periods of high saturation, excess water can flow downslope toward the base of the hillslope and contribute to surface runoff within headwater channels. Although, their current extent is unknown, grassland seep-headwater systems have been characterized around the world, including in central California (McLaughlin et al., Citation2017), Spain (Arnau et al., Citation2008), the Ethiopian highlands (Alemie et al., Citation2019), the South African drylands (Grenfell et al., Citation2019), Perth, W.A. (George, Citation1992), and New Zealand (McGlynn et al., Citation2002).
Several studies on hillslope seeps have analyzed vegetation aspects (Doyle et al., Citation2002; Fermanich et al., Citation2006; Llado & Slattery, Citation2015; Morley & Calhoun, Citation2009; Swadek & Burgess, Citation2012; Taylor, Citation2010) and nutrient cycling (O’Driscoll & DeWalle, Citation2010; Verheyen et al., Citation2015). In North Texas, the earliest known description of seep environments describes muhly grass (Muhlenbergia reverchonii) growing on shallow soils that become seeps after storm events but are the driest habitats in mid-summer (Dykstheruis, Citation1946). This early observation describes the connectivity between hillslope and headwater processes based on underlying rock strata and recognizes that toeslopes form ephemeral headwater drainages (Dykstheruis, Citation1946). O’Kennon and Taylor (Citation2015) characterized the herbaceous vegetation occurring in seep communities of shallow soils over impermeable limestone bedrock and clayey marls in Texas and Oklahoma. They noted that vegetation within these seeps is often very distinctive and supports unique species adapted to wet conditions (O’Kennon & Taylor, Citation2015). Swadek and Burgess (Citation2012) examined the relationships among the vegetation, soils, and geology on cretaceous limestone in North Central Texas. In these environments, plant community structure and composition correspond to changes in geology and soil depth (Swadek & Burgess, Citation2012).
Headwater riparian zones in grassland prairie ecosystems are also heavily dependent upon the soil moisture availability, forming unique habitats that support an abundance of annual grasses and herbs. Small-scale topographic changes influence soil characteristics and moisture variability, and vegetation is often a key indicator of these changes (Ferreira et al., Citation2015). The hydrology of these riparian zones alternates between complete soil water saturation (anaerobic) soil conditions followed by a drying period to complete desiccation for days to months, followed by a re-wetting period throughout the hydrologic year (Sarmiento, Citation1984; Sarmiento & Pinillos, Citation2001). These habitats, known as hyperseasonal habitats, have been documented in the tropical savannas of Venezuela (Sarmiento, Citation1984; Sarmiento & Pinillos, Citation2001), the Great Plains (Dodds et al., Citation2004; Llado & Slattery, Citation2015), and in Tennessee and Kentucky (Taylor & Estes, Citation2012). They are influenced by water levels within the stream channel where wetland species often coexist with upland species.
Muhly seeps, appropriately named for the dominance of muhly grass, predominantly exist near headwaters where a thin, soil barrens resides over hard limestone bedrock (Llado & Slattery, Citation2015; Swadek & Burgess, Citation2012; Williams, Citation2008). Their areal extent is currently unknown. A study by Llado and Slattery (Citation2015) is the only previous study to our knowledge that conducts near-surface soil moisture measurements of a seep-barren system dominated by muhly grass in Texas. Llado and Slattery (Citation2015) monitored near-surface soil moisture content and matric potential along a hillslope transect with a Muhly seep in response to precipitation events at the onset of one of the most severe droughts ever recorded in North Texas (Nielsen-Gammon, Citation2011; NOAA National Centers for Environmental Information, State of the Climate: Drought for Annual Citation2011, 2012). They found that after precipitation events, water permeates through fractured limestone and encounters a marl layer that acts as an aquitard, causing water to flow horizontally from the hillslope (Llado & Slattery, Citation2015). The vegetation within these seep systems is often very distinctive and supports unique species adapted to wet conditions. Results indicated the seep responded rapidly to rainfall and remained at or close to saturation for five to seven days following storm events. Although Llado and Slattery (Citation2015) quantified the near-surface soil moisture regime in the seep-barren system, their study lacked a spatial analysis of moisture across the hillslope or its relationship to flow characteristics within the headwater stream.
Our study is an extension of the previous study by Llado and Slattery (Citation2015). We continued monitoring volumetric soil moisture (θv) and matric potential (ψm) in a restored prairie grassland in Fort Worth, Texas for two years (2012–2014) following one of the most extreme and widespread droughts ever recorded in Texas (Llado & Slattery, Citation2015; Nielsen-Gammon, Citation2011; NOAA National Centers for Environmental Information, State of the Climate: Drought for Annual Citation2011, 2012). This study builds upon and expands the scope of the previous study by Llado and Slattery (Citation2015) in several important ways. First, we extend the sampling of θv and ψm by 20 months, thereby giving us a total of three years of data on the hydrologic response of the hillslope-seep system. We reiterate a point made by Llado and Slattery (Citation2015) that developing a more complete understanding of soil moisture dynamics of Muhly seeps is important from a practical standpoint since they are being considered for delineation as possible isolated wetlands. Extending the temporal record allows us to assess this further. Second, by repositioning the θv and ψm probes across the slope, we provide a greater resolution to the hydrological response of not only the seep, but the colluvial toeslope next to the ephemeral channel. Thus, we were able to assess the degree of lateral hydrologic connectivity between the hillslope and ephemeral channel. Third, by measuring soil moisture across a new 0.2-hectare grid, we assess changes in soil moisture spatially across the hillslope in response to precipitation events. Finally, we surveyed vegetation during the Fall of 2012 to compare to fall hydrophytic vegetation identified in Jue’s (Citation2011) study. Warm season grasses and forbs are dominant in the southern mixed-grass prairie and have maximum growth in the summer and become dormant in the late fall. Cool-season species begin growing in the fall and have maximum growth in the spring. Thus, surveying fall vegetation coincides with the expected growing season of dominant species, including Muhly grass, in the southern mixed-grass prairie within the Great Plains ecosystem.
Given the limited knowledge on how grassland seep-headwater systems (particularly muhly systems) respond to precipitation input and interact hydrologically with hillslope and seep vegetation, topography, and soil texture properties, our paper seeks to improve understanding of the spatial and temporal dynamics of soil moisture and hydrologic connectivity between hillslopes and channels. We hypothesized that the differences in spatio-temporal characteristics of soil moisture across the entire hillslope is associated with distinctive vegetation in the seep and headwater stream and propose and test the use of an equation to define hyperseasonality as it pertains to the range of soil moisture content throughout a full hydrologic year. Theoretically, hyperseasonal environments would have substantial change in soil moisture conditions throughout the year, indicating complete saturation and complete desiccation. To understand the links between vegetation and soil moisture patterns, we monitored and quantified the seasonal vegetation-soil-hydrology interactions to provide insight into how these linkages could help future research and provide information for improved management and protection of these vulnerable grassland features.
Study site and methods
Location, topography, and soils
This study area is located along the east shore of Benbrook Lake in Tarrant County, Texas within the Grand Prairie ecoregion, a sub-component of the Great Plains ecoregion (). The Grand Prairie comprises of mid- and tall-grasses, seeps, wetlands, shortgrass barrens, and riparian river environments. The climate is humid subtropical with an average annual rainfall of 882 mm. Precipitation is bimodal, with an increase from March through June and from September through October, with two dry periods from November through February and July through August (Llado & Slattery, Citation2015; NOAA (National Oceanic and Atmospheric Administration), Citation2016; Ressel, Citation1981; Southern Regional Climate Center, Citation2016; Swadek & Burgess, Citation2012). Prior to the study, between October 2010 and July 2011, Texas experienced one of the most extreme and widespread droughts ever recorded. The 2010–2011 12-month rainfall was the driest on record, receiving less than 25% of the normal 12-month precipitation, and average temperatures greater than 2°C above normal, resulting in above average evaporation and further depletion of streamflow and reservoir levels (Nielsen-Gammon, Citation2011).
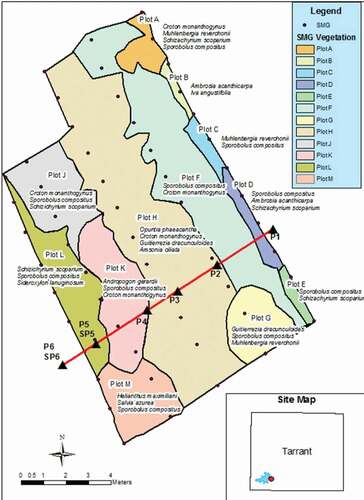
Figure 1. Location of the study site within the Clear Fork Watershed east of Lake Benbrook, TX. The hillslope transect (A to A’) and the soil moisture grid (SMG) are shown within the hillslope hollow, along with the basin soils. The profile along the transect (bottom) is adapted from Llado and Slattery (Citation2015). Red squares indicate location of coupled soil moisture (SM) and equitensiometer (EQ) probes.
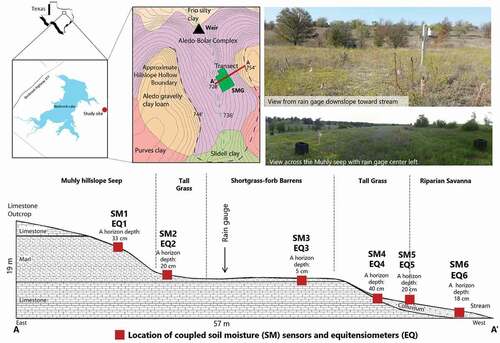
The ephemeral seep-headwater system drains into the Clear Fork Watershed of the Trinity River and is important to native plants, animals, and migratory bird species. The study area is within a restored mid- to tall-grass prairie that was formerly pastureland and rangeland; with minimal human activity on-site. A mixture of both native grassland species and introduced species are present. The headwater channel begins along the base of a hillslope comprised of thick (~40 cm) silty loam marl and clay Bolar soils, with ~20 cm of loamy thin, gravelly Aledo-Bolar clay soils formed over fragmented Duck Creek limestone at the top of the hillslope and seep environment, with a mid-slope barrens environment interspersed with thin (>10 cm) sandy clay loam (Hill, Citation1901; Ressel, Citation1981; Scott et al., Citation2003; Griffith et al., Citation2004; Omernik et al., Citation2012; Llado & Slattery, Citation2015). Further downstream, headwater riparian zones comprise of woody species. The region surrounding the study site has been significantly disturbed by past development including the construction of the dam, roads, a golf course, and encroaching neighborhoods.
Soil moisture monitoring
We used the same transect from Llado and Slattery (Citation2015) study along the eastern edge of a hillslope hollow () and placed six Delta-T SMP200 soil moisture sensors (±3% optimal range of 0–50% soil water volume) and corresponding Delta-T EQ2 matric potential equitensiometers (±2% optimal range of 0 to −100 kPa and a ± 5% optimal range of −100 to −1000 kPa) along the hillslope approximately 6 cm below the surface. We relocated the probes accordingly: 1) below the Muhly grass limestone outcrop in loamy clay where water laterally seeps (33 cm A-horizon), 2) the tall-grass marl layer (20 cm A-horizon) 3) the flat mid-slope shortgrass sandy loam limestone barrens (5 cm A-horizon), 4) the steeper tall-grass clay loam below the barrens (43 cm A-horizon), 5) the clay loam colluvial riparian toeslope (20 cm A-horizon), and 6) the clay loam colluvium along the right bank of the headwater channel (18 cm A-horizon). Three Delta-T GP1 compact data loggers recorded data from the soil moisture probes and equitensiometers at 10-minute intervals throughout the duration of the study.
We demarcated 56 points within a soil moisture grid (SMG) across the hillslope spaced five meters apart across five rows spaced 10 meters apart, extending from the edge of the Muhly seep into the riparian zone along the right bank of the headwater channel. We used the SMG to measure the spatial variability of θv across the hillslope using a Delta-T HH2 handheld moisture meter one day before, during, and several days after each precipitation event in addition to detailed, point-specific measurements along the transect to determine spatial and temporal patterns of soil moisture response to precipitation and drying across the hillslope.
Rainfall was measured using a Texas Electronics TE525 tipping bucket rain gauge at 0.01-inch increments that we converted to millimeters. We supplemented our onsite rainfall with data from the Community Collaborative Rain, Hail, and Snow Network (Community Collaborative Rain, Hail and Snow Network, Citation2014) TX-TN-57 weather station (r2 value = 0.97). We selected storms of variable intensity and duration for detailed analysis so long as each event generated precipitation greater than 10-mm or were short-duration, but high intensity.
For flow metrics, we installed a v-notch weir and pressure transducer downstream of the hillslope transect to record stage at 15-min intervals. However, due to the drought, there was no recorded flow for the duration of the study.
Vegetation survey
We surveyed vegetation during the fall, when muhly grass produces an inflorescence. The survey was adapted from the Braun-Blanquet relevé method (Braun-Blanquet, Citation1929, 1964) to describe floristic composition and vegetation structure across the hillslope using rapid delineation of the SMG to document perceivable changes in vegetative communities or topography (Poe, Citation1955). We used a handheld GPS unit to capture the locations of noticeable transitions in vegetation. Within each zone, we recorded dominant species based on height class and cover class. We defined dominant species as perennial species that covered 12.5% or greater area within each plot. Plots were grouped into associations, or the smallest unit of vegetation that reflect patterns of plant species occurrence and frequency (Jennings et al., Citation2009). Data was compared to Jue’s (Citation2011) vegetation survey data to better understand how the multi-year drought affected vegetation patterns across the hillslope.
Data analysis
We surveyed hillslope topography using a total station and used GIS to convert survey data to a slope map and created multiple continuous soil moisture surface rasters using kriging to assess the spatial variation of moisture across the SMG before, during, and after precipitation. We assessed the spatio-temporal soil response by comparing differences between the rasters. Statistical analysis of the θv and ψm along the transect was performed with Minitab 15 software.
Polygon shapefiles of the surveyed vegetation patches were laid over the SMG rasters to determine patterns between vegetation and θv. Another raster, created by using the percent change query, showed the percent change in soil moisture between the wettest (A) and driest (B) records of the study, as follows:
where B = the lowest soil moistures recorded across the hillslope and A = the highest soil moistures recorded. We considered areas with the highest variation in volumetric soil moisture content as being the most “hyperseasonal,” which is adapted from the original definition by Sarmiento (Citation1984).
Results
Rainfall, storm intensity, and streamflow conditions
shows the Southern Regional Climate Center (SRCC) monthly rainfall averages from 1971–2000, the rainfall record from Llado and Slattery (Citation2015) study, and the data from our 20-month monitoring period which is shown in bold. The 40-year historical data show an average annual rainfall as 882 mm, with two wet periods occurring in late spring and mid-fall. The rainfall totals between August 2012 and February 2013 were 50% of the typical long-term at the time of year, with January being the wettest month (83.3 mm) and November being the driest (0.5 mm).
Table 1. Monthly rainfall totals (in mm) from historic data, from Llado and Slattery (Citation2015) study, and from our study (in bold)
Ten storm events are shown in . The highest amount of precipitation occurred on 1/8/2013, with relatively consistent rainfall intensities for the duration of the storm. Two, short-duration, high-intensity storm events on 2/9/2013 and 11/5/2013 had the highest 10-min intensities but generated low rainfall totals. The 12/25/2012 was a long duration snowfall event measured in snow water equivalent with a moderate 60-min intensity. Although there was more rainfall during the 20-month study than 2010 or 2011, there was no recorded flow in the headwater stream.
Table 2. Storm intensities of different durations for significant precipitation events. * Indicates SWE
Soil moisture dynamics
Representative θv and ψm response curves spanning the series of storms from 9/29/2012 to 2/22/2013 are shown in . The median and mean θv and ψm values measured over the entire study period along the hillslope transect are shown in . Between June 2013 and September 2013, the soil moisture probes along the transect failed due to extremely low soil moisture and high temperatures.
Figure 2. Changes in θv content and ψm along the hillslope transect. (a) 9/28/2012 to 11/1/2012; (b) 12/18/2012 to 2/23/2013.
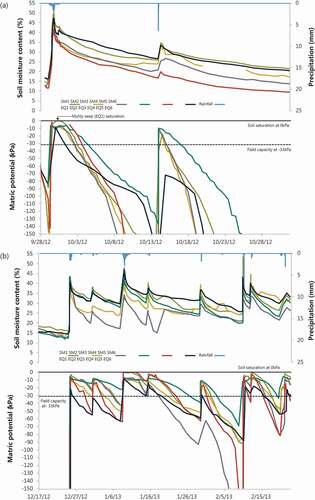
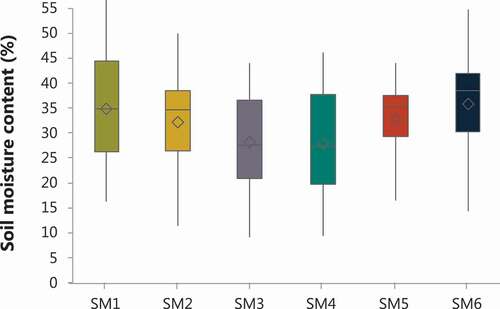
Figure 3. Box plot of volumetric soil moisture content (θv) measured during the entire study period. The diamonds within each box show the statistical mean. Statistical differences between sites was determined using the Mann-Whitney U-test.
We noted a consistent response in the soil moisture data before, during, and after the 10 precipitation events. Prior to the 09/29/2012 storm, the entire slope was exceptionally dry, with all probes recording θv < 16.5%. The Muhly seep (SM1) reached a θv content of 32% within 8 hours after the onset of rainfall, peaking at 49.5% five hours later. All equitensiometers exceeded −33kPa (field capacity, θfc) within 5.5 to 8.0 hours following the event. The Muhly seep (EquationEQ1(1)
(1) ) reached saturation (i.e., 0kPa) 9.3 hours after the midpoint of the storm (i.e., 50% of the rainfall total) and remained saturated for 12 hours following the cessation of rainfall (see arrow, ). Unfortunately, the probe at EQ5 (the tall-grass-riparian savanna boundary) failed for approximately 36 hours during the peak slope response preventing us from ascertaining whether that site fully saturated during the event. Notwithstanding, the θv data support the equitensiometer data, indicating that the Muhly seep (SM1, EquationEQ1
(1)
(1) ) is the wettest location during the storm event.
The sequence of storms from 12/25/2012 through 2/10/2013 () also showed a consistent response in θv and ψm along the hillslope transect. The Muhly seep (SM1), and the lowest sections of the colluvial toeslope (SM6), are generally the wettest during these storms, with the mid-slope, shortgrass-forb barrens (SM3), the driest. The equitensiometers confirmed that the Muhly seep (EquationEQ1(1)
(1) ) saturates more frequently than any other location along the hillslope transect and remains saturated for an average of 4.4 hours following the cessation of rainfall. The upper section of the colluvial toeslope at EQ5 also reached saturation, but only following the storm on 1/8/2013 () suggesting that water from upslope had presumably migrated downward, then laterally, through the limestone and into the colluvium at EQ5 within the tallgrass-riparian savanna boundary. This is supported by the data from EQ4, located within the tall-grass area, which consistently shows the slowest drying curve following rainfall, suggesting a delayed release of water to the lowest sections of the transect. As an example, the slope at EQ5 remained above θfc for 19 days following the onset of rainfall on 1/8/2013.
shows θv across the slope over the entire study period, with median θv values between 25.9% and 36.4%. The θv data displayed in the box plots show that mean values for all probes, except SM4, fall below the median values, indicating that the soil moisture data is skewed, reflecting the extended drought throughout the study. SM1 (the Muhly seep) and SM6 (the colluvial toeslope) have the highest overall mean θv contents and are significantly wetter than the sampling sites along the mid-slope sections of the transect. Mean θv decreases downslope from the Muhly seep into the shortgrass-forb barrens, where soils are thinnest, and then increases further downslope into the colluvium at SM5 and SM6.
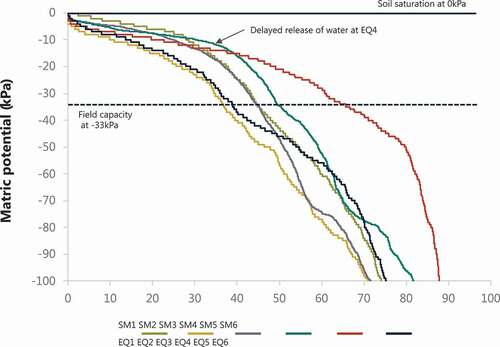
shows ψm exceedance frequency curves during the 20-month study period for all potentials up to −100 kPa. Of note is the Muhly seep (EquationEQ1(1)
(1) ), which remains saturated for 8.1% of the time (±2% optimal range) and above −10kPa for 27.8% of the time, which is consistent with results from Llado and Slattery (Citation2015). The shortgrass-forb barrens (EQ3), with its thinner soils, remain wet (i.e., between 0 and −10 kPa) for 23% of the time, but then dry out relatively rapidly and follows a recession curve that mimics the Muhly seep. The delayed release of moisture from the top of the toeslope (EQ4), noted above, shows up clearly on the exceedance curve (see arrow, ), as does the accumulation of water further downslope in the colluvium (EQ5) which remains above −33kPa for 62.3% of the time.
Figure 4. Matric potential (ψm) exceedance curves derived from equitensiomer data along the experimental hillslope transect for the 20-month study period. Field capacity (−33kPa) is represented by the dashed line.
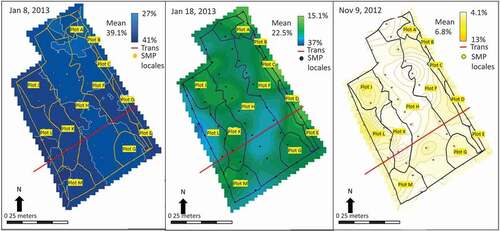
For the duration of the study, the SMG had a range in θv integrated across the hillslope of 6.8% to 39.1%. The mean θv was lowest in November 2012 and was highest in January 2013, with the barrens showing slightly lower mean θv than the rest of the hillslope, consistent with the data shown in . This moisture trend across the hillslope is more pronounced during drying cycles following storm events. Ten days after the 1/8/2013 event, the barrens dried to θv values of 25.1% to 26%, whereas the footslope remained greater than 32%. Nineteen days after the storm event, the seep and barrens both had mean θv contents lower than 25% while the θv along the footslope remained greater than 28%.
Relationship between vegetation and soil moisture
Vegetation plots surveyed across the SMG were selected according to cover class dominance and species distinguishing plots from adjacent plots (). Plot A and D had distinct species that include little bluestem (Schizachyrium scoparium) and composite dropseed (Sporobolus compositus var. compositus). The only perennial dominant in Plots B and E was composite dropseed. Plot C, F and G occurring over the hillslope seep contained muhly grass (M. reverchonii) and other wetland species. However, during our study composite dropseed was a diagnostic species and muhly grass was not dominant in any of the plots.
Figure 5. Fall vegetative plots surveyed and labeled alphabetically across the SMG. Transect shown in red with paired moisture probes and equitensiometers. Species in each plot were selected according to cover class dominance and species distinguishing plots from adjacent plots.
Plot H, above weathered limestone with locally thin soils, was characteristic of a barrens environment, with high species richness and a total vegetative cover of 50%. Dominant species included tulip prickly pear (Opuntia phaeacantha), fringed bluestar (Amsonia ciliata), white prairie rose (Rosa foliolosa), and several annual forbs. The plot resembled herbaceous vegetation found on barrens described by Swadek and Burgess (Citation2012). Below the barrens in Plot J, diagnostic species were composite dropseed and little bluestem, but this plot deviated from the other plots due to the steep slope with exposed bedrock and fragmented colluvium. Plot K had a high presence (75% cover) of big bluestem (Andropogon gerardii). At the bottom of the hillslope, composite dropseed was dominant in both Plots L and M, which can best be described as riparian shrubland savanna.
shows the vegetation plots overlaying the SMG rasters. The vegetative patterns, when compared to θv, appear to align well with moderate θv trends across the hillslope. Plot A, Plot B, and Plot C align with fast drying contours, while the area within Plot L has the highest θv. The θv contours within Plot G show distinct drying patterns in this portion of the hillslope with the θv content slightly higher than the contours within Plot H and lower than those in Plot F. Plot K and Plot L are also distinct from adjacent plots, although some of the θv contours slightly extend outside these plots. A concentric drying pattern of the θv contours exists along the border of Plot L and Plot M, which may align with the change in vegetation along the base of the hillslope.
Figure 6. Vegetative plots overlaying (a) wettest, (b) moderate, and (c) driest SMGs. The transect is indicated by the red line. Vegetation plots correspond with Fig 6.
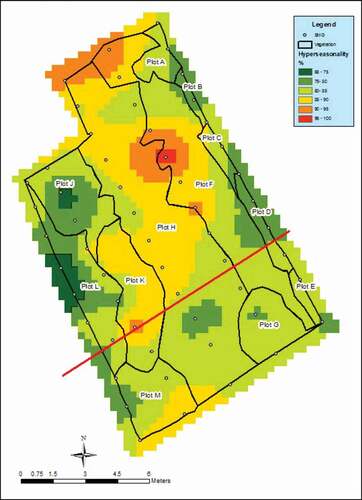
Vegetation plots were also compared to the percent hyperseasonality along the hillslope (). The hyperseasonality ranged from 65% to 100% change in soil moisture content between the highest and lowest values recorded during the study. Generally, plots determined to have high percent hyperseasonality, such as the midslope tall-grass (F) and barrens (H) plots were moderately correlated. Wetland and riparian plots (B, D, and L) had lower than 85% hyperseasonality, but seemed to align better, indicating that wetter seep and riparian vegetation along the hillslope are not as “hyperseasonal” as the midslope containing the barrens.
Figure 7. Vegetation plots over % hyperseasonality raster. The red line indicates the hillslope transect.
Discussion
Seep-headwater hydrology
In seep-headwater stream systems in prairie grassland environments, the changes in soil moisture before, during, and after storm events are a function of soil depth, vegetation response, and the topographic characteristics of the hillslope. Our study helped to better understand these relationships during extreme drought conditions, and how vegetation responds to and indicates changes in the underlying topography and soil moisture conditions.
This study was conducted during years 3 and 4 of the most severe drought ever recorded in Texas, which made data collection challenging. However, it did provide an opportunity to quantify hillslope hydrologic response during prolonged drought compared to the onset of the drought during the previous study (Llado & Slattery, Citation2015). Despite extreme dry conditions, the SMG data show almost the entire surface of the hillslope saturates following storm events, yet we did not observe any channel flow.
Our results indicate that during the drying phase, soil moisture patterns spatially align with soil depth, which correlates with the inference that soil moisture patterns during intermediate wet-dry periods is a function of soil depth and topographic characteristics of the hillslope (Tromp-van Meerveld & McDonnell, Citation2006b). Results are also consistent with Llado and Slattery (Citation2015) findings that variations of soil depth and texture affect soil moisture across the hillslope, causing the barrens to have a lower range of soil moisture than the rest of the slope due to shallow sandy loam over an impermeable clay layer. However, our results differ from previous results with the barrens having a similar drying curve to the seep above θfc, while the barrens dried the fastest during onset of the drought.
Where slope gradients were higher (EquationEQ1(1)
(1) , EQ4, and EQ5), the matric potential remained above θfc longer than sites with flatter slopes (EQ3, EQ6). A horizons on the steeper slopes are relatively thicker than other parts of the hillslope and perennial tall-grass roots are deeper, which could provide clues as to how vegetation relates to plant available soil moisture during extreme drought. Additionally, our results verified that the footslope remained relatively wetter than the rest of the hillslope after a precipitation event, indicating a concentration of water draining downslope of the barrens (Llado & Slattery, Citation2015; Tromp-van Meerveld & McDonnell, Citation2006a; Western et al., Citation2004). This is consistent with other studies that correlate topography with saturation and downslope migration of water into deeper, clay-rich soils at the footslope, but that other factors may better explain the spatial variability of soil moisture across the hillslope (Peterson et al., Citation2019; Wilson et al., Citation2004).
When compared to data from Llado and Slattery (Citation2015), our results show a similar θv drying curve along the transect; however, our results show more variability and skewness toward low θv in the interquartile range, but consistently higher means for all probes. Data from our study also indicate that ψm generally remained at or above θfc for longer for all locations along the transect than the previous study. Prior to our study, the Muhly seep remained at or above θfc for 29.4% of the time, compared to 48% of the time during our study. However, we found no evidence to suggest that the Muhly seep has a higher soil moisture content than the rest of the hillslope, or that the seep is hydrologically connected to the headwater channel. Although there was no evidence of overland flow during the monitoring period, hillslope seeps have been observed as flowpaths into headwaters in similar environments (Swadek & Burgess, Citation2012). Results from Llado and Slattery (Citation2015) indicate the seep remains hydrologically active and releases water slower than the rest of the hillslope, despite limited rainfall. It is likely that during wetter years, water is retained for longer in the loamy clay soils, drains through fractured limestone at the top of the hillslope, then seeps out laterally when infiltration is restricted by the mid-slope clay marl layer. We speculate that saturation of the seep environment is more likely influenced by local factors such as antecedent moisture conditions prior to individual storm events as well as seasonally and changes in soil texture and depth of substrate that cause a “fill and spill process” downslope (Tromp-van Meerveld & McDonnell, Citation2006a). Thus, the seep could contribute to both surface and subsurface transmissivity downslope, but additional monitoring of other factors, such as groundwater and porosity, is needed to determine factors influencing overland flow.
Below the seep, rapid drying is consistent for both studies. Interestingly, our results show a topologically controlled drying trend within the mid-slope, with EQ2 remaining above θfc ~38%, EQ3 ~ 48%, and EQ4 ~ 50% of the time. The previous study showed opposite results, where the thinnest part of the barrens remained drier than upslope (Llado & Slattery, Citation2015). We hypothesize that during wetter years, saturation within the seep flows downslope toward the channel, but there was simply not enough antecedent soil moisture during our study to cause subsurface stormflow or contribute to water table storage. This is consistent with other findings that suggest that riparian zones at the base of the hillslope respond independently from upslope zones during dry conditions, with increasing runoff generation occurring during wetter conditions when flow paths between soil water in the hillslope become connected (Llado & Slattery, Citation2015; McGlynn et al., Citation2004; McMillan & Srinivasan, Citation2015; Ocampo et al., Citation2006; Penna et al., Citation2011; Wenninger et al., Citation2004).
Hyperseasonality and vegetation response
This is the first study that we know of that attempts to quantify hyperseasonality and to provide a basis for monitoring it. Because our study was conducted during drought conditions, true hyperseasonal moisture regimes of prolonged anaerobic conditions and complete drying defined by Sarmiento (Citation1984) were not observed during the study. However, there is potential for them to exist since results show greatest hyperseasonality occurred in the barrens, which is similar to cerrado hyperseasonal environments where dryland species, such as cacti, are present but the species richness is limited by hypoxia from waterlogging and surface ponding (Amorim & Batalha, Citation2006; Llado & Slattery, Citation2015; Swadek & Burgess, Citation2012).
Areas of high hyperseasonality partially match defined vegetative plots, suggesting that other factors, such as underlying geologic and pedologic properties and boundaries, may be better predictors of hyperseasonal environments. shows hyperseasonality greater than 90% is found along the boundary of Plots F & H and Plots K & L, indicating that high hyperseasonality might be better related to plot boundaries and changes in topography. Conversely, areas with hyperseasonality less than 85% aligned better with seep and riparian plots, indicating that these environments are likely seasonal, well-drained, or retain moisture during wetter years. These results are comparable to results from Amorim and Batalha (Citation2006) that determined hyperseasonal environments were distinguished from seasonal grasslands that are well-drained, and floodplain grasslands which remain waterlogged throughout the year. However, thresholds for categorizing high and low hyperseasonality is inconclusive since the entire hillslope had a hyperseasonality greater than 65%. As mentioned previously, we would expect true hyperseasonal environments to have greater than 90% change in magnitude between the highest and lowest soil moisture values, as was found in the mid-slope environments. A 90% change in magnitude would likely account for the full hyperseasonal cycle of aerobic wetting to complete anaerobic saturation (full saturation >30%), followed by aerobic drying to complete desiccation (less than 10% soil moisture) in a hydrologic year (Jue, Citation2011), although more research is needed to determine a threshold.
Results indicate that vegetation plots best aligned with concentric drying patterns during moderate soil moisture conditions. We speculate that vegetation within the seep and headwater channel are seasonally hydrophytic in the spring and may be more closely related to changes in soil moisture regimes than fall hydrophytic vegetative communities, although hydrophytic conditions were not present during our study due to extreme drought conditions (Jue, Citation2011; Llado & Slattery, Citation2015). Previous vegetation surveying across the hillslope by Jue (Citation2011) shows that more vegetative communities meet hydrophytic criterion in the fall, but during the spring only the Muhly seep meets jurisdictional hydrologic requirements but lacked hydric soil criteria, perhaps due to the onset of extreme drought conditions (Llado & Slattery, Citation2015).
The effects of a multi-annual drought in addition to seasonal changes in temperature and precipitation seem to directly affect the antecedent soil moisture conditions and vegetative composition along the hillslope. In both Llado and Slattery (Citation2015) and our study, muhly grass in the seep, was present, but stunted, which indicates that its growth is severely limited by drought, similar to findings by Cianciaruso et al. (Citation2005). Furthermore, low species richness during periods of extreme drought may explain why species, such as composite dropseed, were dominant during our study (Cianciaruso et al., Citation2005; Sarmiento et al., Citation2004). However, additional vegetation surveying is recommended to monitor seasonal and longer term changes in species distributions and community structure in less severe and non-drought conditions.
Overall, the hyperseasonality index was somewhat useful to determine hyperseasonal moisture regimes, but more work is needed to fully understand the relationship between percent hyperseasonality and vegetative response. One possibility as to why vegetative patches did not align well to extremes in θv is that corresponding ψm above θfc or below permanent wilting points cannot be utilized by plants. Another possible factors affecting our results are that we measured ψm changes in the top 6 cm of the rooting zone, which has the highest variability in θv (Anderson & Burt, Citation1978; Bárdossy & Lehmann, Citation1998; Chorley & Beckinsale, Citation1980; Van Schaik et al., Citation2008). Another consideration is that θv contours were calculated by interpolation, and thus involves some uncertainty in their positions. Furthermore, small-scale variations of species compositions across the hillslope made it difficult to differentiate between adjacent vegetative plots, but the relevé method provides a rapid and repeatable estimate of relative species abundances from cover classes. We suggest grouping similar vegetative patches into larger zones such as the hillslope seep, mid-slope barres, tallgrass, and headwater channel that would likely align better with larger topographic and soil controls.
Conclusion
Relatively few studies have documented how changes in soil moisture under extreme drought influences and affects vegetation in prairie headwater stream and seep systems. As noted at the outset of the paper, our study was conducted a few years into one of the most severe droughts ever recorded in North Texas. Although dry conditions made data collection challenging, our study characterizes the interrelations between vegetation, soil, and hydrology in prairie headwater systems in extreme dry conditions, thus increasing our understanding of seep-headwater systems.
Our results indicate that long-term regional drought affects the distribution and conveyance of water across the hillslope and subsurface which impacted vegetative communities, infiltration and runoff downslope, and channel flow. During Llado and Slattery (Citation2015) study, ponded water was present in the muhly seep and the headwater channel. This previous study also determined the muhly seep remained saturated longer the rest of the hillslope – including the footslope – and showed a delayed release of water indicating factors, such as soil properties or an underlying perched water table, more strongly influenced seep hydrologic conditions than topography. Our results show a delayed release of water in the colluvial toeslope, indicating a shift in dominant controls, with topography becoming a stronger control of soil moisture during increasingly dry conditions at the study area. Although our results indicate that vegetative plots did not entirely reflect the underlying hydrologic conditions, vegetation can provide important clues regarding soil depth and seasonal and yearly antecedent moisture conditions. Continued and detailed investigations of the vertical distribution of soil moisture, hyperseasonal moisture regimes, and the spatial and seasonal vegetative response is important to determine how these systems may respond to predicted regional trends toward hotter and drier conditions.
Correspondingly, this study is the first to develop a metric to quantify hyperseasonal environments. Monitoring across the hillslope using a SMG and a percent change index was useful in assessing hyperseasonality. However, further investigation on why vegetation plots did not align well across the hillslope with areas of high hyperseasonality indicates the need for monitoring at different locations and timescales. Future research on vegetative communities along distinct pedologic and geologic may provide clues as to which factor(s) are the strongest predictors of hyperseasonal moisture regimes.
Jue (Citation2011) suggests Muhly seeps make up 10% of the North Central Texas Prairie. However, given the ubiquity of headwater streams in the region and ongoing mapping, we speculate that hillslope seep systems are more widespread. These seep-headwater systems are likely hydrologically connected to downstream intermittent channels during wetter years, but would likely not be delineated as jurisdictional waters of the United States during moderate to extreme drought conditions, based on the 2020 Navigable Waters Protection Rule which excludes “ephemeral features that flow only in direct response to precipitation” (USACE and EPA, 2020). Excluding these hydrologic features from jurisdictional protection could cause these features to be disturbed, buried, or eliminated by encroaching residential, commercial, and industrial development and reduce the effectiveness of critical ecosystem services they provide, such as flood mitigation, nutrients and organic matter transport, thermal regulation, and habitat for aquatic and terrestrial flora and fauna (Mazeika et al., Citation2019; Roy et al., Citation2009).
In grassland regions around the world, the loss of seep-headwater systems could result in flashier downstream flow, lower rates of groundwater recharge, and increased water supply vulnerability. Thus, prioritizing research could improve management and protection of these systems. Furthermore, the compound effects of climate change and habitat fragmentation along with conversion and burial of grassland headwaters signifies the need to monitor seasonal, annual, and interannual hydrology within these systems to develop a more complete understanding of their current hydrological functioning and effects to downstream environments. Lastly, long-term monitoring of seep-headwater systems could provide early indications of and improve planning and preparation for more sustained and potentially more severe effects to local and regional hydrology to help us better plan and prepare.
Disclosure statement
No potential conflict of interest was reported by the authors.
References
- Alemie, T. C., Tilahun, S. A., Ochoa‐Tocachi, B. F., Schmitter, P., Buytaert, W., Parlange, J. Y., & Steenhuis, T. S. (2019). Predicting shallow groundwater tables for sloping highland aquifers. Water Resources Research, 55(2019), 11088–11100. https://doi.org/https://doi.org/10.1029/2019WR025050
- Alexander, R. B., Boyer, E. W., Smith, R. A., Schwarz, G. E., & Moore, R. B. (2007). The role of headwater streams in downstream water quality. Journal of the American Water Resource Association, 43(1), 41–59. https://doi.org/https://doi.org/10.1111/j.1752-1688.2007.00005.x
- Amorim, P. K., & Batalha, M. A. (2006). Soil characteristics of a hyperseasonal cerrado compared to a seasonal cerado and a floodplain grassland: Implications for plant community structure. Brazilian Journal of Biology, 66(2), 661–670. https://doi.org/https://doi.org/10.1590/S1519-69842006000400010
- Anderson, M. G., & Burt, T. P. (1978). The role of topography in controlling throughflow generation. Earth Surface Processes and Landforms, 3(4), 331–344. https://doi.org/https://doi.org/10.1002/esp.3290030402
- Arnau, E., Calvo-Cases, A., & Boix-Fayos, C. (2008). Analysis of soil surface component patterns affecting runoff generation. An example of methods applied to Mediterranean hillslopes in Alicante (Spain). Geomorphology, 101(4), 595–606. https://doi.org/https://doi.org/10.1016/j.geomorph.2008.03.001
- Bárdossy, A., & Lehmann, W. (1998). Spatial distribution of soil moisture in a small catchment. Part 1: Geostatistical analysis. Journal of Hydrology, 206(1–2), 1–15. https://doi.org/https://doi.org/10.1016/S0022-1694(97)00152-2
- Braun-Blanquet, J. (1929, 1964). Pflanzensoziologie, Grundzfige der Vegetationskunde. 1. Aufl. Springer, Berlin 5, 330 3. Aufl (Vol. XIV). Springer.
- Chorley, R. J., & Beckinsale, R. P. (1980). G.K. Gilbert’s Geomorphology. Geological Society of America. Special Paper, 183(1980), 129–142.
- Cianciaruso, M. V., Batalha, M. A., & Aurelio da Silva, I. (2005). Seasonal variation of a hyperseasonal cerrado in Emas National Park central Brazil. Flora, 200(4), 345–353. https://doi.org/https://doi.org/10.1016/j.flora.2005.02.001
- Community Collaborative Rain, Hail and Snow Network. (2014). TX-TN-57 Station. Station Precipitation Summary. http://www.cocorahs.org/ViewData/StationPrecipSummary.aspx
- Costigan, K. H., Daniels, M. D., & Dodds, W. K. (2015). Fundamental spatial and temporal disconnections in the hydrology of an intermittent prairie headwater network. Journal of Hydrology, 522(2015), 305–316. https://doi.org/https://doi.org/10.1016/j.jhydrol.2014.12.031
- Dodds, W. K., Gido, K., Whiels, M. R., Fritz, K. M., & Matthews, W. J. (2004). Life on the edge: The ecology of Great Plains prairie streams. BioScience, 54(3), 205–218. https://doi.org/https://doi.org/10.1641/0006-3568(2004)054[0205:LOTETE]2.0.CO;2
- Doyle, G., Rocchio, J., & Culver, D. (2002). Survey of seeps and springs within the Bureau of land management’s grand junction field office management area (Mesa County, CO), report prepared for (and available from) Bureau of Land Management, Grand Junction Field Office 2815 H Road Grand Junction, CO 81506.
- Dykstheruis, E. J. (1946). The vegetation of the Fort Worth Prairie. Ecological Monographs, 16(1), 1–29. https://doi.org/https://doi.org/10.2307/1943572
- Fermanich, K., Zorn, M., Stieglitz, R., & Waltman, C. S. (2006). Mapping and characterization of springs in Brown and Calumet counties. Report to Wisconsin Department of Natural Resources, Bureau of Drinking Water and Groundwater, 76 pp.
- Ferreira, V., Panagopoulos, T., Andrad, R., Guerrero, C., & Loures, L. (2015). Spatial variability of soil properties and soil erodibility in the Alqueva reservoir watershed. Solid Earth, 6(2), 383–392. https://doi.org/https://doi.org/10.5194/se-6-383-2015
- George, R. J. (1992). Groundwater processes, sandplain seeps and interactions with regional aquifer systems in South-Western Australia. Journal of Hydrology, 134(1–4), 247–271. https://doi.org/https://doi.org/10.1016/0022-1694(92)90038-W
- Grenfell, S., Grenfell, M., Ellery, W., & Job, N. (2019). A genetic geomorphic classification system for Southern African Palustrine Wetlands: Global implications for the management of Wetlands in Drylands. Frontiers in Environmental Science, 7:174. https://doi.org/https://doi.org/10.3389/fenvs.2019.00174
- Griffith, G., Bryce, S., Omemik, J., Rogers, C. J., Harrion, A., Hatch, B., & Bezanson, D. (2004). Ecoregions of Texas Reston, Virginia: U.S. Geological Survey, scale 1:2,500,000. http://www.epa.gov/wed/pages/ecoregions/tx_eco.htm.
- Hack, J. T., & Goodlett, J. C. (1960). Geomorphology and forest ecology of a mountain region in the Central Appalachians. Washington DC: US Geological Survey. Professional paper no. 347.
- Hill, R. T. (1901). Geography and geology of the Black and Grand Prairies, Texas with detailed descriptions of the Cretaceous formations and special reference to artesian water, Washington.
- Jennings, M. J., Faber-Langendoen, D., Loucks, O. L., & Peet, R. K. (2009). Standards for associations and alliances of the U.S. National vegetation classification. Ecological Monographs, 79(2), 173–199. https://doi.org/https://doi.org/10.1890/07-1804.1
- Jue, M. (2011). Vegetative analysis of muhly hillslope seeps in North Central Texas. Master’s Thesis, Texas Christian University, 95 pp.
- Levick, L., Fonseca, J., Goodrich, D., Hernandez, M., Semmens, D., Stronberg, J., Leidy, R., Scianni, M., Guertin, D. P., Tluczek, M., & Kepner, W. (2008). The ecological and hydrological significance of ephemeral and intermittent streams in the arid and semi-arid American Southwest. U.S. Environmental Protection Agency and USDA/ARS Southwest Watershed Research Center, EPA/600/R-08/134, ARS/233046.
- Libala, N., Palmer, C. G., & Odume, O. N. (2020). Using a trait-based approach for assessing the vulnerability and resilience of hillslope seep wetland vegetation to cover disturbances in the Tsitsa River catchment, Eastern Cape, South Africa. Ecology and Evolution, 10(1), 277–291. https://doi.org/https://doi.org/10.1002/ece3.5893
- Llado, L., & Slattery, M. C. (2015). Fine scale temporal variations of surface moisture in topographically controlled Muhly grass seeps. Ecohydrology. 9(3), 371–381. https://doi.org/https://doi.org/10.1002/eco.1632
- Mazeika, S., Sullivan, P., Rains, M. C., & Rodewald, A. D. (2019). Opinion: The proposed change to definition of “waters of the United States” flouts sound science. Proceedings of the National Academy of Sciences, 116(24), 11558–11561. https://doi.org/https://doi.org/10.1073/pnas.1907489116
- McGlynn, B. L., McDonnel, J. J., & Brammer, D. D. (2002). A review of the evolving perceptual model of hillslope flowpaths at the Maimai catchments, New Zealand. Journal of Hydrology, 257(1–4), 1–26. https://doi.org/https://doi.org/10.1016/S0022-1694(01)00559-5
- McGlynn, B. L., McDonnell, J. J., Seibert, J., & Kendall, C. (2004). Scale effects on headwater catchment runoff timing, flow sources, and groundwater-streamflow relations. Water Resources Research, 40(7), W07504. https://doi.org/https://doi.org/10.1029/2003WR002494
- McLaughlin, B. C., Ackerly, D. D., Klos, P. Z., Natali, J., Dawson, T. E., & Thompson, S. E. (2017). Hydrologic refugia, plants, and climate change. Global Change Biology, Research Review, 23(8), 2941–2961. https://doi.org/https://doi.org/10.1111/gcb.13629
- McMillan, H. K., & Srinivasan, M. S. (2015). Characteristics and controls of variability in soil moisture and groundwater in a headwater catchment. Hydrology and Earth System Sciences, 19(4), 1767–1786. https://doi.org/https://doi.org/10.5194/hess-19-1767-2015
- Morley, T. R., & Calhoun, A. J. L. (2009). Vegetation characteristics of forested hillside seeps in eastern Maine, USA 1, 2. The Journal of the Torrey Botanical Society, 136(4), 520–531. https://doi.org/https://doi.org/10.3159/08-RA-073.1
- Nielsen-Gammon, J. W. (2011). The 2011 Texas drought: A briefing packet for the Texas Legislature. OSC Report: The 2011 Texas Drought. The Office of the State Climatologist. College of Geosciences, Texas A&M University, College Station. 43 pp.
- NOAA (National Oceanic and Atmospheric Administration). (2016). Dallas/Fort Worth – Monthly and annual precipitation. National Weather Service Weather Forecast Office. http://www.srh.noaa.gov/fwd/?n=dmoprecip.
- NOAA National Centers for Environmental Information, State of the Climate: Drought for Annual 2011. (2012), published online Feburary 2012. Retrieved November 28, 2017 from https://www.ncdc.noaa.gov/sotc/drought/201113.
- O’Driscoll, M. A., & DeWalle, D. R. (2010). Seeps regulate stream nitrate concentration in a forested Appalachian catchment. Journal of Environmental Quality, 39(1), 420–431. https://doi.org/https://doi.org/10.2134/jeq2009.0083
- O’Kennon, R. J., & Taylor, K. N. (2015). Cyperus Granitophilus (Cyperaceae). A granite outcrop endemic, New for Texas and Oklahoma (U.S.A.). Journal of the Botanical Research Institute of Texas, 9(1), 251–257. https://www.jstor.org/stable/24621274
- Ocampo, C. J., Sivapalan, M., & Oldham, C. (2006). Hydrological connectivity of upland-riparian zones in agricultural catchments: Implication for runoff generation and nitrate transport. Journal of Hydrology, 331(3-4), 643–658. https://doi.org/https://doi.org/10.1016/j.hydrol.2006.06.010
- Omernik, J. M., Griffith, G. E., & McGinley, M. (2012). Ecoregions of Texas (EPA). In Encyclopedia of Earth. Environmental Information Coalition, National Council for Science and the Environment. http://www.eoearth.org/article/Ecoregions_of_Texas_(EPA)
- Penna, D., Tromp-vam Merrvald, H. J., Gobbi, A., Borga, M., & Dalla Fontana, G. (2011). The influence of soil moisture on threshold runoff generation processes in an alpline headwater catchment. Hydrology and Earth System Sciences, 15(3), 689–702. https://doi.org/https://doi.org/10.5194/hess-15-689-2011
- Peterson, A. M., Helgason, W. H., & Ireson, A. M. (2019). How spatial patterns of soil moisture dynamics can explain field‐scale soil moisture variability: Observations from a sodic landscape. Water Resources Research, 55(5), 4410–4426. https://doi.org/https://doi.org/10.1029/2018WR023329
- Poe, M. E. D. (1955). The use of phytosociological methods in ecological investigations: I. The Braun-Blanquet System. Journal of Ecology, 43(1), 226–244. https://doi.org/https://doi.org/10.2307/2257132
- Ressel, D. D. (1981). Soil survey of Tarrant County. United States Department of Agriculture Soil Conservation Service in cooperation with Texas Agricultural Experiment Station.
- Roy, A. H., Dybas, A. L., Fritz, K. M., & Lubbers, H. R. (2009). Urbanization affects the extent and hydrologic permanence of headwater streams in a midwestern US metropolitan area. Freshwater Science, 29(4), 911–928. https://doi.org/https://doi.org/10.1899/08-178.1
- Sarmiento, G. (1984). The ecology of Neotropical Savannas. President and Fellows of Harvard College.
- Sarmiento, G., & Pinillos, M. (2001). Patterns and processes in a seasonally flooded tropical plain: The Apure Llanos, Venezuela. Journal of Biogeography, 28(8), 985–996. https://doi.org/https://doi.org/10.1046/j.1365-2699.2001.00601.x
- Sarmiento, G., Pinillos, M., Silva, M. P., & Acevedo, D. (2004). Effects of soil water regime and grazing on vegetation diversity and production in a hyperseasonal savanna in the Apure Llanos, Venezuela. Journal of Tropical Ecology, 20(2), 209–220. https://doi.org/https://doi.org/10.1017/S0266467403001299
- Scott, R. W., Benson, D. G., Morin, R. W., Shaffer, B. L., & Oboh-Ikuenobe, F. E. (2003). Integrated Albian-Lower Cenomanian chronostratigraphy standard, Trinity River Section. Gulf Coast Cretaceous Stratigraphy and Paleontology, Perkins Memorial Volume.
- Southern Regional Climate Center. (2016). Average precipitation in August for TX. Temperature and Precipitation Averages. http://www.srcc.lsu.edu/
- Swadek, R. K., & Burgess, T. B. (2012). The vascular flora of the North Central Texas Walnut Formation. Journal of the Botanical Research Institute of Texas, 6(2), 725–752. https://www.jstor.org/stable/41972462
- Taylor, K. N. (2010). A floristic ecology study of seasonally wet limestone cedar glades of Tennessee and Kentucky, master’s thesis, Austin Peay State University 175 pp.
- Taylor, K. N., & Estes, D. (2012). The floristic and community ecology of seasonally wet limestone glade seeps of Tennessee and Kentucky. Journal of the Botanical Research Institute of Texas, 6(2), 711–742. https://www.jstor.org/stable/41972461
- Tromp-van Meerveld, H. J., & McDonnell, J. J. (2006a). Threshold relations in subsurface stormflow: 2. The fill and spill hypothesis. Water Resource Research, 42(2), 1–11. https://doi.org/https://doi.org/10.1029/2004WR003800
- Tromp-van Meerveld, H. J., & McDonnell, J. J. (2006b). On the interrelations between topography, soil depth, soil moisture, transpiration rates and species distribution at the hillslope scale. Advances in Water Resources, 29(2), 293–310. https://doi.org/https://doi.org/10.1016/j.advwatres.2005.02.016
- USACE and EPA (US Army Corps of Engineers and US Environmental Protection Agency. (2020). The Navigable Waters Protection Rule: Definition of “Waters of the United States”. Final Rule. 85 FR 22250. 22250–22342.
- Van Schaik, N. L. M. B., Schnabel, S., & Jetten, V. G. (2008). The influence of preferential flow on hillslope hydrology in a semi-arid watershed (In the Spanish Dehesas). Hydrological Processes, 22(18), 3844–3855. https://doi.org/https://doi.org/10.1002/hyp.6998
- Verheyen, D., Gaelen, N. V., Ronchi, B., Batelaan, O., Stuyf, E., Govers, G., Merckx, R., & Diels, J. (2015). Dissolved phosphorous transport from soil to surface water in catchments with different land use. AMBIO, 44(Suppl. 2), S228–S240. https://doi.org/https://doi.org/10.1007/s13280-014-0617-5
- Vidon, P. G. F., & Hill, A. R. (2004). Landscape controls on the hydrology of stream riparian zones. Journal of Hydrology, 292(1–4), 210–228. https://doi.org/https://doi.org/10.1016/j.jhydrol.2004.01.005
- Wenninger, J., Uhlenbrook, S., Tilch, N., & Leibundgut, C. (2004). Experimental evidence of fast groundwater responses in a hillslope/floodplain area in the Black Forest Mountains, Germany. Hydrological Processes, 18(17), 3305–3322. https://doi.org/https://doi.org/10.1002/hyp.5686
- Western, A. W., Zhou, S., Grayson, R. B., McMahon, T. A., Blöschl, G., & Wilson, D. J. (2004). Spatial correlation of soil moisture in small catchments and its relationship to dominant spatial hydrological processes. Journal of Hydrology, 286(1–4), 113–134. https://doi.org/https://doi.org/10.1016/j.jhydrol.2003.09.014
- Williams, D. A. (2008). Appropriate design elements and soil selection for green roofs in North Central Texas, Master’s Thesis, Texas Christian University 65 pp.
- Wilson, D. J., Western, A. W., & Grayson, R. B. (2004). Identifying and quantifying sources of variability in temporal and spatial soil moisture observations. Water Resource Research, 40(2), W02507. https://doi.org/https://doi.org/10.1029/2003wr002306
- Wohl, E. (2017). The significance of small streams. Frontiers of Earth Science, 11(3), 447–456. https://doi.org/https://doi.org/10.1007/s11707-017-0647-y