
ABSTRACT
Spatio-temporal change detection analysis of Jamuna River using low and medium-resolution satellite data between the years of 1972 and 2013 are dynamic to assess river spatio-temporal changes and their impacts on the local settlements over the specific time. This study employs remote sensing and geographic information system (GIS) proficiencies to identify the river bank shifting, erosion, and depositional features along with the population displacement. The satellite image of LANDSAT multispectral (MSS), thematic mapper (TM), and operational land imager (OLI) and thermal infrared sensor (TIRS) were used in this study. Supervised and unsupervised classification techniques have been used to identify land cover types and detect the changes using ArcGIS Pro 2.3.2. Supervised classifications performed well by validating ≥90% overall accuracy. The result shows total erosion was 3356 ha from 1972 to 2013, while the deposition was 5342 ha. Erosion and deposition cause the bank line shifting, river widening, and settlement displacement. Hundreds of displaced people suffered from loss of land, livelihood, increased poverty, food insecurity, lack of sanitation, and drinking water facilities. Thus, this study will be earnest in assisting the environmental management and associated planning including necessary measures.
Introduction
Bangladesh has 147,570 km2, and a population of 161 million (1,237 inhabitants/km2) is a disaster-prone country (Bangladesh Statistics, Citation2018). Flood, cyclonic storms, tidal surges, droughts, earthquakes, and riverbank erosion are the common natural hazards (Baten et al., Citation2018; Etzold & Mallick, Citation2015). Riverbank erosion is a perennial problem and one of the major critical natural hazards in Bangladesh, causing riverbank line shifting and untold miseries to thousands of people along the rivers’ banks. To date, erosion alone has triggered millions of homeless and became a major social hazard. It took tolls less in lives but more in livelihood as agricultural land and other livelihood options that are displaced (Rahman & Gain, Citation2020). Riverbank erosion and the resultant geophysical and socio-economic impacts are unavoidable and often assume awful proportions, and severely affecting people. The rivers, which cover about 3.4 million hectares of land, are susceptible to widespread bank erosion (Dey, Citation2004).
On the other hand, sedimentation brings a new light of hope among the looser. The newly-formed sandbars, locally known as “char” are the mid-Channel Islands that intermittently emerge from the riverbed as sediment deposits (Islam et al., Citation2010; Schmuck, Citation2001). The rate of erosion and deposition along the river varies over time and space. It is a dualism of erosion and deposition. So, both of these have an impact to cause changes in the river by frequent channel shifting (Guchhait et al., Citation2016). This study was conducted in the Jamuna River the most vulnerable regions of Bangladesh based on detecting the river’s changes during a particular time.
The course of the Brahmaputra-Jamuna River from the international border of Bangladesh and India to the confluence with the Ganges at Aricha is hereinafter referred to as the Jamuna River (CEGIS, Citation2007). The river originated in a glacier in the Kailas Range of the Himalayas, south of the Gunkyud Lake in the southwest of Tibet, China, at 5300 m. It flows across the east-west trending ranges of the Himalayas through a deep narrow gorge before entering into the Assam plain. After traveling 700 km in the southwest direction in the Assam valley, it turned to the south again and entered Bangladesh (Mirza et al., Citation2003). Three right bank tributaries, Dudhkumar, Dharla, and Teesta meet the Jamuna river in Bangladesh. The average width of the river within Bangladesh is 11.8 km. The annual average flow measured at Bahadurabad is 20,000 m3/s with a maximum estimated discharge of 100,000 m3/s (Ferdous et al., Citation2019a). The Dynamics of the Jamuna River in Bangladesh consume several thousand hectares of floodplain annually, leaving thousands of people landless and homeless. It seizes large areas of towns, agricultural lands, villages and destroys valuable infrastructures. Jamuna also is a braided stream characterized by a network of interlacing channels with numerous sandbars enclosed in between them. The bank line shifting along with erosion and depositional activities is a critical issue in the Jamuna River.
This study aims to solve the subsequent research questions: What are the land cover types and changes in land cover from 1972 to 2013? How are the erosion and depositional activities? What is the trend of bank line shifting? What are the origin and present settlements of displaced people, and the impacts of riverbank erosion on local settlement? Change detection measures the attributes of a particular area that have changed between two or more periods. It is used to monitor any type of changes (i.e. cropland, waterbody, vegetation cover, and wetland) through time. Nowadays, it is a vital issue to recognize disaster-prone areas and their effect on the environment. Remote sensing and Geographic Information Systems (GIS) techniques are an important task of the current time that help to identify disaster-prone areas, damages, history, severity, and calculate the rate of changes (Mohamad et al., Citation2018). GIS and remote sensing-based disaster databases are crucial and significant aspects of environmental management strategy and planning. Advance remote sensing data combined with digital data exhibit specific information and accurate measurement by making interactive base maps which can be implemented for multipurpose planning and related application (Aher et al., Citation2012). This study is crucial by detecting the four decadal erosion and depositional physiognomies and trend of west bank shifting of Jamuna River using GIS and remote sensing techniques. It also suggests preventive measures for environmental management and planning.
In 2013, Rabbi et al. studied that riverbank erosion has increasingly affected people in the riverine zone of Jamuna where Sirajganj Sadar was the most erosion-prone area. Therefore, the current study focuses on an in-depth analysis of change detection of Jamuna River and its impact. The pursuals are the determinations of this research which are required to monitor the changes, investigate the erosional trends, and understand the consequences of Jamuna riverbank erosion. a) Detecting the diverse changes of the bank line of Jamuna River by identifying major land covers over four decades, b) analyzing the nature of bank line shifting, and identifying the erosional and depositional activity and their trends, and c) recognizing the population displacement to demonstrate how the changes affect the people.
Materials and methods
Study area
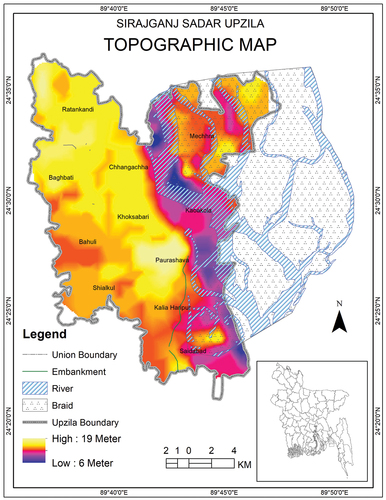
Sirajganj Sadar Upazila is a major affected area of erosion of the Jamuna river. Damage of agricultural land, settlement displacement, homelessness, and joblessness through an enormous socio-economic change and prone to vulnerabilities in this region. The potential interest, legitimate significance, a key area for protection, and obligation of the conservation of this area are the priorities behind the selection of this site. Also, the accessibility and availability of high-resolution time-series satellite data determined the selection of this study area. Sirajganj Sadar is (89°36ˊ to 89°47ˊ24ˊˊ East and 24°36ˊ36ˊˊ to 24°21ˊ South) located in Sirajganj district of Bangladesh with an area of 325.77 km2 which is vastly affected by the Jamuna River (). The total population is 389,160 (male 51.54%, female 48.46%) and the main occupation is agriculture (25.17%) (BBS, Citation2011)Citation2012. The annual average temperature reaches a maximum of 34.6°C, and a minimum of 11.9°C. The annual rainfall is 1610 mm (Islam, Citation2012).
Figure 1. Location of Sirajganj Sadar adjacent to the Jamuna river. Inset map showing the presence of the site in Bangladesh.
Acquisition and processing of data
Satellite images of LANDSAT _3 Multispectral (MSS) (November 1972 and January 1980), LANDSAT _5 Thematic Mapper (TM) (March 1993 and November 2003), and LANDSAT _ 8 The Operational Land Imager (OLI) and Thermal Infrared Sensor (TIRS) (November 2013) sensors were collected from United States of Geological Survey (USGS) for the analysis of erosion and deposition (Path 138 and Row 43) in the earth explorer website: http://earthexplorer.usgs.gov. All satellite images have been taken as cloud-free. LANDSAT _3 images consist of four bands and 60 m cell size. There are six bands for LANDSAT _5 and eight bands for LANDSAT _ 8 with a 30 m cell size. The historical flow patterns of the Jamuna River were collected from Bangladesh Water Development Board (BWDB). The average water level of Jamuna River was 3.16, 2.67, 2.82, 2.59/2.91, and 3.98 m PWD respectively in 1972, 1980, 1993, 2003, and 2013 (BWDB, Citation2013; Klaassen, Citation2013).
Images were processed using digital image processing. This was done by preprocessing, radiometric corrections/restoration, geometric transformation, image enhancement, image classification, and multitemporal analysis (Goldberg, Citation1981). Sensor irregularities and/or atmospheric noise were corrected by radiometric corrections for an accurate representation of the reflected radiation. Image enhancement included contrast stretching and spatial filtering to improve the appearance of the imagery. Geometric corrections were executed to fix the images into the UTM-46 N (Universal Transverse Mercator) projection. Images were prepared for classification and analysis after the combined processing of data from multiple spectral bands (Ali et al., Citation2012). The correction procedure involved the generation of ground control points (GCP), calculation of transformation metrics for each image to be corrected, and finally, resampling the image’s pixels using the transformation metrics.
Image analysis and ground truth
Basically, two classification algorithms (supervised and unsupervised) were applied in land use classification to obtain better accuracy. Supervised (maximum likelihood classification) classification as a part of neural network approach and unsupervised classification have both been used to identify river, char land (sandbars), settlements, vegetation, varied erosional and depositional features, and prepare maps to detect different years’ changes using ArcGIS Pro 2.3.2 (). Both supervised and unsupervised classification techniques were used to obtain more accurate classification of land cover and because of the aptitude to categorize and label classes after the classification. Supervised classification includes the categorization of pixels of undetermined identity into studied informational class (referred to as training areas) directed by the analyst by using classification algorithm with spectral characteristics (Campbell, Citation1981).
Figure 2. Methodological flowchart of supervised classification technique.
The use of neural networks to classify remotely sensed data has a wide range of applications (Davalo & Naim, Citation1991). The accuracies are likely comparable to those derived from conventional statistical classifications (Medina & Vasquez, Citation1991). A neural network may be viewed to include a comparatively large number of simple associated neurons or units that work in alike to categorize input data into desired output Classes (Hepner et al., Citation1990)
The classes are created mainly for training sample manager is being used to determining the pixels into desired class on the basis of prior studied knowledge about the area and extensive scrutiny on the satellite images. The basic advantages of this classification approach are the analyst has full control on the informational categories or classes and classification process and in selecting training areas. The analyst has full access to matching spectral classes to informational classes, and the training data can be compared with the final classification as one means of identifying major errors in the classification process (Campbell, Citation1981).
Each image of 1972, 1980, 1993, 2003, and 2013 was classified into four classes named river channel, char land, settlements, and others with assigned trained sample data. Trained sample pixels were categorized with the aptitude and knowledge and extensive study of the area. The indicator of “Classification accuracy” was set as a measure of the performance of the individual class’s classification result and that was ≥88%.
On the other hand, based on spectral information, unsupervised classification technique is being conducted. Also, it can work without extensive prior knowledge of the study area (GSP, Citation2016). Unsupervised classification is advantageous for comprehensive land cover classes to reduce analyst bias, which results in spectral classes on behalf of similar image values (Persico et al., Citation2019). Fifty preliminary classes have been generated using this method for all five images. These classes were then merged to obtain the meaningful four classes from each image through interacting and manipulating the raster attribute editor and receding module. Each image of 1972, 1980, 1993, 2003, and 2013 was classified into the river channel, char land, settlements, and others. Similar spectral classes were gathered and labeled as land use/land cover based on ground truth data. The indicator of “Classification accuracy” was set as a measure of the performance of the individual class’s classification result. Classification accuracy was ≥85%.
Efficient field knowledge is the prerequisite for the verification of the visual and digital analysis of remote sensing data. The timing of the ground truth was selected to cover real-time seasonal information on the study. The maps were subsequently verified and confirmed during the ground truth. Ground truth operation has been conducted using GPS (Global Positioning System) coordinates to validate the referenced image, authenticate existing settlement area using local FGD (Focus Group Discussion), and verify the shifting of bank line using satellite data. A total of 280 points were taken for the current bank line (), 255 points for the newly deposited area (), and 207 points taken for the settlement (). Twenty-six FGDs have been conducted to identify shifted settlements (). Stratified random sampling was used in selecting ground truth points that are proportional in number to the class area for each class (Hashemian et al., Citation2004). Kappa coefficient “κ” was used for the accuracy assessment of the classification and analysis.
Results
Land cover types and changes in land cover from 1972-2013
The prominent land cover types of Sirajganj Sadar include river and water bodies, braid (char), settlement and homestead vegetation, and other (). Agricultural land, road, water bodies, barren land, and various land are included in the category of other. Settlement and homestead vegetation include the vegetation cover in and surrounding the homestead. Since the main concern of this study is river channel, char, and settlements, the detailed classification of “other” was avoided. The river channel area is more fluctuating compared to the other categories that cause the other land classes to fluctuate.
Figure 3. Land cover types and land-use changes of Sirajganj Sadar in the years of 1972, 1980, 1993, 2003, and 2013 using unsupervised classification technique. The cyan color representing the river courses, the brick color showing the existence of settlement and homestead vegetation, and the gray color stands for the char land in the area.
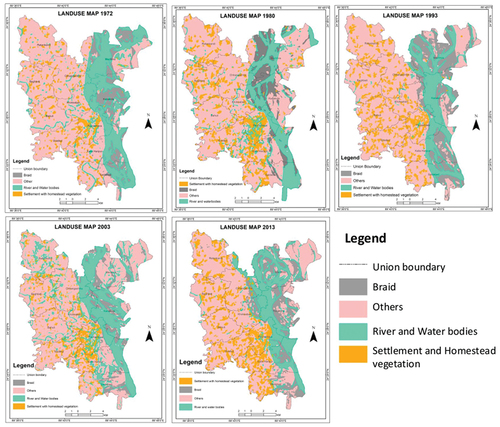
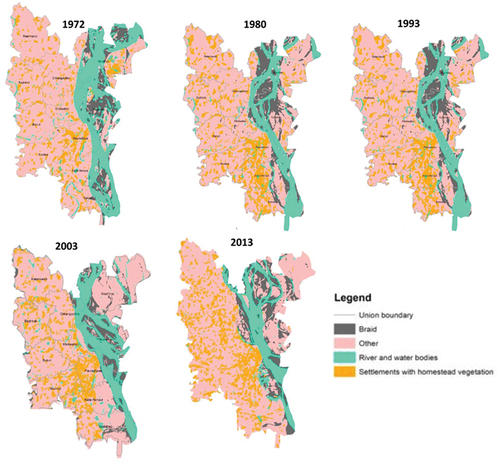
Figure 4. Land cover types and land-use changes of Sirajganj Sadar in the years of 1972, 1980, 1993, 2003, and 2013 using supervised classification technique. The cyan color representing the river courses, the brick color showing the existence of settlements and homestead vegetation, and the gray color stands for the char land in the area.
In both supervised and unsupervised classifications in 1993, the river and water bodies area decreased to 5313.21 and 5390.24 ha, while the immediate decade of 2003 showing an increase of 8346.11 and 8840.58 ha (), respectively.
Figure 5. Total land-use area and their prominent fluctuations in 1972, 1980, 1993, 2003, 2013 using unsupervised classification algorithm.
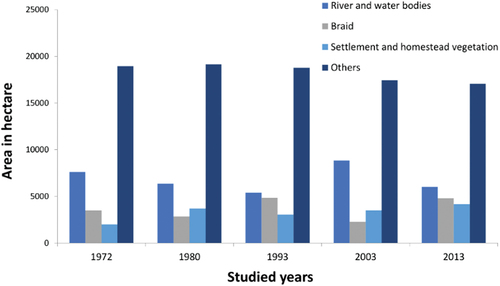
Figure 6. Total land-use area and their prominent fluctuations in 1972, 1980, 1993, 2003, and 2013 using supervised classification algorithm.
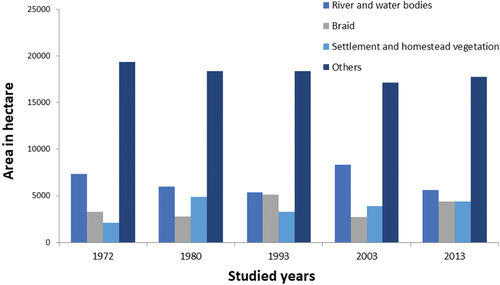
In supervised classification, the erosional area fluctuation having an area of 5106 ha and 4161 ha in 2003 and 2013 year, respectively. Others studied year have minimum fluctuation of erosional area of 3284 ha, 2794 ha, and 2713 ha in the year of 1972, 1980, and 2003, respectively. The char land was almost stable in the years of 1972, 1980, and 1993 meaning that in 1972–1980 and 1980–1993 erosion and deposition were about too similar. In 2003, there is a prominent decrease to 2266.69 ha in char land. The settlements with homestead vegetation area have gradual incensement having 2081 ha, 3687 ha, 3275 ha, 3894 ha, and 4368 ha and there is an exception in 1993. The value goes downward because of having a devastating flood in 1988 and at that time, a number of people had to move permanently. On the other hand, the area of settlements is gradually increasing except the year 1993. A devastating flood and erosion in 1988 triggered many people to become homeless and displaced.
κ coefficient accuracy measurement showed the highest overall accuracy of the classification were greater than 95% and a κ of greater than 0.94 (). The second-highest accuracy and κ values were 91.2% and 0.89 in 2013. The κ coefficient measured the overall accuracy of the classification greater than 85% for all the land types. So, the error matrix of κ coefficients indicated that the land use classification was effective.
Table 1. Unsupervised classification accuracies examined by error matrix of κ coefficients.
On the other hand, in supervised classification, κ coefficient accuracy measurement showed the highest overall accuracy of the classification >97% and a κ of >0.96 (). The second-highest accuracy and κ values were 94.2% and 0.91 in 2013. The κ coefficient measured the overall accuracy of the classification >90% for all the land types. So, the error matrix of κ coefficients has a better accuracy than unsupervised classification
Table 2. Supervised classification accuracies examined by error matrix of κ coefficients.
Four decadal erosional activity of Jamuna river and its impact
The river is widening, and both of the banks are migrating outwards at a high rate for the last four decades (). During the last four decades of 1972 to 2013, the total erosion was approximately 3356.03 ha. The erosional activity mostly happened adversely in some unions.
Among them, Mechra, Chhangachha, Khokshabari, Kaoakhola, Kalia Haripur, and Saidabad are main. shows that the most notorious decade of erosion is 1980–1993 and the contemporary most vulnerable unions are Khokshabari (>707.09 ha), Mechra (>699.80 ha), and Saidabad (>655.70 ha). On the contrary, Kaoakhola and Ratankandi have the lowest erosion of 218.76 ha and <31.59 ha.
Table 3. Erosional landmass area of Sirajganj Sadar based on the local union.
Four decadal Depositional activity of Jamuna river and its impact
Deposition works along with the erosional activity caused by river bed filling by sediment, less amount of flow, etc. Sediment is the naturally occurring material broken down by processes of weathering and erosion, which is subsequently transported by the action of fluids and/or force of gravity. After a long time of sedimentation, char land becomes one of the mainlands. Mechra, Kaoakhola, Saidabad, and Chhangachha unions have the most deposited land (). The decade of 2003–2013 has the major depositional land of 1537.04 ha. Mechra (1972–1980) and Saidabad (2003–2013) have the major depositional land, which embraces >1869.96 ha of land ().
Table 4. Depositional landmass area of Sirajganj Sadar based on the local union.
Erosion and depositional physiognomies
Erosion and deposition are dualist processes. The decade of 1972–1980, 1993–2003, and 2003–2013 have the area of deposition larger than erosion (). In this period, most of the deposition occurred in the Saidabad union from 2003 to 2013. But in the decade of 1980–1993, mainly erosional activity was active. The main cause of this devastating erosion is the excessive flood of 1988 (Ferdous et al., Citation2019b; Best et al., Citation2007). In this period, Chhangachha, Kaoakhola, and Mechra union were mostly eroded.
So, it seems that the depositional activity is more active than the erosional activity. Per year average of 41.63 ha of land eroded by the Jamuna river and 128.21 ha land gained by deposition in Sirajganj Sadar.
River bank shifting
Bank line shifting is one of the eventual major impacts of Jamuna riverbank erosion and deposition. Erosional and depositional activities cause west bank shifting as well as changes of river course which is a typical scene of the Jamuna river. shows the pattern and comparison of west bank shifting of Jamuna River in Sirajganj Sadar from 1972 to 2013. In 1972, the west bank touched the Chhangachha, Khokshabari, Pourasabha, Kalia Haripur, and Saidabad union ().
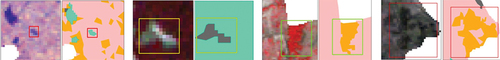
Figure 7. Snaps from land use map showing image classification accuracy pixels to pixels from satellite image to classified image.
Almost half of Chhangachha union has gone into the river due to the dual activity of erosion and deposition from 1972 to 1980 decade. On the other hand, due to excessive deposition in 1993, the west bank was nearly out of the Khokshabari, while in the following decade, it fetched an unpredictable erosion. At present, the Ratankandi union is the most victim of erosion.
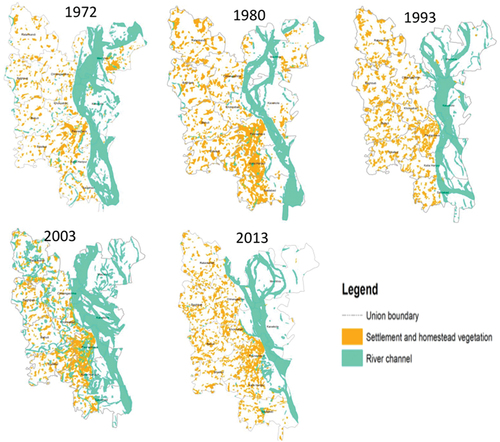
Settlement displacement
Settlement displacement is another foremost impact of riverbank erosion and deposition that largely results from risk perception. Both the observed and anticipatory risk influences people to migrate. People affected by riverbank erosion immediately migrate for safe shelter and later permanently for survival. In the study area, internal migration was observed including men, women, and children. The trends of settlement displacement are increasing day by day. In , orange-colored polygons representing the existed settlements since 1972 to 2013. All the displaced settlements over 1972 to 2013 were presented using satellite data and FGD. The affected people by riverbank erosion do not want to go far, because of being poor class, the possibility to regain their land by deposition, and living related to the river, etc. The orange-colored polygons showing the current settlements including the displaced settlements from the eroded area. The unions of Mechra, Chaongacha, Khokshabari, Kaoakhola, and Saidabad are mainly affected by settlement displacement (). The Pouarasabha union has a well-protected dam which is why the erosion level of that area is low. The newly affected area is the Ratankandi union.
Figure 8. Erosional activity of Jamuna river in Sirajganj Sadar during the last four decades of 1972 to 2013.
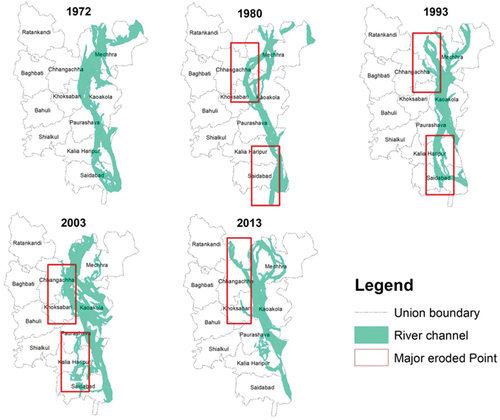
Figure 9. Total depositional activity of Jamuna river in Sirajganj Sadar during the last four decades of 1972 to 2013.
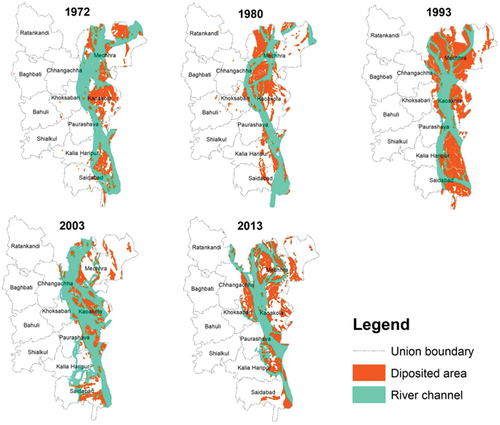
Figure 10. The physiognomies of erosion and depositional process in Sirajganj Sadar. The vertical axis is the local unit of Sirajganj Sadar, and the horizontal axis is the area of total erosion and deposition in hectares within the four decades.
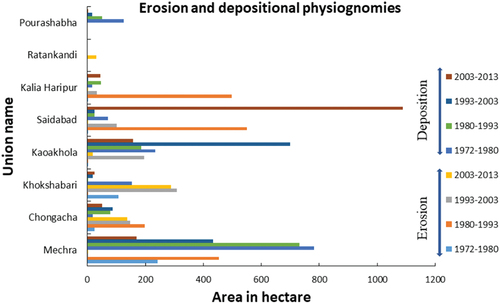
Figure 11. Pattern and comparison of river course and west bank shifting of Jamuna River in Sirajganj Sadar from 1972–2013. The red boxes showing the erosion point on the west bank of the river.
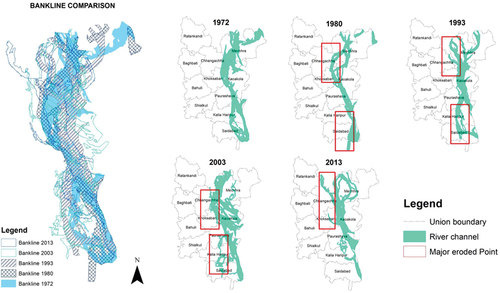
Figure 12. Settlement displacement scenarios of Sirajganj Sadar due to erosion and depositional activities of Jamuna river from 1972–2013.
Impacts of settlement displacement
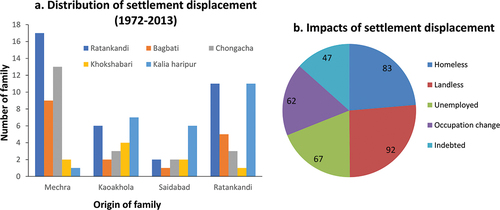
Settlement displacement is mostly narrowed within the nearer place. Displaced people were asked about their origin of settlement and distribution of displaced areas. The total number of respondent families was 108. They were displaced by the riverbank erosion at least once in their life. The origin of the most displaced people was in Mechra union, from where the majority was displaced to Ratankandi (). A few people were displaced to Kalia Haripur union from Mechra. In addition, it was observed that 11 of 108 families were moved to the east part of Ratankani union from the west part of it. Most of the respondents (92%) were landless and 83% were homeless (). The majority of the displacement was based on the proximity to the relatives and employment opportunities. The scope of employment became limited due to landlessness and they need to change their occupation (62%). Due to a lack of employment opportunities, most of the people became indebted (47%).
Figure 13. Impacts of settlement displacement; a. distributions of settlement displacement from eroded place to other places, b. lateral impacts of settlement displacement.
Discussion
Erosion and deposition scenarios of Jamuna River
In the riverine area, erosion and deposition are the most occurring scenario. So, the changes in land cover are easily realized. Erosion and depositional activity have some fluctuating motion and other criteria almost have a trend to incensement or decrease. This study is based on historical satellite image based and for this reason two types of classification methods are being used to achieve better accuracy in classification. From the accuracy test, we get that supervised classification method had better accuracy than the unsupervised classification. Therefore, in the result portion supervised classification data is used to show the outcomes. The rate and annual erosion vary over time from one year to another and from one range to other (CEGIS, Citation2007). During the last four decades of 1972 to 2013, the total erosion in the west bank was about 3714.61 ha, which widened the river banks to migrate westwards at a high rate. On the other hand, the deposition was in 5593.56 ha of land in the channel over the four decades from 1972 to 2013. The larger deposition was caused by the widened and less depth of the river. Being flowing onto the floodplain, its velocity slowed and deposited much of its load which endorsed the deposition of the river (). The eroded sediment from the previous phase of this river was transported and gathered which caused larger depositional land. Embankment, dam, and/or bridge hindered and/or controlled the river flow, which resulted in the deposition of sediments larger than the erosion. On the other hand, human activities in the river reach also affected the relative changes of the deposition and erosion areas. Dam and/or embankment in the vulnerable area of the river changed the flow of the water instigating reduced erosion and triggered deposition on the channel. On the contrary, sand mining caused river erosion (Lusiagustin & Kusratmoko, Citation2017).
Impacts of riverbank erosion and deposition on population displacement
This study presented a detailed investigation of riverbank erosion, deposition, and population settlement displacement of Sirajganj Sadar. From 1980 to 1993, 1562 ha of settlements and homestead vegetated land was displaced (). Ninety-two percent of people were landless and 83% were homeless by the riverbank erosion (). The majority of the people chose to migrate nearer place because of the proximity to the relatives and employment opportunities. The people and resources are under threat of riverbank erosion due to their geographic and geologic settings. Due to riverbank erosion, hundreds of people have been displaced by suffering from increased poverty, food insecurity, lack of access to sanitation, health care, and drinking water facilities, and increased psychological stresses due to not providing remittances by migrated husbands (Abrar & Azad, Citation2004; Rabbi et al., Citation2013; Uddin et al., Citation2011). Haque (Citation1987) assessed the impacts of riverbank erosion hazards in terms of loss of agricultural land, livelihood, change in occupation, and has implications on social ties and relationships. Homesteads, markets, and other establishments are also abolished by riverbank erosion, and the people become insolvent and landless (Bhuiyan et al., Citation2017). Riverbank erosion and migrants do not obtain as much media coverage as victims of other disasters get. As a result, almost a silent catastrophe is going on throughout the year to that unfortunate group of people. But there is no specific policy or program for the riverbank erosion migrants either in government or in non-government sectors. Shami (Citation1993) examined various causes of population displacement. He found a strong positive and negative poverty-migration nexus. Poverty persuades migration as much as migration contributes to the alleviation of Poverty (Afsar, Citation2005).
Nevertheless, the recurrence of char land gives a hope of light to resettle landless people. A large number of displaced people (10‒25%) determine to migrate to the newly emerged char land though it is controlled by the existing power of the locals’ resulting in violent competition amongst the public. Therefore, these instinctive migrants turn out to be permanent squatter settlers (Hutton & Haque, Citation2004). Hutton and Haque also found that mass migration allowed households to uphold their communal and social supports. This practice was particularly significant for the most vulnerable women and the elderly people, depending on kinship ties for their survival.
Limitations and recommendations for environmental management and associated planning
Riverbank erosion victims are not treated in the same manner by the government as victims of other disasters. There is no temporary shelter for riverbank erosion victims or no early warning system or no early evacuation process to evacuate the inhabitants of erosion-prone areas. After losing their homestead, migrants leave the area on their initiatives to distant safer places for shelter by the roadside ridge, neighbors’ and relatives’ land (Rahman, Citation2013). Field-level experience shows that most of them move to different administrative areas. So, the officials of their original area cannot assist them. The resettled area officials have limited scope to help them as they are not the victims of that administrative area.
Therefore, some amendments are needed in existing policies and initiatives of institutions to work for the victims of riverbank erosion. It is needed to consider riverbank erosion as a unique environmental disaster by assisting the environmental management and associated planning. The findings of this study can play a major role in solving quite a lot of limitations of the existing policies. Environmentalists, risk managers, and respective authorities can track the trend of river bank shifting, erosion, and deposition using the techniques used and findings from this study. Besides, can be used to monitor the displaced settlements and the vulnerable settlements as well. The vulnerable settlements can be brought under caution to safety management in the future.
Despite different bank protection works, riverbank erosion remains a continuous threat. Every year, the Jamuna River in Sirajganj erodes a bulky number of settlement areas. The affected people lost their land and some of them became refugees and remain an environmental threat. Therefore, the image-based erosion monitoring and vulnerability assessment method has been recognized as a potential to implement in developing morphological changes using remote sensing and GIS techniques using satellite images (Alam, Citation1990).
Constraint of data collection and processing
Data quality is an important factor for GIS application to this study. The availability and quality of spatial data are another important feature for GIS. The lack of similarity in the district’s scale and shape on different maps produced by the CEGIS was a major problem in digitizing map data. So, in this case, opinions from the local people and the district’s authority during the ground-truthing have been taken into account. Base maps, which are essential to GIS, are often found to be lacking or outdated. They are compiled with different accuracy and map scales that have made them difficult to integrate into the system and have become complicated. There is no standardized geocoding system available to link the textual data with the system’s graphic data. Besides, GIS supporting current and accurate information is not available for Island Erosion and accretion analysis.
For this particular remote area, study ground truthing is hard-working, risky and the only way of collecting point is dependable on boat communication. It was hard to track down affected families. For decades, they have been affected by river bank erosion several times because of not going so far. In identifying the real scenario, respondents were reluctant about sharing information or authentic information.
High-resolution satellite data would be vital to integrate with GIS technology for further change detection analysis of Sirajganj Sadar Upazila. More research work is needed on the long-term impacts of Riverbank erosion. Near real-time and cost-effective remote sensing data are needed for identifying the changes of complex features. It is provided that GIS and Remote sensing is essential for Island feature identification and environmental change analysis.
Conclusion
This study identified the riverbank erosion trends, settlement displacement, bank line shifting and analyzed the erosion, deposition, and changes of a precise region of Jamuna River in Bangladesh using both supervised and unsupervised classification techniques. Supervised classification showed the highest overall accuracy of κ coefficient >90%. Jamuna river has immense diversity in erosion and deposition process. This erosion and deposition were caused by duration of monsoon season, flow and/or discharge control of upper (northern) country, and river management (embankment, sand mining). Being the mature stage, deposition happened abruptly in Jamuna River. A typical change in the channel activity was found in this study, for example, in 1980 main channel moved westward by disseminating into several subordinate channels because of erosion and depositional activities on the west bank (Chhangachha and Khoksabari). In the same era, deposition was the prominent feature in Kalia Haripur and Saidabad. In 1993, the previous eroded area was deposited again and formed a sand bar resulting the channel narrower. The river moved westward in Kalia Haripur and Saidabad due to erosion. In 2003, the process of erosion ensued again in Chhangachha and Paurashava. In 2013, Kalia Haripur and Saidabad were comparatively stable but erosion affected Ratankandi anew. All the erosion and deposition through the river moving westward.
This information will be earnest of assisting the environmental management and associated planning. This study will help the national organization to ensure planning including necessary measures to maintain and reduce the community sufferings and losses caused by erosion. It is concluded that change analysis with the application of GIS and RS may help the policymaker of the Government and the local authority for the development of the Upazila. This insight is an essential basis for the development of the estuarine region, whether this will be accompanied by physical interventions to protect life and property or not. It should be stressed that keeping up the knowledge is a continuous effort, which should have a high priority.
Collecting data for this research was difficult. It was hard to find the exact location of displaced people. In the beginning, most of the respondents hesitated to answer the questions because of no prior ideas on the interview. Sometimes they could not respond correctly because of obscure perceptions, less memory, and shyness.
Highlights
This study mainly contains,
A comprehensive description of land cover types and changes in land cover from 1973 to 2012 in Sirajganj Sadar Upazila.
Four decadal erosional and depositional activities and their impact along the Jamuna river.
Erosion and depositional physiognomies in every 10 years of interval.
Bank line shifting and settlement displacement for four decades.
Identification of the most eroded point and impact buffering zone.
Acknowledgments
We acknowledge the organization of CEGIS for providing essential data for this research. We are also grateful to Prof. Dr Nazrul Islam, associate Prof. Rezaul Roni and Tanjinul Hoque Mollah, Department of Geography and Environment, Jahangirnagar University, Bangladesh, for their valuable guidance. Our special gratitude to Mr Abdul Hannan Khan, seminar librarian of the Department. Our sincere thanks to the Central Library of Jahangirnagar University and all the authorities of different development organizations.
Disclosure statement
No potential conflict of interest was reported by the author(s).
Data availability statement
Data will be made available if asked and required.
References
- Abrar, C. R., & Azad, S. N. (2004). Coping with displacement: Riverbank erosion in northwest Bangladesh. University Press Limited.
- Afsar, R. (2005, March 14-16). Bangladesh: Internal Migration and pro-poor policy. Paper presented at the Regional conference on migration and development in Asia, Department for International Development in Asia, Lanzhou China.
- Aher, S. P., Bairagi, S. I., Deshmukh, P. P., & Gaikwad, R. D. (2012). River change detection and bank erosion identification using topographical and remote sensing data. International Journal of Applied Information Systems (IJAIS), 2(3), 1–7. https://www.researchgate.net/publication/260869944
- Alam, S. M. N. (1990). Perceptions of flood among Bangladeshi Villagers. Disasters, 14(4), 354–357. https://doi.org/10.1111/j.1467-7717.1990.tb01080.x
- Ali, E., El Khidir, S. O. H., Ibrahim, A. A. B., & Abdelrahman, E. M. (2012). Landsat ETM+7 digital image processing techniques for lithological and structural lineament enhancement: Case study around Abidiya Area, Sudan. The Open Remote Sensing Journal, 5(1), 83–89. https://doi.org/10.2174/1875413901205010083
- Bangladesh Statistics. (2018). Bangladesh Bureau of Statistics (BBS) (2018).
- Baten, A., González, P. A., & Delgado, R. C. (2018). Natural disasters and management systems of Bangladesh from 1972 to 2017: Special Focus on Flood. OmniScience: A Multi-disciplinary Journal, 8(3), 35–47. http://publichealthdisasters.eu/wp-content/uploads/2019/01/Art-Bangladesh-floods-753-4466-3-PB.pdf
- BBS. (2011). Bangladesh Bureau of Statistics, population and housing census 2011.
- Best, J. L., Ashworth, P., Sarker, M. H., & Roden, J. E. (2007). The Brahmaputra-Jamuna River, Bangladesh. In A. Gupta (Ed.), Large rivers: Geomorphology and management (Vol. 36, pp. 395–430). Wiley & Sons Ltd.
- Bhuiyan, M. A. H., Islam, S. M. D., & Azam, G. (2017). Exploring impacts and livelihood vulnerability of riverbank erosion hazard among rural household along the river Padma of Bangladesh. Environmental Systems Research, 6(25 1–15). https://doi.org/10.1186/s40068-017-0102-9
- BWDB. (2013). Annual flood report 2012,
- Campbell, J. B. (1981). Spatial correlation effects upon the accuracy of supervised classification of land cover. Photogrammetric Engineering and Remote Sensing, 47 (3) , 355–363.
- CEGIS. (2007). Long-term erosion process of the Jamuna River. Jamuna-Meghna River Erosion Mitigation Project, Bangladesh Water Development Board.
- Davalo, E., & Naim, P. (1991). Neural networks. Macmillan.
- Dey. (2004). Bangladesh. Environmental Informatics Archives. Environmental Science, Khulna University, 2, 855–863.
- Etzold, B., & Mallick, B. (2015). Bangladesh at a glance. Country Profile, 1–14. https://www.researchgate.net/publication/285371220
- Ferdous, M. R., Wesselink, A., Brandimarte, L., Baldassarre, G. D., & Rahman, M. M. (2019a). The levee effect along the Jamuna River in Bangladesh. Water International, 44(5), 496–519. https://doi.org/10.1080/02508060.2019.1619048
- Ferdous, M. R., Wesselink, A., Brandimarte, L., Slager, K., Zwarteveen, M., & Baldassarre, G. D. (2019b). The costs of living with floods in the Jamuna Floodplain in Bangladesh. Water, 11(6), 1238. https://doi.org/10.3390/w11061238
- Goldberg, M. (1981). Digital image processing of remotely sensed imagery. In J. C. Simon & R. M. Haralick (Eds.), Digital image processing. NATO advanced study institutes series (Series C - mathematical and physical sciences) (pp. 77). Springer. https://doi.org/10.1007/978-94-009-8543-8_23
- GSP. (2016). Introduction to remote sensing. Humboldt State University. 1 Harpst Street Arcata, CA 95521. Retrieved June 14, 2021, from http://gsp.humboldt.edu/OLM/Courses/GSP_216_Online/lesson6-1/unsupervised.html
- Guchhait, S. K., Islam, A., Ghosh, S., Das, B. C., & Maji, N. K. (2016). Role of hydrological regime and floodplain sediments in channel instability of the Bhagirathi River, Ganga-Brahmaputra Delta, India. Physical Geography, 37(6), 476–510. https://doi.org/10.1080/02723646.2016.1230986
- Haque, C. E. (1987). Impact of riverbank erosion in Kazipur: An application of Landsat imagery. REIS Newsletters, Jahangirnagar University.
- Hashemian, M. S., Abkar, A. A., & Fatemi, S. B. (2004). Study of sampling methods for accuracy assessment of classified remotely sensed data. International Congress for Photogrammetry and Remote Sensing. https://www.semanticscho lar.org/paper/
- Hepner, G. F., Logan, T., Ritter, N., & Bryant, N. (1990). Artificial neural network classification using a minimal training set: Comparison to conventional supervised classification. Photogram-metric Engineering & Remote Sensing, 56 (4) , 469–473 doi:0099-1112~90/5604-469$02.25/.
- Hutton, D., & Haque, C. E. (2004). Human vulnerability, dislocation and resettlement: Adaptation processes of river-bank erosion-induced displaces in Bangladesh. Disasters, 28(1), 41–62. https://doi.org/10.1111/j.0361-3666.2004.00242.x
- Islam, K. (2012). Sirajganj Sadar Upazila. In S. Islam, and A. A. Jamal (Eds.), Banglapedia: National encyclopedia of Bangladesh (Second.). Asiatic Society of Bangladesh 984-32-0576-6 Accessed 7 9 2021 .
- Islam, S. N., Singh, S., Shaheed, H., & Wei, S. (2010). Settlement relocations in the char-lands of Padma River basin in Ganges delta, Bangladesh. Frontiers of Earth Science in China, 4(4), 393–402. https://doi.org/10.1007/s11707-010-0122-5
- Klaassen, G. (2013). River and Charland morphology and river engineering. Technical Assistance Consultant’s Report. Asian Development Bank. Government of the People’s Republic of Bangladesh, Bangladesh Water Development Board.
- Lusiagustin, V., & Kusratmoko, E. (2017). Impact of sand mining activities on the environmental condition of the Komering river, South Sumatera. AIP Conference Proceedings 1862 1 Nov 2016 – 2 Nov 2016 Depok, Jawa Barat, Indonesia (American Institute of Physics Inc.), 030198. https://doi.org/10.1063/1.4991302
- Medina, F. I., & Vasquez, R. (1991). Use of simulated neural networks for aerial image classification. ACSM-ASP4S Annual Convention, Bethesda, Maryland (American Society for Photogrammetry and Remote Sensing, American Congress on Surveying and Mapping), 268–274.
- Mirza, M. M. Q., Warrick, R. A., & Ericksen, N. J. (2003). The implications of climate change on floods of the Ganges, Brahmaputra, and Meghna rivers in Bangladesh. Climatic Change, 57(3), 287–318. https://doi.org/10.1023/A:1022825915791
- Mohamad, N., Khanan, M. F. A., Musliman, A., Kadir, W. H. W., Ahmad, A., Rahman, M. Z. A., Jamal, M. H., Zabidi, M., Suai, N. M., & Zain, R. M. (2018). Spatio-temporal analysis of river morphological changes and erosion detection using very high-resolution satellite image. OP Conf. Series: Earth and Environmental Science, 169, 012020. https://doi.org/10.1088/1755-1315/169/1/012020
- Persico, R., Piro, S., & Linford, N. (2019). Innovation in near-surface geophysics instrumentation, application, and data processing methods. Elsevier B.V. https://doi.org/10.1016/C2016-0-03364-8
- Rabbi, H., Saifullah, A. S. M., Sheikh, M., Sarker, S., Md, M. H., & Bhowmick, A. C. (2013). Recent study on river bank erosion and its impacts on land displaced people in Sirajgonj Riverine Area of Bangladesh. World Journal of Applied Environmental Chemistry, 2(2), 36–43. . www.environmentaljournals.org .
- Rahman, M. R. (2013). Impact of riverbank erosion hazard in the Jamuna floodplain areas in Bangladesh. Journal of Science Foundation, 8(1–2), 55–65. https://doi.org/10.3329/jsf.v8i1–2.14627
- Rahman, M. S., & Gain, A. (2020). Adaptation to riverbank erosion induced displacement in Koyra Upazila of Bangladesh. Progress in Disaster Science, 5(100055), 1–8. https://doi.org/10.1016/j.pdisas.2019.100055
- Schmuck, W. H. (2001). Facing the Jamuna River-indigenous and engineering knowledge in Bangladesh. Bersha (Pvt) Ltd.
- Shami, S. (1993). The social implications of population displacement and resettlement: An overview with a focus on the Arab Middle East. International Migration Review, 27(101), 4–33. https://doi.org/10.2307/2546699
- Uddin, K., Shrestha, B., & Alam, M. S. (2011). Assessment of morphological changes and vulnerability of river Bank erosion alongside the river Jamuna using remote sensing Journal of Earth Science and Engineering . https://www.isprs.org/proceedings/2011/gi4dm/pdf/op63.pdf