
ABSTRACT
The Quaternary Period is characterized by dramatic global climatic changes. Quaternary fossil deposits, which can offer excellent stratigraphic resolution, provide a unique opportunity to understand how fauna respond to past environmental change. Here, we test if the herpetofauna of McEachern’s Deathtrap Cave, a late Pleistocene to Holocene pitfall trap deposit from Victoria, Australia, shows climate-related shifts in taxonomic relative abundance through time. During the last 14,000 years, southeastern Australia experienced pronounced periods of aridity, while temperatures remained relatively stable. We show that the stratigraphic layers of this deposit are characterized by different relative abundances of reptile subfamilies, and that changes in subfamily abundance between layers correlate with known shifts to aridity, based on the percentage of C4 grasses present in the region. We further identify 13 lizard morphotypes from the fossil deposit and compare this diversity with the present-day lizard fauna. Our analyses indicate that gradual changes in community structure, which are typically observed in southeastern Australian vertebrate communities during the Pleistocene–Holocene transition, can partly be explained by changing aridity. These findings represent an important contribution to understanding Quaternary community change in Australia, particularly because evidence of faunal succession of reptile and amphibian communities in Victoria is lacking. Our results further demonstrate the utility of the Australian herpetofaunal fossil record for detecting community responses to past climate change on relatively shallow timescales and at higher levels of taxonomic identification.
INTRODUCTION
The Quaternary Period (2.58 million years ago (Ma) – present) is of particular importance for understanding climate-related faunal dynamics (Palombo, Citation2018). During the Quaternary, the Earth underwent dramatic changes in climate, caused primarily by the amplification of temperature and precipitation shifts that occurred during glacial–interglacial cycles (Jouzel et al., Citation2007). These glacial–interglacial cycles were characterized by extremely cold glacial phases and rapidly increasing temperatures at the beginning of the subsequent interglacial phases (Hesse et al., Citation2004). In Australia, the Quaternary Period was significantly marked by intensifying aridity, whereby each peak glacial period was progressively drier than the one previous (Fujioka and Chappell, Citation2010).
Quaternary fossil deposits often provide a high temporal resolution of paleontological evidence (Palombo, Citation2018), thus potentially rendering fine-scale information on how faunal communities reacted to changing climatic regimes at the time of deposition (see, e.g., Lundelius, Citation1960; Faunmap Working Group, Citation1996; Bell et al., Citation2010; Prideaux et al., Citation2010; Thorn et al., Citation2017). Observing faunal dynamics and records of extant species outside of their current distribution provides insights into the underlying causes and consequences of local extinctions or range shifts, which may be related to climate change and/or human impacts (e.g., Kemp and Hadly, Citation2016a; Fusco et al., Citation2016). This information provides a baseline through which modern species distributions and communities can be evaluated from a conservational perspective (Kemp and Hadly, Citation2016b), allowing predictions on their dynamics into the future.
Ectothermic vertebrates such as reptiles and amphibians, collectively known as herpetofauna, are thought to react more strongly to climate change than endotherms (e.g., McMenamin et al., Citation2008; Böhm et al., Citation2016), thus representing a potential model system for investigating Quaternary faunal succession. Yet, their utilization for this purpose remains rare (e.g., Bell et al., Citation2004, Citation2010; Jass and Gardner, Citation2013; Kemp and Hadly, Citation2015, Citation2016a). The paucity of research in this field is partly due to challenges of working on herpetofaunal fossil deposits, such as the lack of osteological apomorphies that allow species-level identification of isolated fossil remains of many reptile and frog lineages (e.g., Bell et al., Citation2010). Instead, Pleistocene and Holocene herpetofaunal remains are commonly identified via resemblance, often by comparison to a geographic subset of extant species that may lead to circular hypotheses about faunal stability (see Bell et al., Citation2010). Additionally, species identification using comparative approaches is often hampered by a lack of skeletal material for extant species in many museum collections (Bell and Mead, Citation2014). Recently, however, this is improving with the application of non-destructive imaging techniques such as X-ray computed tomography for visualizing osteological features of e.g., alcohol specimens to complement skeletal comparative collections (e.g., Chaplin et al., Citation2019; Melville et al., Citation2019; Hipsley et al., Citation2020).
Despite these challenges, the Quaternary herpetofaunal fossil record remains an important source of global information for identifying climate-related faunal succession, since reptiles and amphibians represent a substantial part of terrestrial vertebrate biodiversity (see, e.g., Kemp and Hadly, Citation2016b). Australia is characterized by an exceptional herpetofaunal diversity (e.g., Pianka, Citation1989) and Pleistocene and Holocene fossil deposits, comprising herpetofaunal remains, are numerous throughout the continent (e.g., Lundelius, Citation1983; Reed and Bourne, Citation2000, 2009). However, the potential of Australian reptile and amphibian fossils for examining faunal change during this period has widely been neglected, presumably for the same reasons mentioned above (for exceptions see Smith, Citation1976, Citation1982; Hope et al., Citation1977; Pledge, Citation1990; Price and Sobbe, Citation2005; Fraser and Wells, Citation2006; Hocknull et al., Citation2007; Hollenshead et al., Citation2011). Additionally, Australian paleoherpetologists are dealing with higher species diversity within fewer subfamilies in any single deposit; when family- or subfamily-level osteology-based identifications are more likely than genus or species level (Villa et al., Citation2017).
During the Quaternary, Australia experienced drastic changes in climate that are thought to have had major impacts on native biota (e.g., Byrne et al., Citation2008, Citation2011). The continent was subject to a gradual progressive aridification, which began about 700,000 years ago (Prescott et al., Citation2012), and intensified over the last 400–350 ka (e.g., Kershaw et al., Citation2003; Hope et al., Citation2004; Fujioka and Chappell, Citation2010). Little is known about changes in species composition or relative abundances of Australian herpetofaunal communities during this period (e.g., Hocknull, Citation2005; Hocknull et al., Citation2007) and statistical evidence of community change is almost entirely lacking. Hocknull et al. (Citation2007) describe a mesic-adapted vertebrate fauna from tropical Queensland including reptiles and frogs, which was replaced about 280–205 ka (thousands of years ago) by an arid-adapted fauna. By the Holocene around 7 ka, mesic-adapted species were present again (Hocknull et al., Citation2007). This change was interpreted as a reaction to Quaternary climatic phase shifts and intensifying aridity (Hocknull et al., Citation2007) and suggests that complete community turnover occurred multiple times throughout the Pleistocene to Holocene in eastern Australia.
In temperate southeastern Australia, evidence for Pleistocene–Holocene faunal change comes predominantly from analyses of mammalian remains. Several studies indicate that gradual changes of community composition correspond to changes from colder climatic conditions around the Last Glacial Maximum (∼20 ka) towards a warmer climate during the Holocene Climatic Optimum about 6 ka (Wakefield, Citation1967, Citation1969, Citation1972; Hope, Citation1973; Baird, Citation1992). This scenario of climatic changes is also supported by sea surface temperatures reconstructed from organic proxies and foraminiferal assemblages (Lopez dos Santos et al., Citation2013) and evidence from speleothem and alluvial records, suggesting also large flood events due to increased rainfall during the Holocene (Quigley et al., Citation2010).
In this study, we analyze relative abundances of fossil squamates and anurans from McEachern’s Deathtrap Cave (MDC; G-49/50), a fossil site from western Victoria (), to test if compositional changes related to late Pleistocene–Holocene climatic fluctuations are detectable in the herpetofaunal fossil record during the last ∼14,000 years. In the absence of osteological apomorphies for lower taxonomic groups, we specifically focus on higher levels of taxonomic identification, commonly achieved in studies of fossil Australian squamates. Macroevolutionary patterns such as relationships of e.g., species richness (e.g., Powney et al., Citation2010), body size (Ashton and Feldman, Citation2003) or community structure (Ramm et al., Citation2018) with climate were shown to exist for many higher clades of squamates, yet, it remains unknown if similar patterns can also be observed across temporal climatic gradients covered by Quaternary fossil deposits.
FIGURE 1. Location and stratigraphy of McEachern’s Deathtrap Cave. A, map showing the location of MDC and other key fossil sites discussed in this study. B, depth-age plot. Ages are given in calibrated thousands of years ago (cal ka). C, longitudinal cross-section of MDC (modified from Kos, Citation2001). D, stratigraphy and associated ages of MDC. Ages are given in thousands of years ago (ka).
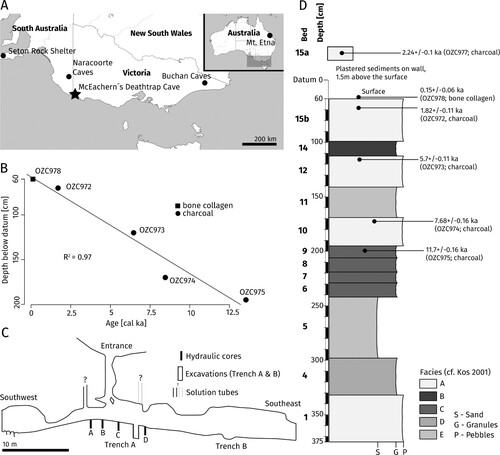
MDC is located in the Lower Glenelg National Park, with extensive documentation of stratigraphy (Kos, Citation2001), taphonomy (Kos, Citation2003a), and mammalian remains (Kos, Citation2003b). The cave is connected to the surface by two cylindrical entrance shafts of ∼2 m in diameter and ∼10 m in length (Kos, Citation1998) (). Kos (Citation2003b) established age and body size frequencies of some of the recovered mammal species based on tooth wear, molar/premolar eruption stages and sizes of the cranial elements found in the cave. These analyses suggested that the accumulation of mammals in MDC was not a selective process, as the mammal assemblage showed a large mean body weight distribution and a representation of all age classes of the examined species, which is uncommon for assemblages which were primarily accumulated by predators (Kos, Citation2003b). Based on these analyses, the morphology of the cave, as well as based on the documentation of modern pitfall victims such as a living koala, a short-beaked echidna and several live snakes, which were unable to exit the cave (Kos, Citation2003b, pers. comm.), MDC is hypothesized to have been a pitfall trap from late Pleistocene to present (Kos, Citation2003a). A previous study further produced several dates for some sedimentary beds of the deposit, which were in correct stratigraphic order and which cover an age range from ∼11.7 to ∼1.82 ka (uncalibrated ages, see ; Kos, Citation2001). The excavation by Kos (Citation2001) further produced a fine-scale stratigraphic resolution, which makes this deposit especially suitable for analyzing relative abundances through time. Using evidence from sedimentation, Kos (Citation2001) found signatures of a wetter period between 7 and 5 ka, correlating with an increase in precipitation at Lake Leake (southeast South Australia, ∼60 km northwest from MDC) as suggested by Dodson (Citation1974).
Institutional Abbreviations—CAS, California Academy of Sciences, San Francisco, U.S.A.; NMV, National Museum of Victoria, Melbourne, Australia; SAMA, South Australian Museum, Adelaide, Australia; UF, University of Florida, Gainesville, U.S.A.; UMMZ, University of Michigan Museum of Zoology, Ann Arbor, U.S.A.
Anatomical Abbreviations— F, frontal; I, ilium; LD, left dentary; LM, left maxilla; LPL, left palatine; LPM, left premaxilla; LPT, left pterygoid; P, parietal; RD, right dentary; RM, right maxilla; RPL, right palatine; RPM, right premaxilla; RPT, right pterygoid; RU, radioulna; T, tooth; TB, tibiofibula.
METHODS
Bulk material from Trench A (southeast section) of MDC (see Kos, Citation2001 for a more detailed description of the deposit) was sorted for herpetofaunal remains. Isolated cranial elements of squamates (lizards and snakes), as well as cranial and postcranial material of frogs were selected for further analyses (Table S1). The fossils were first identified to subfamily level, based on apomorphic characters in the published literature. Second, a set of unique combinations of osteological characters was used to assign fossils to different morphotypes. Since our comparative dataset was not sufficient to establish apomorphies and no osteological apomorphies are described for most Australian lizard taxa, we rely on these unique combinations of characters to distinguish fossils into morphotypes. However, we acknowledge that we did not employ the concept of crown-stem distinctions and that consequently these characters might represent synapomorphies. Therefore, the morphotypes described herein do not necessarily correspond to different (extant) species. We then compared the established morphotypes with recent specimens and described respective similarities. For these lower-level taxonomic identifications (morphotypes), we focused on lizard dentaries. The subfamily-level of identification was chosen for our analyses, because easily identifiable, osteological apomorphies for scincids were described for the ‘Eugongylus,’ ‘Egernia,’ and ‘Sphenomorphus’ groups, which now constitute subfamilies (following Uetz et al., Citation2020). To compare the fauna of the deposit with contemporary species composition of the area we obtained spatially valid records of lizards via the spatial portal of the Atlas of Living Australia (ALA, https://www.ala.org.au/) as well as species distributions from Robertson and Coventry (Citation2019) within a ∼5 km radius around the location of MDC.
We calculated the minimum number of individuals (MNI) based on the largest number of a given fossil element (e.g., left or right dentaries) attributed to each taxon in each stratigraphic sample (the sediments of the type section were excavated and stored in batches of several cm depth; see Kos, Citation1998). We also repeated our analyses using the number of identified specimens (NISP) and compared the respective results. The fossils were assigned to six sedimentary beds of MDC defined by Kos (Citation1998, Citation2001), based on their differing bedding, textural composition, and depth. A few individuals (n = 9) were found in sedimentary bed 5 of Kos (Citation2001), for which no age information was present. We therefore excluded these from the analyses. The ages of four of the sedimentary beds were reported by Kos (Citation2001) from 14C accelerator mass spectrometry dating of charcoal, covering an age range from ∼11.7 to ∼1.82 ka (uncalibrated ages, see ). We calibrated these dates in OxCal 4.4 using the SH20 calibration curve (Hogg et al., Citation2020) to increase comparability with the calibrated ages of climate proxies (see below). Some stratigraphic samples (n = 135; Table S1) crossed the boundaries of sedimentary beds and were therefore excluded from the analyses. The snake family Elapidae does not contain any subfamilies, so it was included as a whole in our subfamily analyses. Rarefaction curves were plotted using the smallest sample size (7) for rarifying communities with the R package ‘vegan’ (Oksanen et al., Citation2019). These plots were used to determine if a greater sample size would likely yield additional taxa.
FIGURE 4. Results of the correspondence analyses excluding Amphibolurinae using the number of identified specimens, NISP, A, and minimum number of individuals, MNI, B, as symmetric maps (rows and columns as principal coordinates). Points (rows) represent different taxa, and triangles (columns) represent different sedimentary beds. Sizes of the symbols correspond to relative frequencies, while the color intensity of the symbols is proportional to their absolute contribution to the planar display. Ages of the sedimentary beds are given in calibrated thousands of years ago (cal ka).
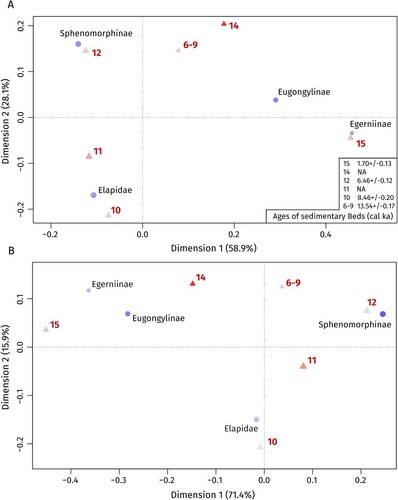
We then applied correspondence analysis using the ca function in the R package ‘ca’ (Nenadic and Greenacre, Citation2007) to visualize affinities of the different sedimentary beds and respective subfamilies. Correspondence analysis is a factorial reduction method which produces a graphical representation by transforming counted data into points on an axis or plane (Freudenthal et al., Citation2009). Correspondence analysis is considered an exploratory approach (Greenacre, Citation1992), that enables easy visualization of the distribution of the data on the first axes, which can then be used to formulate hypotheses (Freudenthal et al., Citation2009). This technique is especially useful to detect ecological turnover and possible relationships with environmental gradients in paleontological datasets (Hammer et al., Citation2001). Because of the low number of amphibolurine specimens (n = 6), we repeated the correspondence analysis on subfamily-level with and without Amphibulorinae. We also repeated our analysis without sedimentary beds 6–9 as they contained only a small number of specimens.
As a proxy for temperature change, we extracted Quaternary sea-level surface temperatures from offshore southeastern Australia based on organic proxies and foraminiferal assemblages from Lopes dos Santos et al. (Citation2013). A reconstruction of the proportion of C3/C4 grasses near Tower Hill Northwest Crater in southwestern Victoria throughout the late Pleistocene and Holocene (Nelson et al., Citation2016) was used as a proxy for aridity. High abundances of C4 grasses in this area were found to correlate with periods of increased aridity (Nelson et al., Citation2016). We used LOESS (local regression fitting) in R (R Core Team, Citation2019) on data points of the above-mentioned datasets within the last 14 ka to compare trends in environmental changes to changes in faunal composition of the sedimentary beds in the deposit. The optimal smoothing parameters of the LOESS fits were determined using a generalized cross-validation method. Temperature and aridity values were predicted for the median calibrated ages of the sedimentary beds of MDC from the respective LOESS fits in R. Ages of the two beds without 14C dates (11 and 14) were defined as the midpoint between the median calibrated ages of the two surrounding beds. We then used linear models to assess correlations of the different dimensions of the correspondence analyses as well as relative abundances of subfamilies with climate. Relative abundances of morphotypes were not tested against climate because of their low numbers, whereas relative abundances of frogs versus squamates were tested separately. Since we included postcranial bones only for anurans, we repeated these analyses with and without postcranial material. Taxonomic nomenclature follows Uetz et al. (Citation2020). Terminology follows Evans (Citation2008).
SYSTEMATIC PALEONTOLOGY
Order ANURA Duméril, Citation1806
Diagnosis—Anuran ilia are elongated into a shaft located horizontally and parallel to the urostyle (Ročková and Roček, Citation2005). Maxillae and premaxillae were assigned to Anura based on the presence of pedicellate teeth (synapomorphy of Lissamphibia, however, only Anura occur in Australia; Parsons and Williams Citation1962). Anura show a characteristic fusion of tibia and fibula as well as radius and ulna (Ford and Cannatella, Citation1993).
Comparative Specimens—These comprise CAS 121263 (Limnodynastes convexiusculus, CT scan); UF 109124 (Litoria aurea, CT scan); UF 100826 (Pseudophryne bibronii, CT scan).
ANURA indet.
Referred Specimens—These include NMV P254359 (2 RM), NMV P254363 (LPM), NMV P254369 (RM), NMV P254376 (RM), NMV P254380 (RM), NMV P254386 (LM), NMV P254396 (RM), NMV P254399 (RM), NMV P254403 (LM), NMV P254409 (2RM), NMV P254414 (RM), NMV P254417 (RM), NMV P254424 (2 LM), NMV P254445 (RM), NMV P254450 (LM), NMV P254451 (2 RU, TB), NMV P254469 (LM), NMV P254489 (LM), NMV P254586 (LM), NMV P254589 (LM), NMV P254631 (2 RM), NMV P254641 (LM), NMV P254647 (LM), NMV P254650 (RM), NMV P254659 (RPM), NMV P254668 (LPM), NMV P254684 (LM), NMV P254687 (I), NMV P254688 (I), NMV P254689 (I), NMV P254690 (I), NMV P254691 (I), NMV P254692 (2 I), NMV P254693 (I), NMV P254694 (I), NMV P 254695 (I), NMV P254696 (I), NMV P254697 (I), NMV P254698 (3 I), NMV P254699 (3I), NMV P254700 (I), NMV P254701 (I), NMV P254702 (I), NMV P254703 (2 I), NMV P254704 (I), NMV P254705 (I), NMV P254706 (I), NMVP254707 (LPM, TB), NMV P254708 (I, TB), NMV P254709 (2 I), NMV P254710 (I), NMV P254711 (2 I), NMV P254712 (2 I), NMV P254713 (2 I), NMV P254714 (3 I), NMV P254715 (I), NMV P256069 (RM, RPM), NMV P256070 (LM), NMV P256071 (LM), NMV P256072 (RPM), NMV P256073 (LM, RM), NMV P256074 (RM), NMV P256075 (RM), NMV P256076 (RM), NMV P256077 (RM), NMV P256078 (LM), NMV P256079 (RM), NMV P256080 (LM), NMV P256081 (LM), NMV P256082 (RM), NMV P256083 (LM), NMV P256084 (LM), NMV P256085 (RM), NMV P256086 (RM), NMV P256087 (RM), NMV P256088 (LM), NMV P256089 (RM), NMV P256090 (RM), NMV P256091 (RM), NMV P256092 (LM), NMV P256093 (LM), NMV P25609 (RM), NMV P256095 (2 LM), NMV P256096 (LM), NMV P256097 (3 RM), NMV P256098 (LM, 2 RM), NMV P256099 (LM), NMV P256100 (LPM), NMV P256101 (LM), NMV P256102 (RM), NMV P256103 (RM), NMV P256104 (2 LM), NMV P256105 (LPM), NMV P256106 (RM), NMV P256107 (RPM), NMV P256108 (RM), NMV P256109 (LPM), NMV P256110 (RM, RPM), NMV P256111 (LM).
Order SQUAMATA Oppel, Citation1811
Family SCINCIDAE Gray, Citation1825
Diagnosis—Isolated cranial elements were assigned to Scincidae based on the following synapomorphic features: (1), maxillae: the posterior processes bifurcate into superior and inferior processes (Gill Citation1985), large labial foramina (Estes, Citation1983; Greer, Citation1989; Evans, Citation2008), chisel-shaped tooth crowns (see Daza et al., Citation2015); (2), premaxillae: paired (Hutchinson, Citation1993) with chisel-shaped tooth crowns (see Daza et al., Citation2015); (3), frontal: crista cranii do not meet ventrally (Conrad, Citation2008; Evans, Citation2008; Gauthier et al., Citation2012); (4), parietal: fused parietals with a parietal foramen in combination with a well-developed parietal fossa (Gill, Citation1985; Estes et al., Citation1988); (5), dentary: upwardly directed coronoid process (contrast with geckos, which also have a labial shelf for the anterolateral process of the coronoid; Daza et al., Citation2015), curved sublingual shelf (contrast with a straight sublingual shelf in geckos; Lee et al., Citation2009), dentaries are more straight in comparison to gecko dentaries, which are more strongly curved mediolaterally (Gill, Citation1985).
We used several characters described by Greer (Citation1979), Hutchinson (Citation1992), Hollenshead et al. (Citation2011), Shea (Citation1990) and Gelnaw (Citation2011) as well as other morphological features to distinguish scincid dentaries (and one maxilla of T. nigrolutea) into different morphotypes as described below. All morphotypes can be identified based on a unique combination of characters, and similarities to extant specimens are described. The size and nature of our comparative dataset, however, did not allow for a thorough examination of intraspecific or ontological variation.
Characters used to identify different morphotypes (see also ):
Meckel’s groove open (1)/open but narrow (2)/closed with v-shaped splenial notch (3)/closed with u-shaped splenial notch (4).
Splenial notch reaches up to ventral of which tooth position (counted from posterior end of the toothrow).
Number of tooth positions.
Dorsal margin of the coronoid process convex (1)/straight (2)/concave (3).
Dorsal margin of the angular process convex (1)/straight (2)/concave (3).
Anterior-most inflection between the coronoid process and angular process positioned higher (1)/midway (2)/lower than midway (3) of the dentary height measured from the tip of the coronoid process.
The gap of the posterior-most mental foramen and the next is wider (1)/about the same (2)/narrower (3) than gaps between the other foramina.
The angle formed by the intersection of the posterior margins of the dorsal and angular processes measures more (1)/about the same (2)/less (3) than 90°.
The coronoid facet shows a distinct step (1)/does not show a distinct step (2).
A surangular process is present (1)/absent (2).
Number of mental foramina.
Inferior alveolar foramen (IAF) is positioned anterior (1)/midway (2)/posterior (3) of the midway point along the dentary.
SCINCIDAE indet.
TABLE 1. Character matrix of the morphotypes identified in the deposit.
Referred Specimens—Specimens NMV P254356 (RPM), NMV P254357 (RD), NMV P254361 (RD), NMV P254366 (RM), NMV P254367 (LM), NMV P254373 (LM), NMV P254375 (LD), NMV P254382 (LM), NMV P254383 (RM), NMV P254390 (LD), NMV P254391 (RM), NMV P254395 (RM), NMV P254398 (PRM), NMV P254401 (PRM), NMV P254402 (LM, RM), NMV P254404 (LM), NMV P254407 (RM), NMV P254413 (LM), NMV P254427 (RM), NMV P254436 (LM), NMV P254441 (LM), NMV P254447 (2 LM, RM), NMV P254453 (LD), NMV P254454 (F), NMV P254457 (RM), NMV P254458 (RM), NMV P254461 (LM), NMV P254463 (RM), NMV P254464 (LD), NMV P254467 (RM), NMV P254468 (RM), NMV P254470 (RM), NMV P254478 (RM), NMV P254479 (LM), NMV P254480 (RM), NMV P254481 (RM), NMV P254484 (RM), NMV P254487 (RD), NMV P254490 (LM, RM), NMV P254491 (RM), NMV P254578 (LM), NMV P254585 (LD), NMV P254587 (LM), NMV P254591 (LPM), NMV P254592 (RD), NMV P254594 (LM), NMV P254595 (LD), NMV P254598 (RM), NMV P254600 (RM), NMV P254626 (RM), NMV P254627 (LD, 2 RD), NMV P254630 (LM), NMV P254637 (RM), NMV P254639 (LM), NMV P254640 (LM), NMV P254643 (F), NMV P254648 (2 RM), NMV P254649 (RM), NMV P254654 (RM), NMV P254656 (P), NMV P254660 (RM), NMV P254661 (RM), NMV P254663 (LM), NMV P254664 (LM), NMV P254667 (2RM), NMV P254669 (P), NMV P254671 (P), NMV P254672 (P), NMV P254675 (RM), NMV P254679 (LM), NMV P254680 (LM, RM), NMV P256116 (RM), NMV P256195 (LM), NMV P256196 (LM), NMV P256197 (RM), NMV P256205 (LM), NMV P256206 (RM), NMV P256207 (LM), NMV P256211 (LM), NMV P256212 (LM, RM), NMV P256213 (P), NMV P256214 (RM), NMV P256215 (RM), NMV P256216 (RM, RPM), NMV P256217 (LM, RM), NMV P256218 (RM), NMV P256219 (RM), NMV P256220 (RM), NMV P256221 (F), NMV P256222 (RM), NMV P256223 (P), NMV P256224 (F), NMV P256225 (F), NMV P256226 (RM), NMV P256227 (F), NMV P256228 (RM), NMV P256229 (RM), NMV P256230 (2 LM), NMV P256231 (RM), NMV P256232 (2 LM, RM), NMV P256233 (LM), NMV P256234 (LM, RM), NMV P256235 (LM), NMV P256236 (RM), NMV P256237 (LM), NMV P256238 (P), NMV P256239 (RM), NMV P256240 (P), NMV P256241 (RM), NMV P256242 (RM), NMV P256243 (F), NMV P256244 (3 LM, RM), NMV P256245 (LM), NMV P256246 (3 LM), NMV P256247 (F), NMV P256248 (LM), NMV P256249 (RM), NMV P256250 (RM), NMV P256251 (LM), NMV P256252 (F), NMV P256253 (F), NMV P256254 (P), NMV P256255 (F), NMV P256256 (RM), NMV P256257 (LM), NMV P256258 (RM), NMV P256259 (RM), NMV P256260 (RM), NMV P256261 (2 RM), NMV P256262 (F), NMV P256263 (LM), NMV P256264 (LM), NMV P256265 (RM), NMV P256266 (RM), NMV P256267 (P), NMV P256268 (RM), NMV P256269 (RM), NMV P256270 (P), NMV P256271 (LM), NMV P256272 (2 RM), NMV P256273 (RM), NMV P256274 (RM), NMV P256275 (LM), NMV P256276 (LPM), NMV P256277 (2 RM), NMV P256278 (2 P), NMV P256279 (RM), NMV P256280 (LM), NMV P256281 (LPM), NMV P256282 (LM), NMV P256283 (RM), NMV P256284 (2P), NMV P256285 (RM), NMV P256286 (RM), NMV P256287 (RM), NMV P256288 (LM), NMV P256289 (RM), NMV P256290 (RM), NMV P256291 (LM), NMV P256292 (LM), NMV P256293 (RM), NMV P256294 (LM), NMV P256295 (LM), NMV P256296 (RM), NMV P256297 (RM), NMV P256298 (LM), NMV P256299 (LM, LPM), NMV P256300 (RM), NMV P256302 (RM), NMV P256306 (RM), NMV P256307 (LM), NMV P256309 (LM), NMV P256312 (LM), NMV P256313 (2 LM), NMV P256316 (RM), NMV P256317 (LM), NMV P256321 (2 LM), NMV P256327 (2 LM), NMV P256331 (LM), NMV P256332 (LM), NMV P256334 (RM), NMV P256335 (RM), NMV P256341 (RM), NMV P256345 (RM), NMV P256349 (RM), NMV P256350 (RM), NMV P256352 (LM), NMV P256354 (LM), NMV P256358 (RM), NMV P256362 (RM), NMV P256387 (LPM), NMV P256410 (LM).
Subfamily EGERNIINAE Welch, Citation1982
Diagnosis—Dentary, with closed Meckelian groove (Greer, Citation1979) with splenial notch possessing a large elongate IAF positioned relatively low and anteriorly (Hutchinson, Citation1992). This contrasts with members of the Eugongylinae, which show a smaller splenial notch (Martin et al., Citation2004).
Comparative Specimens—Specimens SAMA R3433H (Egernia depressa); SAMA R30528 (Egernia stokesii); SAMA R26891 (Egernia striolata); SAMA R10301D, SAMA R12873A, SAMA R37707, SAMA R25245 SAMA R23195 (Liopholis multiscutata); SAMA R23195, SAMA 23746, SAMA R35691, NMV D66485, SAMA R34886 (Liopholis whitii); SAMA R47694 (Lissolepis conventryi); SAMA R67504, SAMA R67631 (Tiliqua nigrolutea); SAMA R27024 (Tiliqua rugosa); NMV D72278 (Tiliqua scincoides).
EGERNIINAE indet.
Referred Specimens—Specimens NMV P254448 (RD), NMV P254678 (RD), NMV P254597 (RD), NMV P254637 (LD), NMV P256190 (LD), NMV P256208 (LD), NMV P256209 (RD), NMV P256191 (LD).
Comment—The specimens listed above could be assigned to Egerniinae, based on showing a closed Meckelian groove and large splenial notch, and resemble the size of those specimens assigned to the genus Liopholis. However, the specimens are weathered, so that the position of the IAF along the dentary could not be determined.
Genus TILIQUA Gray, Citation1825
Diagnosis—Tiliqua can be identified based on the following synapomorphic characters:
Dentary: within Egerniinae and possesses more than one enlarged durophagous tooth posterior to position 10 as well as an enlarged and flattened coronoid process (Shea, Citation1990). In contrast, Cyclodomorphus shows a single, massively enlarged cheek tooth (see Shea and Hutchinson, Citation1992; Hocknull, Citation2009).
Maxilla: heterodont dentition with markedly enlarged posterior durophagous tooth at position 7 or 8 (Shea, Citation1990). While Cyclodomorphus also shows a single, massively enlarged and rounded posterior tooth, the size of this tooth is much greater in Cyclodomorphus (see Hocknull, Citation2009).
Specimens in our comparative dataset are consistent with these characters.
TILIQUA NIGROLUTEA Quoy and Gaimard, Citation1824
Referred Specimens—Specimens NMV P254354 (LD), NMV P254415 (RM).
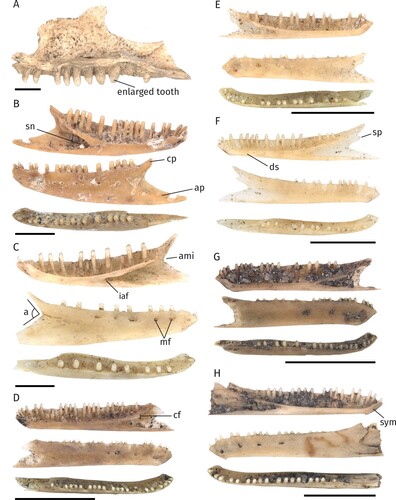
Diagnosis—Tiliqua nigrolutea () possesses anterior-posteriorly compressed teeth, all other Tiliqua species do not (see, e.g., Hollenshead et al., Citation2011). Specimens in our comparative dataset are consistent with this character.
Genus LIOPHOLIS Fitzinger, Citation1843
FIGURE 2. Different morphotypes of the Egerniinae and Eugongylinae subfamilies. Scale bars equal 2.5 mm. A, right maxilla of Tiliqua nigrolutea (NMV P254415) in medial view. B, left dentary of Liopholis sp. morph 1 (NMV P254587). C, right dentary of Liopholis sp. morph 2 (NMV P256193). D, right dentary of Eugongylinae indet. morph 1 (NMV P256348). E, left dentary of Eugongylinae indet. morph 2 (NMV P254639). F, right dentary of Eugongylinae indet. morph 3 (NMV P256359). G, right dentary of Eugongylinae indet. morph 4 (NMV P256336). H, left dentary of Eugongylinae indet. morph 5 (NMV P254379). B–H, lingual, labial and occlusal views (from top to bottom). Abbreviations: a, angle formed by the intersection of the posterior margins of the dorsal and angular processes; ami, anterior-most inflection between the coronoid process and the angular process; ap, angular process; cf, coronoid facet; cp, coronoid process; ds, dental sulcus; iaf, inferior alveolar foramen; mf, mental foramina; sn, splenial notch; sp, surangular process; sym, symphysis.
Diagnosis—Liopholis can be distinguished from other members of the Egerniinae based on features described by Hollenshead et al. (Citation2011). All Liopholis species show narrow pillar-like teeth, a v-shaped splenial notch and the IAF is positioned posterior of the midway point along the dentary (Hollenshead et al., Citation2011). In contrast, Lissolepis has robust pillar-like teeth, a v-shaped splenial notch and the IAF is positioned midway along the dentary (Hollenshead et al., Citation2011). Egernia species possess flared tooth crowns a v-shaped splenial notch and the IAF is positioned anterior of the midway point along the dentary (Hollenshead et al., Citation2011). Specimens included in our comparative sample are consistent with these characters.
LIOPHOLIS sp. (MORPH 1)
Referred Specimens—Specimens NMV P254587 (LD), NMV P254593 (RD), NMV P254655 (LD), NMV P256183 (RD), NMV P256182 (LD), NMV P256188 (LD, RD), NMV P256118 (LD).
Description—Dentaries of this Liopholis morph () possess a v-shaped splenial notch and 21 tooth positions. The splenial notch reaches to ventral of the 4th–5th tooth position. The dorsal margin of the coronoid process is straight and the dorsal margin of the angular process is concave. The subdental shelf is thick. The anterior-most inflection between the coronoid process and the angular process is positioned higher than midway of the dentary height measured from the tip of the coronoid process. The gap of the posterior-most mental foramen and the next is wider than the gap between the other foramina. The angle formed by the intersection of the posterior margins of the dorsal and angular processes measures about 90°. The coronoid facet does not show a distinct step.
Discussion—Within our comparative sample the specimens most closely resemble comparative specimens of Liopholis multiscutata regarding the shape of the splenial notch, a concave dorsal margin of the angular process, the gap of the posterior-most mental foramen to the next being wide, a thick subdental shelf and a large overall dentary height. It differs from the second Liopholis morph by an overall more robust appearance (thicker subdental shelf, larger dentary height), shape of the dorsal margin of the angular process and the gap of the posterior-most mental foramen to the next ().
LIOPHOLIS sp. (MORPH 2)
Referred Specimens— Specimens NMV P254405 (LD, RD), NMV P256186 (LD), NMV P256184 (LD), NMV P256193 (RD), NMV P256192 (LD), NMV P256117 (LD, RD).
Description—This Liopholis morph () shows 20–21 tooth positions. The splenial notch is v-shaped and reaches to ventral of the 6th–7th tooth position. The dorsal margin of the coronoid process is concave, while the dorsal margin of the angular process is straight. The coronoid process is steeper and longer compared with the Liopholis morph 1. The dentaries show seven mental foramina and in some of the fossils the 4th and 5th foramen appear to be fused. The anterior-most inflection between the coronoid process and the angular process is positioned approximately midway of the dentary height measured from the tip of the coronoid process. The gap of the posterior-most mental foramen and the next is about the same length as the gaps between the other foramina. The angle formed by the intersection of the posterior margins of the dorsal and angular processes measures about 90°. The coronoid facet does not show a distinct step.
Discussion—Within our comparative sample the specimens most closely resemble comparative specimens of Liopholis whitii regarding the shape of the splenial notch, a straight dorsal margin of the angular process, the gap of the posterior-most mental foramen to the next, a steep coronoid process, a thinner subdental shelf and an overall less robust appearance compared with Liopholis morph 1 (). Since our comparative sample included only two (out of 11) Liopholis species and did not allow for a thorough examination of intraspecific variation, it remains unknown if the two morphs observed in the deposit represent distinct species.
Subfamily EUGONGYLINAE Welch, Citation1982
Diagnosis—Members of the Eugongylinae show a closed Meckelian groove, while the splenial notch is smaller compared with members of the Egerniinae (Martin et al., Citation2004).
Comparative Specimens— Specimens SAMA R35624 (Acritoscincus duperreyi); SAMA R35610 (Anepischetosia maccoyi); SAMA R35623 (Carinascincus coventryi); SAMA R35612 (Lampropholis guichenoti); SAMA R44356 (Lampropholis delicata); SAMA R35620 (Morethia obscura); NMV D67407, SAMA R35589, SAMA R 35590 (Pseudemoia entrecasteauxii); SAMA R35594, SAMA R47695 (Pseudemoia pagenstecheri); SAMA R35596, SAMA R35597 (Pseudemoia rawlinsoni).
EUGONGYLINAE indet.
Referred Specimens—Specimens NMV P254382 (LD), NMV P254397 (RD), NMV P254477 (LD), NMV P254580 (RD), NMV P254633 (LD), NMV P254652 (RD), NMV P254662 (LD), NMV P256180 (2 LD), NMV P256181 (LD), NMV P256185 (RD), NMV P256187 (RD), NMV P256189 (LD), NMV P256301 (LD), NMV P256311 (LD), NMV P256315 (RD), NMV P256320 (LD), NMV P256322 (LD), NMV P256323 (LD), NMV P256324 (RD), NMV P256328 (LD), NMV P256329 (LD), NMV P256333 (RD), NMV P256342 (RD), NMV P256343 (LD), NMV P256344 (RD), NMV P256350 (LD), NMV P256351 (LD), NMV P256353 (RD), NMV P256361 (LD), NMV P256362 (LD), NMV P256363 (LD).
Comment—The specimens listed above could be assigned to Eugongylinae based on showing a closed Meckelian groove and a small splenial notch but are too weathered for further taxonomic assignment.
EUGONGYLINAE indet. (sp. MORPH 1)
Referred Specimens—Specimens NMV P256304 (RD), NMV P256347 (LD), NMV P256348 (RD).
Description—The small dentaries of this member of the Eugongylinae () show a rounded anterior margin of the splenial notch (u-shaped). The splenial notch reaches up to ventral of the 4th tooth position. The homodont tooth row bears 26–27 tooth positions. The dorsal margin of the coronoid process is straight, while the dorsal margin of the angular process appears slightly convex. The dentaries show four mental foramina, with the gap of the posterior-most mental foramen and the next being narrower than the gaps between the other foramina. The angle formed by the intersection of the posterior margins of the dorsal and angular processes measures less than 90°. The coronoid facet shows a distinct step ventral of the posterior-most tooth. A surangular process is present.
Discussion—This morphotype could not be matched exactly to any of the comparative specimens. Tooth count matches those of the examined Lampropholis spp., Pseudemoia rawlinsoni, P. pagenstecheri, and Morethia obscura. However, homodont dentition, the presence of a distinct step on the coronoid facet and tooth shape most closely resemble those of the examined Lampropholis species. All other examined eugongyline species do not show a distinct step on the coronoid facet. However, this character is hard to code in articulated comparative specimens and needs further investigation. This morph differs from all other morphs in the deposit by showing a larger number of teeth ().
EUGONGYLINAE indet. (sp. MORPH 2)
Referred Specimens—Specimens NMV P254426 (RD), NMV P254442 (LD), NMV P254446 (RD), NMV P254490 (RD), NMV P254635 (LD), NMV P254657 (RD), NMV P254358 (LD), NMV P254632 (RD), NMV P254440 (RD, LD), NMV P254639 (LD), NMV P254384 (RD), NMV P256356 (RD), NMV P256339 (LD), NMV P256357 (LD), NMV P256337 (LD), NMV P256210 (RD), NMV P256068 (LD).
Description—The splenial notch of this morph () is u-shaped and reaches up to ventral of the 5th–6th tooth position. The toothrow bears 24–25 tooth positions and the tooth crowns are sharp and pointed. The dorsal margins of the coronoid and angular processes are straight. The dentaries show 4–5 mental foramina, with the gap of the posterior-most mental foramen and the next being narrower than gaps between the other foramina. The anterior-most inflection between the coronoid process and the angular process is positioned lower than midway of the dentary height measured from the tip of the coronoid process. The angle formed by the intersection of the posterior margins of the dorsal and angular processes measures less than 90°. The coronoid facet does not show a distinct step. A surangular process is present.
Discussion—Within our comparative sample, the specimens most closely match comparative specimens of Pseudemoia spp. and Carinascincus coventryi, regarding tooth count. The pointed tooth shape and the shape of the coronoid and angular processes match those of the examined Pseudemoia spp., and in addition, the position of the anterior-most inflection between the coronoid and angular process matches P. entrecasteauxii. In contrast, C. coventryi shows concave dorsal margins of coronoid and angular processes. The size of the splenial notch (reaching to ventral of the 6th tooth position) is in the range of C. coventryi and P. pagenstecheri and P. entrecasteauxii. The gap of the posterior-most mental foramen to the next does not match either Pseudemoia spp. or C. coventryi. Within the deposit, this morph shows similar tooth count to the unidentified Eugongylinae morph 3; however, the two morphs can be distinguished by the shape of the dorsal margin of the angular and coronoid processes and the gap of the posterior-most mental foramen to the next ().
EUGONGYLINAE indet. (sp. MORPH 3)
Referred Specimens—Specimens NMV P254378 (LD), NMV P254400 (RD), NMV P254406 (RD), NMV P254420 (RD), NMV P254653 (LD, RD), NMV P254488 (LD), NMV P256067 (RD), NMV P256326 (LD), NMV P256359 (RD), NMV P256338 (LD), NMV P256303 (LD), NMV P256360 (LD), NMV P256330 (LD), NMV P256318 (LD).
Description—The splenial notch of this morph () is u-shaped and reaches up to the 5th–6th tooth position. The dentaries bear 24–25 tooth positions. The bone beneath the dental sulcus narrows anteriorly. The dorsal margin of the angular process is convex, while the dorsal margin of the coronoid process is concave. The gap of the posterior-most mental foramen and the next is about the same length than gaps between the other foramina. The anterior-most inflection between the coronoid process and the angular process is positioned lower than midway of the dentary height measured from the tip of the coronoid process. The angle formed by the intersection of the posterior margins of the dorsal and angular processes measures less than 90°. The coronoid facet does not show a distinct step. A surangular process is present.
Discussion—This morph could not be matched to any of the comparative specimens (of the comparative eugongyline specimens none showed the distinct combination of a concave dorsal margin of the coronoid process and a convex dorsal margin of the angular process). Within the deposit, the morph differs from Eugongylinae morph 2 by the shape of the dorsal margin of the angular and coronoid processes, the shape of the surangular process, which is wider in this morph, and the gap of the posterior-most mental foramen to the next. Tooth count, tooth shape and overall size are similar to Eugongylinae morph 2 ().
EUGONGYLINAE indet. (sp. MORPH 4)
Referred Specimens—Specimens NMV P254576 (LD), NMV P256310 (RD), NMV P256336 (RD), NMV P256305 (RD), NMV P256340 (RD), NMV P256314 (RD).
Description—This morph represents a very small member of the Eugongylinae (). The splenial notch is v-shaped and reaches up to the 3rd–4th tooth position. The toothrow bears 21 tooth positions. The teeth are wider posteriorly and the tooth shape is pointed at the crown. The height of the dentary appears similar along the toothrow. The dorsal margin of the coronoid process is straight, while the dorsal margin of the angular process seems broken in all specimens. Four mental foramina are present, with the gap of the posterior-most mental foramen and the next being wider than between the other foramina. The angle formed by the intersection of the posterior margins of the dorsal and angular processes seems to measure less than 90°, but this character is difficult to determine due to the broken angular processes. A surangular process is absent. The coronoid facet shows a distinct step.
Discussion—This morph could not be matched to any of the comparative specimens but differs from all other eugongyline morphs by showing fewer teeth in combination with a distinct coronoid facet step ().
EUGONGYLINAE indet. (sp. MORPH 5)
Referred Specimens—Specimens NMV P254379 (LD), NMV P254425 (2 LD, RD), NMV P256308 (RD), NMV P256346 (RD), NMV P256355 (RD), NMV P256325 (RD), NMV P256319 (LD).
Description—This morph () shows 22 tooth positions with posterior teeth being slightly wider. The tooth crowns are pointed. The splenial notch is somewhat v-shaped and reaches up to the 5th tooth position. The bone beneath the dental sulcus is narrow anteriorly. The symphysis shows a distinct process ventrally, while the dentary is overall straight. The dorsal margins of coronoid and angular processes are broken in all specimens. Four mental foramina are present, with the gap of the posterior-most mental foramen and the next about the same as between the other foramina. The angle formed by the intersection of the posterior margins of the dorsal and angular processes seem to measure less than 90°. The coronoid facet does not show a distinct step.
Discussion—This morph could not be matched to any of the comparative specimens (Acritoscincus duperreyi showed a similar tooth count, but no ventral process on the symphysis and different shape and size of the splenial notch). It differs from all other morphotypes in the deposit by showing a process ventral of the symphysis and by having a lower tooth count in combination with the absence of a distinct step of the coronoid facet ().
Subfamily SPHENOMORPHINAE Welch, Citation1982
Diagnosis—Most members of the Sphenomorphinae retain an open Meckelian groove of the dentary although convergent losses of this plesiomorphic condition occurred several times within this group (Martin et al., Citation2004).
Comparative Specimens—Specimens SAMA R35649, SAMA R67539 (Ctenotus robustus); UMMZ 242324 (Ctenotus schomburgkii, CT scan); SAMA R47696 (Eulamprus heatwolei); SAMA R51079 (Eulamprus quoyii); SAMA R35673, NMV D66293, NMV D66271 (Eulamprus tympanum); SAMA R35658 (Hemiergis perronii); SAMA R03240, SAMA R35662 (Lerista bougainvillii).
SPHENOMORPHINAE indet.
Referred Specimens—Specimens NMV P254374 (LD), NMV P254385 (RD), NMV P254387 (RD), NMV P254416 (RD), NMV P254443 (RD), NMV P254444 (LD), NMV P254471 (RD), NMV P254491 (LD), NMV P254582 (2 RD), NMV P254625 (LD), NMV P254644 (RD), NMV P256112 (RD), NMV P256120 (RD), NMV P256194 (LD), NMV P256364 (2 LD), NMV P256365 (LD), NMV P256366 (LD), NMV P256367 (LD, RD), NMV P256368 (RD), NMV P256369 (RD), NMV P256370 (RD), NMV P256371 (RD), NMV P256372 (RD), NMV P256373 (RD), NMV P256374 (RD), NMV P256375 (LD), NMV P256376 (2 RD), NMV P256377 (LD, RD), NMV P256378 (LD, RD), NMV P256380 (RD), NMV P256381 (3 LD), NMV P256382 (RD), NMV P256383 (2 LD), NMV P256384 (2 LD), NMV P256385 (RD), NMV P256386 (2 RD), NMV P256387 (LD), NMV P256388 (RD), NMV P256389 (LD), NMV P256390 (LD, RD), NMV P256391 (RD), NMV P256392 (RD), NMV P256393 (3 LD), NMV P256394 (2 RD), NMV P256395 (LD), NMV P256396 (LD), NMV P256397 (LD), NMV P256398 (LD), NMV P256399 (RD), NMV P256400 (2 RD), NMV P256401 (RD), NMV P256402 (LD), NMV P256403 (LD), NMV P256417 (RD), NMV P256423 (RD), NMV P256429 (RD), NMV P256430 (LD), NMV P256431 (LD), NMV P256432 (RD).
Comment—The above listed specimens could be assigned to Sphenomorphinae based on showing an open Meckelian groove but were too weathered to allow further taxonomic assignment.
SPHENOMORPHINAE indet. (sp. MORPH 1)
Referred Specimens—Specimens NMV P254665 (LD), NMV P254395 (RD), NMV P254412 (LD), NMV P254581 (RD), NMV P254666 (LD, RD), NMV P256113 (RD), NMV P256198 (RD), NMV P256427 (LD), NMV P256114 (LD, RD), NMV P256115 (RD).
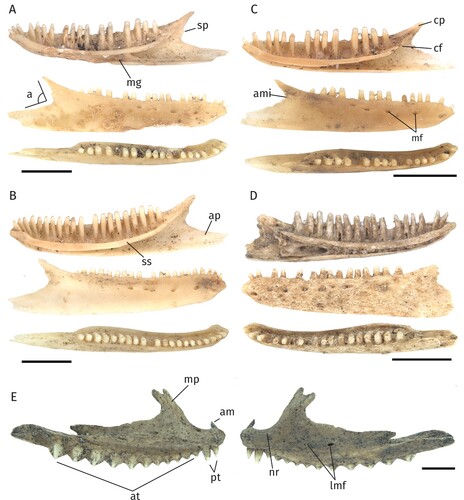
Description—This member of the Sphenomorphinae () shows an open Meckelian groove and 21–22 tooth positions, including two smaller teeth posteriorly. The dorsal margin of the coronoid process is straight, while the dorsal margin of the angular process is slightly concave. The anterior-most inflection between the coronoid process and the angular process is positioned approximately midway of the dentary height measured from the tip of the coronoid process. Six mental foramina are present, with the 4th and 5th mental foramen being positioned closely together. The angle formed by the intersection of the posterior margins of the dorsal and angular processes measures about 90°. The coronoid facet does not show a distinct step. A small, but distinct surangular process is present.
FIGURE 3. Different morphotypes of the Sphenomorphinae and Amphibolurinae subfamilies. Scale bars equal 2.5 mm. A, right dentary of Sphenomorphinae indet. morph 1 (NMV P 254385). B, right dentary of Sphenomorphinae indet. morph 2 (NMV P254452). C, right dentary of Sphenomorphinae indet. morph 3 (NMV P254381). D, left dentary of Sphenomorphinae indet. morph 4 (NMV P254491). E, left maxilla of Amphibolurinae indet. morph 1 (NMV P254682), medial (left) and lateral (right) aspects. A–D, lingual, labial and occlusal views (from top to bottom). Abbreviations: a, angle formed by the intersection of the posterior margins of the dorsal and angular processes; am, anterior margin of the maxilla; ami, anterior-most inflection between the coronoid process and the angular process; ap, angular process; at, acrodont teeth; cf, coronoid facet; cp, coronoid process; lmf, labial maxillary foramina; mg, Meckelian groove; mf, mental foramina; mp, maxillary process; nr, naris ridge; pt, pleurodont teeth; sp, surangular process; ss, subdental shelf.
Discussion—Within our comparative sample the specimens most closely resemble comparative specimens of Eulamprus tympanum regarding shape of coronoid and angular processes, close proximity of the 4th and 5th mental foramen, a distinct surangular process and tooth count. It can clearly be distinguished by tooth count from Eulamprus quoyii (26), Lerista bougainvillii (14–17), and Hemiergis peronii (18). This taxon further differs from Ctenotus robustus by the shape of the dorsal margin of the angular process (convex in C. robustus), the presence of a surangular process (absent in C. robustus) and the number of mental foramina (4–5 in C. robustus). In both examined Ctenotus species, the anterior-most inflection between the coronoid process and the angular process is positioned higher than midway of the dentary height measured from the tip of the coronoid process (see also Gelnaw, Citation2011). In several Ctenotus species (C. labillardieri, C. mimetes, C. schomburgkii, C. severus) the Meckelian groove is further fused into a canal for part of its length (Gelnaw, Citation2011).
SPHENOMORPHINAE indet. (sp. MORPH 2)
Referred Specimens—Specimens NMV P254371 (RD), NMV P254452 (LD, RD), NMV P254645 (LD), NMV P256428 (LD), NMV P256426 (RD), NMV P256424 (RD), NMV P256425 (RD), NMV P256416 (RD).
Description—The dentaries bear 21 tooth positions (). The subdental shelf is symmetrically curved. Posterior teeth show an anterior-posterior compression and are slightly thicker. The dorsal margin of the coronoid process is straight, while the dorsal margin of the angular process is concave. The anterior-most inflection between the coronoid process and the angular process is positioned approximately midway of the dentary height measured from the tip of the coronoid process. There are six mental foramina present, with the 4th and 5th mental foramen being positioned closely together. The angle formed by the intersection of the posterior margins of the dorsal and angular processes measures about 90°. The coronoid facet does not show a distinct step. The surangular process is very small and round (absent in one of our comparative specimens, ).
Discussion—Within our comparative sample the specimens most closely resemble comparative specimens of Eulamprus heatwolei regarding shape of the coronoid and surangular processes, close proximity of the 4th and 5th mental foramen, a very reduced, almost absent surangular process, tooth count and symmetrical curving of the subdental shelf. The fossils differ from Ctenotus robustus by the shape of the dorsal margin of the angular process, the number of mental foramina, and from C. robustus and C. schomburgkii by the height of the anterior-most inflection between the coronoid process and the angular process and symmetrical curving of the subdental shelf.
SPHENOMORPHINAE indet. (sp. MORPH 3)
Referred Specimens—Specimens NMV P254411 (RD), NMV P254419 (LD, RD), NMV P254421 (LD), NMV P254430 (LD), NMV P254434 (2 RD), NMV P254435 (LD), NMV P254447 (LD, RD), NMV P254460 (2 RD), NMV P254462 (LD), NMV P254476 (2 LD), NMV P254482 (LD), NMV P254577 (RD), NMV P254628 (LD), NMV P254634 (LD, RD), NMV P254579 (2 RD), NMV P254362 (RD), NMV P254381 (LD, RD), NMV P254394 (RD), NMV P256406 (RD), NMV P256404 (LD), NMV P256412 (LD), NMV P256409 (LD), NMV P256411 (LD), NMV P256408 (RD), NMV P256413 (LD), NMV P256407 (LD, RD), NMV P256418 (RD), NMV P256419 (LD), NMV P256420 (LD), NMV P256414 (LD), NMV P256405 (RD), NMV P256415 (LD), NMV P256422 (RD), NMV P256421 (LD).
Description—In this morphotype () the Meckelian groove almost closes in the middle of the dentary. The teeth show a clear size difference (being wider at the posterior part of dentary). Eighteen tooth positions are present. The dorsal margin of the coronoid process is slightly concave, while the dorsal margin of the angular process is straight to slightly concave. The anterior-most inflection between the coronoid process and the angular process is positioned higher than midway of the dentary height measured from the tip of the coronoid process. The gap of the posterior-most mental foramen and the next is narrower than the gaps between the other foramina. The angle formed by the intersection of the posterior margins of the dorsal and angular process measures less than 90°. The coronoid facet does not show a distinct step.
Discussion—Within our comparative sample, the specimens most closely resemble comparative specimens of Hermiergis peronii regarding tooth count, shape of the coronoid and angular processes, a narrow Meckelian groove, the gap of the posterior-most mental foramen and the next being narrow and the anterior-most inflection between coronoid process and angular process positioned higher than midway. This morph can be distinguished from most sphenomorphine morphs of the deposit by showing a lower tooth count (). In our comparative sample only Lerista bougainvillii shows fewer tooth positions (14–17) but possesses durophagous teeth and shows a distinct step on the coronoid facet.
SPHENOMORPHINAE indet. (sp. MORPH 4)
Referred Specimens—Specimens NMV P256119 (2 LD), NMV P256121 (LD), NMV P256379 (LD).
Description—This morph () is somewhat indistinctive due to poor preservation of all four dentaries. It shows 18 tooth positions and is slightly larger than the Sphenomorphinae morph 3. In contrast to Sphenomorphinae morph 3 the Meckelian groove is more open and seven mental foramina are present. The dorsal margin of the coronoid process appears to be straight. The anterior-most inflection between the coronoid process and the angular process is positioned higher than midway of the dentary height measured from the tip of the coronoid process. The gap of the posterior-most mental foramen and the next is about the same length as between the other foramina.
Discussion—This morph could not be matched to specimens within our comparative sample and differs from Sphenomorphinae morph 3 by the shape of the coronoid process, the number of mental foramina, size and shape of the Meckelian groove and the gap of the posterior-most mental foramen to the next ().
Family AGAMIDAE Hardwicke and Gray, Citation1827
Diagnosis—Acrodontans can be identified based on acrodont dentition on their maxillae and dentaries with anterior-most pleurodont dentition (Cooper et al., Citation1970; Hocknull, Citation2002). All Australian agamid species belong to the subfamily Amphibolurinae (Uetz et al., Citation2020).
Comparative Specimens—Specimens SAMA R152464, SAMA R 154972 (Amphibolurus muricatus, CT scan); SAMA R60767 Amphibolurus norrisi, CT scan); SAMA R66958, NMV NMV D52690 (Pogona vitticeps); D73576 (Pogona barbata); NMV D899t (Rankinia diemensis, CT scan).
Subfamily AMPHIBOLURINAE Wagler, Citation1830
AMPHIBOLURINAE indet.
Referred Specimens—Specimens NMV P254681 (RD), NMV P254686 (LD), NMV P254370 (RD).
Comment—The specimens listed above could be assigned to Amphibulorinae based on showing acrodont dentition but are too weathered for further taxonomic assignment.
AMPHIBOLURINAE indet. (sp. MORPH 1)
Referred Specimens—Specimens NMV P254682 (LM), NMV P254683 (RM), NMV P254685 (LM).
Description—The fossil maxillae () show two pleurodont teeth of unequal size with the first pleurodont tooth being smaller (about 2/3 the size of the second pleurodont tooth). There are 12 acrodont teeth present. The tooth row is symmetrically rounded. The naris ridge is not well developed, and the dorsal maxillary process is relatively slim and shows a slight mid-kink. The anterior margin of the maxilla is distinctly hooked, and five maxillary foramina are present.
Comment—Hocknull (Citation2002) compared agamid maxillae and dentaries and divided Amphibolurus in two groups based on several characters (Amphibolurus group 1, including A. muricatus, A. nobbi nobbi and A. nobbi coggeri and group 2, including only A. norrisi). However, molecular analyses showed that A. nobbi is nested within the genus Diporiphora (e.g., Schulte et al., Citation2003) and Edwards and Melville (Citation2011) suggested synonymizing D. nobbi coggeri with D. nobbi nobbi. Maxillae of the first group show two pleurodont teeth of unequal size and 13–14 (A. nobbi coggeri) and respectively 16–17 (A. muricatus and A. nobbi nobbi) acrodont teeth. The naris ridge is further not well developed, and the dorsal maxillary process is slim and shows a slight mid-kink. The anterior margin of the maxilla is distinctly hooked, and 3–4 labial maxillary foramina are present. Amphibolurus group 2 of Hocknull (Citation2002) including only A. norrisi, however, can be distinguished by the presence of three pleurodont teeth, 6–7 labial maxillary foramina, 13–14 acrodont teeth and a very broad maxillary process.
Discussion—The maxillae partly match the description of the Amphibolurus group 1 of Hocknull (Citation2002). However, the number of labial maxillary foramina as well as the number of acrodont teeth does not match either group 1 or group 2 of Hocknull (Citation2002). Within our comparative sample the specimens most closely resemble comparative specimens of Amphibolurus muricatus regarding the presence of two unequally sized pleurodont teeth, the number of acrodont teeth (which varied between 11–12 for A. muricatus in our comparative dataset), the presence of five labial maxillary foramina, a residual naris ridge, a slight mid kink of the maxillary process, a symmetrically rounded toothrow and a distinct hook at the anterior margin of the maxilla. The fossils can be distinguished from A. norrisi based on the width of the maxillary process, which is very broad in A. norrisi and the shape of the tooth row, which is more straight in A. norrisi. The fossils can further be distinguished from R. diemensis and the examined Pogona spp. by the presence of two unequally sized pleurodont teeth (the pleurodont teeth are of equal size in R. diemensis, P. vitticeps, and P. barbata; see also Hocknull, Citation2002). The two Pogona species also show a different shape of the maxillary process, being broad at the base and narrow dorsally, while the maxillary process of Rankinia is narrower overall and oriented more vertically in comparison to A. muricatus and A. norrisi.
Family ELAPIDAE Boie, Citation1827
Diagnosis—Snake maxillae and some isolated teeth found in the MDC deposit were assigned to Elapidae based on showing proteroglyph dentition (McCarthy, Citation1985; Scanlon et al., Citation2003). Palatines of ‘Hydrophiinae’ (a proposed subfamily within Elapidae containing terrestrial Australasian elapids and ‘true’ sea snakes; Fitzinger, Citation1843) lack maxillary and choanal processes and show a clasping articulation with pterygoids (Scanlon et al., Citation2003).
Comment—While Australian terrestrial elapids are closely related to the viviparous sea snakes, Pyron et al. (Citation2011) argued against the existence of subfamilies within Elapidae, as the traditional distinction into the subfamilies Elapinae, Hydrophiinae, and Laticaudinae (e.g., Vitt and Caldwell, Citation2009) was weakly supported. The morphological variation of the skeleton of elapids overlaps widely with Colubridae (Scanlon et al., Citation2003) and apomorphies for most individual bones are lacking. As such, fossil pterygoids and dentaries of MDC are referred to Elapidae based on their overall similarity to those of extant species in our comparative sample. In particular, the ectopterygoid process of the pterygoid of the examined elapids is more pronounced in comparison to Colubridae and Achrochordidae whereas pterygoids of Boidae are much wider and show a large mediolateral notch which is extending approximately across the posterior third of the bone. Palatines and pterygoids of typhlopids lack teeth (Kley, Citation2001). Regarding our comparative sample, elapid dentaries can be distinguished from Boidae and Colubridae by the lack of massively enlarged anterior teeth and additionally from Boidae, Acrochordidae and Typhlopidae by the position of the mental foramen which is located posterior of the midpoint between the anterior tip of the dentary and the anterior-most inflection between the coronoid and angular processes in elapids.
Comparative Specimens— (all CT scans) Specimens UMMZ 77800 (Acanthophis antarcticus); UMMZ 236575 (Acrochordus granulatus); UMMZ 170407 (Austrelaps labialis); UMMZ 190765 (Antaresia childreni); UMMZ 244028 (Boiga irreguaris); UMMZ 65349 (Dendrelaphis caudolineatus); UMMZ 132287 (Echiopsis curta); UMMZ 227833 (Morelia spilota), NMV D75415, UMMZ 65874 (Notechis scutatus); CAS 254647 (Parasuta gouldii); UMMZ 170403 (Pseudechis porphyriacus); NMV D77074 (Pseudonaja textilis); UMMZ 83512 (Ramphotyphlops polygrammicus); CAS 77735 (Suta suta).
ELAPIDAE indet.
Referred Specimens—Specimens NMV P254360 (LD, RD), NMV P254364 (RD), NMV P254365 (LM), NMV P254372 (LPT), NMV P254377 (RPL, RPT), NMV P254388 (RD), NMV P254393 (LD, 2 RD, LM, LPL, RPL), NMV P254408 (LM), NMV P254410 (LM), NMV P254418 (RM), NMV P254429 (LM), NMV P254437 (LM), NMV P254438 (LM), NMV P254439 (RM), NMV P254455 (RD), NMV P254456 (2 RM), NMV P254459 (LM, RD), NMV P254465 (RM), NMV P254466 (RM), NMV P254473 (RD), NMV P254474 (RM), NMV P254475 (LPL), NMV P254483 (LPL), NMV P254486 (RM), NMV P254492 (LM, LPL), NMV P254583 (RM), NMV P254584 (LM), NMV P254588 (LM), NMV P254590 (RM), NMV P254596 (RM), NMV P254599 (RM), NMV P254629 (2 RM), NMV P254636 (RM), NMV P254638 (LM, LPT), NMV P254646 (LM), NMV P254651 (LD, RPT), NMV P256122 (LPL), NMV P256123 (RPT), NMV P256124 (LM, LPL), NMV P256125 (T), NMV P256126 (LPL), NMV P256127 (LD), NMV P256128 (RPT), NMV P256129 (RPL), NMV P256130 (LPT), NMV P256131 (3 LD, LPL, RPL, LPT), NMV P256132 (RM), NMV P256133 (LM), NMV P256134 (LPT), NMV P256135 (RD), NMV P256136 (RM, RPT), NMV P256137 (RM, LPL, LPT), NMV P256138 (LM), NMV P256139 (2 LD), NMV P256140 (RD), NMV P256141 (2 RD), NMV P256142 (LPL), NMV P256143 (LPL, RPL), NMV P256144 (LM, RM), NMV P256145 (RD), NMV P256146 (RD), NMV P256147 (RPL), NMV P256148 (LM, 2 LPT), NMV P256149 (LPL, T), NMV P256150 (LM, RD), NMV P256151 (LD, 2 LPT, T), NMV P256152 (T), NMV P256153 (LD, LPL), NMV P256154 (LM, 2 LPL), NMV P256155 (RM), NMV P256156 (RD), NMV P256157 (RM), NMV P256158 (RD), NMV P256159 (LM, RD), NMV P256160 (LD), NMV P256161 (T), NMV P256162 (LM, LPL, LPT), NMV P256163 (LM, LPL, LPT), NMV P256164 (LPL), NMV P256165 (RM), NMV P256166 (LD, RM, T, LPT), NMV P256167 (LPL), NMV P256168 (RD, RPT), NMV P256169 (2 LPT), NMV P256170 (RPL), NMV P256171 (RM, T), NMV P256172 (LPT), NMV P256173 (T), NMV P256174 (LM), NMV P256175 (RPT), NMV P256176 (T), NMV P256177 (RM), NMV P256178 (LD), NMV P256179 (RM).
RESULTS
Taxonomy and Correspondence Analyses
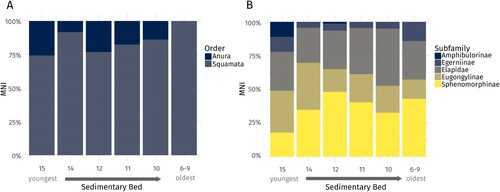
We identified 753 specimens with a minimum number of 677 individuals as either squamate (555) or anuran (122) across all beds of the deposit (). Of these, 345 could be identified to subfamily-level (including Elapidae), whereas morphotype-level identification of lizards was possible for 126 individuals. Using morphological features of the dentary, we identified 13 different lizard morphotypes of which nine resemble extant species (). Three eugongyline and one sphenomorphine morphotype did not resemble any extant species in our comparative sample.
TABLE 2. Abundances of taxa in the different sedimentary beds based on the minimum number of individuals (MNI) and number of identified specimens (NISP). Ages of the sedimentary beds are given in calibrated thousands of years ago (cal ka).
Rarefaction analyses indicated that some of the sedimentary beds (6–9 and 14) could likely yield additional taxa with increased sample size (Fig. S1). However, when excluding Amphibulorinae on subfamily-level, all sedimentary beds comprise representatives of the remaining four subfamilies.
We used correspondence analysis to analyze and ordinate the different sedimentary beds of the deposit based on taxonomic relative abundances on subfamily level of identification. Correspondence analysis allows both sedimentary beds and taxa (rows and columns of a two-way contingency table) to be plotted along the same axes. Our correspondence analyses showed similar results when using MNI or NISP (; Table S2). Four dimensions were determined from the data for our subfamily dataset with the first two dimensions accounting for ∼87% of the respective variation in both datasets (). In terms of taxonomic composition and relative abundance, beds 10 and 11 differ from beds 6–9, 12 and 14 in their position on dimension 2 across most datasets (, Fig. S2). Bed 15, the most recent sedimentary bed, differs from all other beds due to its position on dimension 1 and shows an intermediate position on dimension 2.
The main polarizing taxa are Elapidae and Sphenomorphinae when using NISP and Elapidae and Egerniinae when using MNI (). A high relative abundance of Elapidae is found in bed 10 (), and as such, Elapidae is positioned close to this bed in the correspondence analyses (). In contrast, the abundance of Egerniinae is higher in beds 6–9, 14 and 15 (, ), while the relative abundance of Eugongylinae peaks in beds 14 and 15. Sphenomorphinae are most abundant in bed 12 (, ). Amphibulorinae were only present in beds 12 and 15 in low numbers (, ).
FIGURE 5. A, relative abundances of order, and B, subfamily level of identification based on the minimum number of individuals (MNI) in the different sedimentary beds.
Influence of Paleoclimate on Herpetofaunal Composition
LOESS regressions, used to reconstruct climatic trends during the past 14 ka, showed an increase in sea surface temperature from ∼16.75°C to ∼18.25°C from 14–8 ka (). Temperature then remained stable and dropped slightly between 4–2 ka by about 0.5°C (). In contrast, the percentage of C4 grasses at Tower Hill dropped from ∼75% at around 12 ka to almost 0% at about 8 ka, indicating a major shift from a more arid to wetter climate in this period (). Between 8–4 ka aridity increased again (to ∼50–60% of C4 grasses), and then dropped between 4–2 ka to an intermediate level (∼25%; ). Thus, beds 6–9 and 14 may represent more arid periods, while beds 10 and 11 may instead represent fauna from a more mesic period. Beds 12 and 15 show intermediate aridity values.
FIGURE 6. A, LOESS (local regression) fits of temperature (red) and aridity (blue) showing predicted values for the ages of the different sedimentary beds (triangles). Optimal smoothing parameters based on generalized cross-validation: α = 0.72 (temperature), α = 0.61 (% C4 grasses). B, correlations (linear models) of the different dimensions of the subfamily-level correspondence analyses and relative abundances of taxa (% of the minimum number of individuals belonging to a respective subfamily in the different sedimentary beds) with temperature and aridity. Darker shaded graphs indicate significance of linear models (p < 0.05). Shaded areas represent 0.95 level confidence intervals.
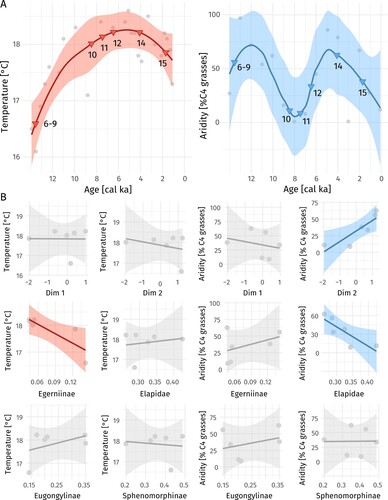
Linear models showed a significant correlation between correspondence dimension two of the subfamily-level dataset, which accounts for ∼16–28% of the variation in the data (depending on whether MNI or NISP is used to calculate relative abundances), and aridity (adjusted R² = 0.67; p = 0.028, ). Relative abundances of Egerniinae were significantly negatively correlated with temperature (adjusted R² = 0.62; p = 0.039, ), while relative abundances of Elapidae showed a significant negative correlation with aridity (adjusted R² = 0.61; p = 0.041, ). Relative abundances of frogs were not significantly correlated with either temperature or aridity (Table S3). The highest relative abundance of frogs was found in the most recent sedimentary bed, which shows intermediate levels of aridity and temperature ().
Comparison of Different Datasets
The results of the correspondence analyses were largely similar when Amphibolurinae were included or excluded (Fig. S2, Table S2), however, there was no correlation of dimension 2 of the correspondence analyses and aridity in a dataset using MNI and including Amphibolurinae (Table S3). A larger percentage of the variation is explained by dimension 1, which separates bed 15 from all other beds, if Amphibulorinae are included (Fig. S2). This result is probably because of the low overall number of amphibolurine specimens and their clustered occurrence in bed 15 (five out of the six specimens). When beds 6–9 were subsequently excluded from the analyses due to their low sample size, most correlations remained significant, while some turned marginally non-significant (Table S3). In addition, Sphenomorphinae showed a significant positive correlation with temperature in three out of four datasets excluding beds 6–9 (Table S3).
DISCUSSION
Temporal Changes in Abundance and Climatic Impacts
Examination of MDC deposits provides the first detailed record of fossil herpetofauna in Victoria, southeastern Australia. Observed changes in temperature and aridity during the last 14 ka, derived from the LOESS fits of independent data, are in accordance with conclusions drawn from the sediments of MDC (Kos, Citation2001) and other studies (Jennings, Citation1968; Dodson, Citation1974; Quigley et al., Citation2010), indicating flood events and increased rainfall in southeastern Australia some 7 ka, followed by a warmer and drier period. Based on our results, these climatic fluctuations appear to have affected the reptile (but not amphibian) diversity of MDC, with oscillations in aridity having a greater impact than temperature changes during the investigated period and across our datasets.
The differences of squamate subfamily abundances seem to group the layers of the deposit according to a gradient of aridity along dimension two of our correspondence analyses. These results were driven mainly by higher abundances of lizard subfamilies in more arid periods as well as higher abundances of Elapidae in less arid periods. Species richness of Elapidae was shown to be positively, but weakly, correlated with actual evapotranspiration (AET) in Australia (see Terribile et al., Citation2009). Although we analyzed relative abundances and not species richness, the association of elapid species richness with AET might indicate a possible use of this group as a proxy for local climate. In turn, the higher abundances of Elapidae (the only group of snakes found in the deposit) in less arid periods implies a lower relative abundance of lizards in these layers, also indicated by their respective positions on dimension two in the correspondence analyses. Lizard species richness peaks in arid regions throughout the world and was further shown to be negatively correlated with AET in Australia (e.g., Pianka, Citation1989; Powney et al., Citation2010; Ramm et al., Citation2018). While the causes of these large-scale phenomena are not fully understood, our results suggest that similar to large-scale species richness, lizard abundances are positively correlated with aridity throughout the MDC deposit. If these changes are due to true changes in species richness or due to an increase of abundance of certain species, however, remains speculative.
The Egerniinae of MDC are mainly represented by Liopholis, a genus of 11 skink species which are distributed throughout the arid and temperate zones of Australia (Chapple et al., Citation2008). Liopholis whitii, nowadays distributed in temperate southeastern Australia, is the only species of this genus found in the area surrounding MDC today and is likely present also in the deposit (). Liopholis multiscutata, the geographically next closest contemporary species, is only found several hundred km north of the deposit (Robertson and Conventry, Citation2019). There is little information on the effects of Quaternary climate change on Egerniinae in Australia, but interestingly, Chapple et al. (Citation2005) found substantial phylogeographic structuring within L. whitii, consistent with a greater, more continuous distribution in the past (including across the Bass Strait). This pattern was interpreted as an effect of Plio-/Pleistocene glacial cycles (Chapple et al., Citation2005). Chapple et al. (Citation2005) further suggested that the distribution of (extant) montane taxa in southeastern Australia could have generally been more continuous during the cold and dry glacial phases, as the habitat of these species might have shifted to lower elevations during that time (see also Knowles, Citation2000). A similar scenario was suggested by Smith (Citation1982), who was able to identify fossils of Tiliqua nigrolutea from the upper Pleistocene (Seton Rock Shelter deposit) of Kangaroo Island, indicating that the range of this species, which is nowadays distributed in the temperate zone of southeastern Australia, might have been greater during the more arid and cool conditions of the LGM until ∼10 ka, since it is nowadays absent on Kangaroo Island. These results suggest that the drier and cooler climatic periods of MDC may have provided a habitat especially suitable for temperate adapted Egerniinae, which could also explain the observed negative association of egerniine abundance with temperature. Yet, since we found two Liopholis morphotypes in the deposit, it might also be possible that cooler conditions facilitated the presence of more than one Liopholis species in the habitat surrounding the cave, which could have led to a higher overall abundance of Egerniinae.
The abundances of the Eugongylinae subfamily showed no correlation with our climate proxies but this group placed close to Egerniinae in the correspondence analyses, indicating similarity in their respective changes of abundances over time. Nowadays, eugongylines in the vicinity of the cave are exclusively represented by small, temperate adapted taxa with largely similar distributions throughout southeastern Australia (; Robertson and Coventry, Citation2019). Like for the southeastern Australian Liopholis or Tiliqua, the climatic conditions for modern eugongyline taxa of this region (or taxa with similar ecologies) might have been especially suitable in the area surrounding MDC during dry and cool phases (see also Smith, Citation1982).
Sphenomorphines place opposite of Egerniinae and Eugongylinae on dimension 1 of the correspondence analysis and are most abundant in sedimentary bed 12 which shows the highest temperature values based on our climate proxies. Sphenomorphines distributed in the area around the cave today include the temperate adapted Eulamprus tympanum, but also Hemiergis perronii and Lerista bougainvillii whose distributions expand further northwest (Owens and Graham, Citation2009). Especially H. perronii, for which the area around MDC is representing the southernmost part of its modern distribution, is adapted to warmer climates (Owens and Graham, Citation2009; Robertson and Coventry, Citation2019). A morphotype resembling H. perronii is the most abundant sphenomorphine in the deposit (with the highest abundance in sedimentary bed 12; ) and might thus explain the positioning of this group in the correspondence analysis close to the sedimentary bed for which we reconstructed the highest temperature, suggesting that the respective environmental conditions might have been suitable for this morph during the given time episode.
TABLE 3. Comparison of lizard taxa between the MDC deposit and contemporary habitat surrounding the cave (Robertson and Coventry Citation2019; ALA Citation2020).
Amphibulorinae are rare within the MDC deposit and represented by one morphotype, resembling Amphibolurus muricatus. Pepper et al. (Citation2014) showed that the phylogeographic structure within A. muricatus seems consistent with a restriction to hypothesized forest refugia during the more arid and cool glacial periods. While Amphibulorinae were not observed in the MDC deposit prior to ∼6.5 ka, and thus seem absent in the cool and dry period shortly before the Pleistocene/Holocene transition, the low number of amphibolurine specimens (n = 6) prevents a well-founded interpretation.
Interestingly frog abundance was neither correlated to temperature or aridity. Studies on Australian fossil frogs are generally rare, but for example, the description of the Pleistocene fossil frog fauna of Naracoorte Caves at about 32 ka (Tyler, Citation1977) revealed conspicuous differences from the modern-day fauna. Tyler (Citation1977) discusses the absence of members of the Litoria aurea complex and the presence of Geocrinia laevis, nowadays found only in the extreme southeast of South Australia, with respect to changing aridity in the late Pleistocene–Holocene. Thus, the ability in future research to confidently identify species to a lower-level taxonomic classification may reveal correlations with changing environmental conditions.
Lizard Morphotypes of MDC and Comparisons with Extant Fauna
Given the low percentage of fossils identified to morphotype level, comparisons of fossil and modern species richness as well as associations of individual morphotypes with climate remain difficult. The overall number of lizard morphotypes as well as taxonomic makeup of the deposit is comparable to the modern lizard fauna in the region surrounding MDC as derived from different sources (). However, given our limited comparative sample it remains unclear if the identified morphotypes indeed represent distinct species.
A major difference arising from the comparison with the extant fauna is an apparent absence of gecko and pygopod fossils in the MDC deposit. An absence of geckos and pygopods has further been reported for Victoria Cave (Naracoorte, South Australia; Smith, Citation1976) and the Seton Rock Shelter deposit (Kangaroo Island; Smith, Citation1982). Today, geckos or pygopods can be found in the vicinity of all these deposits (Owens and Graham, Citation2009; Cogger, Citation2014; Robertson and Coventry, Citation2019). It remains to be clarified whether this absence of fossils is related to real absence, taphonomic and/or sampling biases.
While we identified nine morphotypes that resemble taxa which are distributed in the area surrounding MDC today, four of the established morphotypes could not be matched with specimens in our comparative sample. On the other hand, several species that are present in the contemporary MDC habitat seem not represented by morphotypes in the deposit (differences are shown in ). These differences might reflect range shifts or extinctions but could likely be caused by sampling bias or poor preservation of fossil remains that prevent morphotype-level identification.
Besides climatic changes, human impacts potentially influenced distributions and abundances of small vertebrates during the late Pleistocene to Holocene of Australia. The youngest sedimentary bed we analyzed (1.8 ka) provides a record pre-dating European settlement, thus differences to the modern fauna might be caused by impacts of European settlers on the environment (e.g., Fusco et al., Citation2016). In particular, we report several unidentified morphotypes that occurred in both arid and wet periods, but do not resemble any extant species found in the area today. Similarly, Kos (Citation2003b) describes the occurrence of several mammal species throughout all sedimentary beds of the deposit that are absent from the contemporary habitat. The presence of unidentified lizard morphotypes and locally extinct mammal species in both arid and wet periods might indicate that climatic changes did not affect these species’ distributions throughout the late Pleistocene/Holocene. Instead, their absence in the vicinity of the cave today suggests a potential influence of European settlement on the fauna of MDC (see also Kos, Citation2003b). As described by Fusco et al. (Citation2016) for the Fleurieu Peninsula (located northwest of MDC in South Australia), European settlement drastically altered local vegetation (see also Dodson, Citation2001) and surface hydrology (Harding, Citation2005), leading to a decrease of wetland vegetation in the area. These environmental changes probably led to higher intensity fires and consequently a loss of local terrestrial non-volant mammal biodiversity of almost 50% (Fusco et al., Citation2016). Given the overlapping ecologies of small mammals and many herpetofauna, we hypothesize that the latter group may have also experienced similar impacts at the time.
Implications for Quaternary Community Change in Southeastern Australia
Overall, the results of our analyses suggest that changes in aridity and temperature over the last 14,000 years influenced relative abundances and distributions of reptile taxa in southeastern Australia, leading to gradual changes in community composition during this period. These findings add to the results of the few existing studies on changes of small vertebrate species diversity in southeastern Australia during the Quaternary (Wakefield, Citation1967, Citation1969, Citation1972; Flood, Citation1973; Smith, Citation1976, Citation1982; Hope et al., Citation1977; Baird, Citation1992), which we briefly discuss below.
Analyses of late Pleistocene to Holocene fossil birds and mammals of the Buchan region () indicated slight shifts in community composition with some (modern) mesic adapted species (which are nowadays absent from the region), being present in older sediments (Pyramids Cave, Baird, Citation1992; Clogg’s Cave, Hope, Citation1973; Flood, Citation1973).
A study on the Pleistocene reptiles of Victoria Cave at Naracoorte () found only slight shifts in relative abundances over time, while the only species recorded that is missing from the area today is the extinct giant madtsoiid Wonambi (Smith, Citation1976). Similarly, the mammal fauna of Henschke Fossil Cave, also located at Naracoorte, which is believed to have been filled between 40–32 ka, does not show any major community shifts (Pledge, Citation1990). Slight changes in relative abundance, however, may suggest a trend from a slightly wetter period towards a drier period with more open vegetation in the time covered by Henschke Fossil Cave (Pledge, Citation1990).
A faunal analysis including mammals, birds, reptiles, and mollusks by Hope et al. (Citation1977) on the Seton Rock Shelter deposit on Kangaroo Island () suggests a reduction of open grassland areas during the late Pleistocene. The presence of semi-arid and grassland species as well as species that are nowadays restricted to Tasmania and southern Victoria is consistent with colder and drier climate between 16–10 ka compared with today (Hope et al., Citation1977). Two skink species, namely Tiliqua rugosa and Tiliqua nigrolutea, were found in the deposit, but are absent from Kangaroo Island nowadays (Hope et al., Citation1977). Smith (Citation1982) describes the reptile fauna of the Seton Rock Shelter deposit in more detail, identifying also a large agamid possibly representing Pogona barbata, which is currently not found on Kangaroo Island. Since the distribution of Tiliqua nigrolutea is nowadays confined to cool temperate habitats, the range of this skink species might have been affected by changing aridity (Smith, Citation1982). However, Pogona barbata is considered a semi-arid species that inhabits open woodlands and shrublands, so the disappearance of this species from Kangaroo Island might be caused by the reduction of open habitats, which was possibly influenced simultaneously by the disappearance of humans from the island at ∼4 ka as well as increased precipitation during the Holocene (Smith, Citation1982).
Several hundreds of meters from MDC lies another fossil deposit, McEachern’s Cave. Wakefield (Citation1967, Citation1969) studied the fauna of McEachern’s Cave and described compositional changes of mammals, indicating a shift from wetter climate, at about 15 ka, towards a warm, arid period (‘mallee conditions’) at 6–5 ka, which is partly consistent with our results. His conclusions, however, were based on the presence of some arid adapted mammals in layers interpreted as post-Pleistocene, which were not found in MDC (see Wakefield, Citation1967; Kos, Citation2003b). Wakefield’s temporal and environmental interpretation of the sediments, based on the presence or absence of mammal remains and a single 14C date of 15.2 ka, was further questioned by different authors (see, e.g., Jennings, Citation1968, Pledge, Citation1990).
The general picture that emerges from reviewing data of small fossil vertebrates of southeastern Australian fossil sites during the late Pleistocene to Holocene is the occurrence of gradual changes in community composition, with changing aridity and the accompanied changes of the respective environments being considered an important factor by most authors. While changing aridity was likely responsible for complete community turnover in the Mt. Etna fossil site in Queensland during the Pleistocene (Hocknull et al., Citation2007), the results are not wholly comparable to those of MDC due to the different time spans covered by the deposits. However, studies on mammal remains from the Naracoorte and Nullabor fossil sites, covering a similar time span compared with Mt. Etna, found relative faunal stability throughout the middle to late Pleistocene (Prideaux et al., Citation2007a, Citation2007b). Although relative abundances and community composition of these sites changed in the course of glacial-interglacial cycles, most of the taxa found in Pleistocene deposits still occur in the area today (Prideaux et al., Citation2007a); a pattern observed also in the reptile fauna of Naracoorte as described earlier (Smith, Citation1976). It has been hypothesized that this faunal stability observed from middle/late Pleistocene to the present day might be an effect of an earlier onset of aridification in southern regions starting from 500–600 ka (e.g., Hocknull et al., Citation2007). Possibly southern taxa had more time to adapt to increasingly arid conditions, whereas the northern faunal community of Mt. Etna experienced a progressive aridification from about 300 ka (e.g., Hocknull et al., Citation2007). Although our study contributes additional evidence of greater faunal stability in southern compared with northern regions, it highlights the need for additional research across all regions to identify general patterns of Quaternary community change related to changing aridity in Australia.
CONCLUSION
Based on published osteological characters we were able to categorize ∼50% of the fossils into different subfamilies. Classification of lizard fossils into different morphotypes was possible for ∼30% of lizard specimens. These results mirror one of the biggest caveats in paleoherpetology, i.e., the lack of osteological apomorphies for isolated fossil remains of many reptile species. However, while identifications based on apomorphies are preferable, studies that applied this method to herpetofaunal remains often did not achieve species-level identifications (see, e.g., Bell et al., Citation2010). In the absence of alternative methods, for example, the use of geometric morphometrics for taxonomic or ecological identification (e.g., Lawing et al., Citation2012; Gray et al., Citation2017; Vermillion et al., Citation2018; Chaplin et al., Citation2019; Melville et al., Citation2019) our study shows that meaningful ecological patterns can be observed in the absence of species-level resolutions.
Despite common caveats of dealing with isolated fossil remains of squamates, faunal change seems to be detectable on relatively shallow timescales and broader taxonomic levels in this group. The present results suggest that gradual changes in community structure of the squamate assemblage of MDC have taken place during the Pleistocene/Holocene transition and present statistical evidence that these changes were likely related to fluctuating aridity. Our results further demonstrate the utility of the Australian herpetofaunal fossil record for investigating the impacts of climate change on ecological communities and may suggest the possibility for inferring changes in climate in deposits that lack independent ecological indicators.
Supplemental Material
Download PDF (984.9 KB)ACKNOWLEDGMENTS
We wish to thank M. Brown, H. K. Bullar, H. Gdak, A. Jin, Z. Kim, K. Natsume, R. Santosa, and W. Satasya for their invaluable help with sorting the material. We are grateful to T. Ziegler for providing access to the material, M. Hutchinson for help with reptile IDs and A. Kos for information on the stratigraphy of the deposit. We are thankful to F. Bibi and F. Blanco for discussions. C. A. H. was funded by an Australian Research Council DECRA (DE180100629), T. R. was supported by a doctoral scholarship of the German National Academic Foundation (Studienstiftung des deutschen Volkes), and K. M. T. was supported by an Australian Postgraduate Research Training Stipend. We thank M. Viteri, C. Jass and J. Mead for their helpful suggestions which greatly improved the manuscript.
LITERATURE CITED
- Ashton, K. G., and Feldman, C. R. 2003. Bergmanńs rule in nonavian reptiles: turtles follow it, lizards and snakes reverse it. Evolution, 57:1151–1163.
- Atlas of Living Australia. 2020. Available at http://www.ala.org.au. Accessed October 19, 2020.
- Baird, R. F. 1992. Fossil avian assemblage of pitfall origin from Holocene sediments in Amphitheatre Cave (G-2), south-western Victoria, Australia. Records of the Australian Museum 44:21–44.
- Bell, C. J., and J. I. Mead. 2014. Not enough skeletons in the closet: collections-based anatomical research in an age of conservation conscience. The Anatomical Record 297:344–348.
- Bell, C. J., J. A. Gauthier, and G. S. Bever. 2010. Covert biases, circularity, and apomorphies: a critical look at the North American Quaternary herpetofaunal stability hypothesis. Quaternary International 217:30–36.
- Bell, C. J., J. J. Head, and J. I. Mead. 2004. Synopsis of the herpetofauna from Porcupine Cave; pp. 117–126 in A. D. Barnosky (ed.), Biodiversity Response to Climate Change in the Middle Pleistocene: the Porcupine Cave Fauna from Colorado. University of California Press, Berkeley, California.
- Böhm, M., D. Cook, H. Ma, A. D. Davidson, A. García, B. Tapley, P. Pearce-Kelly, and J. Carr. 2016. Hot and bothered: using trait-based approaches to assess climate change vulnerability in reptiles. Biological Conservation 204:32–41.
- Boie, F. 1827. Bemerkungen über Merrem’s Versuch eines Systems der Amphibien. Erste Lieferung: Ophidier. Isis von Oken, 20, col. 508–566.
- Byrne, M., D. K. Yeates, L. Joseph, M. Kearney, J. Bowler, M. A. J. Williams, S. Cooper, S. C. Donnellan, J. S. Keogh, R. Leys, J. Melville, D. J. Murphy, N. Porch, K.-H. Wyrwoll. 2008. Birth of a biome: Insights into the assembly and maintenance of the Australian arid zone biota. Molecular Ecology 17:4398–4417.
- Byrne, M., D. A. Steane, L. Joseph, D. K. Yeates, G. J. Jordan, D. Crayn, K. Aplin, D. J. Cantrill, L. G. Cook, M. D. Crisp, J. S. Keogh, J. Melville, C. Moritz, N. Porch, J. M. K. Sniderman, P. Sunnucks, and P. H. Weston. 2011. Decline of a biome: Evolution, contraction, fragmentation, extinction and invasion of the Australian mesic zone biota. Journal of Biogeography 38:1635–1656.
- Chaplin, K., J. Sumner, C. A. Hipsley, and J. Melville. 2019. An integrative approach using phylogenomics and high-resolution X-ray computed tomography (CT) for species delimitation in cryptic taxa. Systematic Biology 69:294–307.
- Chapple, D. G., Keogh, J. S., and M. N. Hutchinson. 2005. Substantial genetic substructuring in southeastern and alpine Australia revealed by molecular phylogeography of the Egernia whitii (Lacertilia: Scincidae) species group. Molecular Ecology, 14:1279–1292.
- Chapple, D. G., Hutchinson, M. N., Maryan, B., Plivelich, M., Moore, J. A., and J. S. Keogh. 2008. Evolution and maintenance of colour pattern polymorphism in Liopholis (Squamata:Scincidae). Australian Journal of Zoology, 56:103.
- Cogger, H. G. 2014. Reptiles and amphibians of Australia. Seventh edition. CSIRO Publishing, Collingwood, Australia, 1033 pp.
- Conrad, J. L. 2008. Phylogeny and systematics of Squamata (Reptilia) based on morphology. Bulletin of the American Museum of Natural History 310:1–182.
- Cooper J. S., D. F. G. Poole, and R. Lawson. 1970. The dentition of agamid lizards with special reference to tooth replacement. Journal of Zoology 162:85–98.
- Daza, J. D., A. M. Bauer, C. Sand, I. Lilley, T. A. Wake, and F. Valentin. 2015. Reptile remains from Tiga (Tokanod), Loyalty Islands, New Caledonia. Pacific Science 69:531–557.
- Dodson J. R. 1974. Vegetation history and water fluctuations at Lake Leake, southeastern South Australia. I. 10 000 B.P. to Present. Australian Journal of Botany 22:719–741.
- Dodson, J. 2001. Holocene vegetation change in the Mediterranean-type climate regions of Australia. The Holocene 11:673–680.
- Duméril, A. M. C. (1806) Zoologie analytique, ou méthode naturelle de classification des animaux, rendue plus facile à l’aide de tableaux synoptiques. Paris, Allais, i–xxxiii + 1–544
- Edwards, D.L. and J. Melville. 2011. Extensive phylogeographic and morphological diversity in Diporiphora nobbi (Agamidae) leads to a taxonomic review and a new species description. Journal of Herpetology 45:530–546.
- Estes, R. 1983. Handbuch der Paläoherpetologie—Sauria terrestria, Amphisbaenia. Gustav Fischer Verlag, Stuttgart, Germany, 249 pp.
- Estes, R., K. de Queiroz, and J. Gauthier. 1988. Phylogenetic relationships within Squamata; pp. 119–281 in R. Estes and G. Pregill (eds), Phylogenetic relationships of the lizard families: Essays commemorating Charles L. Camp. Stanford University Press, Stanford, California.
- Evans, S. E. 2008. The skull of lizards and tuatara; pp. 1–347 in C. Gans, A. S. Gaunt, and K. Adler (eds), Biology of the Reptilia. Vol. 20: Morphology H: The skull of Lepidosauria. Society for the Study of Amphibians and Reptiles, Ithaca, New York.
- Faunmap Working Group. 1996. Spatial response of mammals to late Quaternary environmental fluctuations. Science 272:1601–1606.
- Fitzinger, L. 1843. Systema Reptilium, fasciculus primus, Amblyglossae. Braumüller et Seidel, Wien: 106 pp.
- Flood, J. M. 1973. The moth-hunters: investigations towards a prehistory of the south-eastern highlands of Australia. PhD dissertation, Australian National University, Canberra, Australia.
- Ford, L. S., and D. C. Cannatella. 1993. The Major Clades of Frogs. Herpetological Monographs, 7:94.
- Fraser, R. A., and R. T. Wells. 2006. Palaeontological excavation and taphonomic investigation of the Pleistocene fossil deposit in Grant Hall, Victoria Fossil Cave,Naracoorte, South Australia. Alcheringa Special Issue 1:147–161.
- Freudenthal, M., Martín-Suárez, E., Gallardo, J. A., Daroca, A. G.-A., and R. Minwer-Barakat. 2009. The application of Correspondence Analysis in palaeontology. Comptes Rendus Palevol, 8:1–8.
- Fujioka, T., and J. Chappell. 2010. History of Australian aridity: chronology in the evolution of arid landscapes. Geological Society, London, Special Publications 346:121–139.
- Fusco, D. A., M. C. McDowell, and G. J. Prideaux. 2016. Late-Holocene mammal fauna from southern Australia reveals rapid species declines post-European settlement: implications for conservation biology. The Holocene 26:699–708.
- Gauthier, J., M. Kearney, J. A. Maisano, O. Rieppel, and A. Behlke. 2012. Assembling the squamate tree of life: Perspectives from the phenotype and the fossil record. Bulletin of the Peabody Museum of Natural History 53:1–308.
- Gelnaw, W. B. 2011. On the cranial osteology of Eremiascincus and its use for identification. Masters’ thesis, East Tennessee State University, Johnson City, Tennessee, 252 pp.
- Gill, B.I. 1985. Subfossil bones of a large skink (Reptilia: Lacertilia) from Motutapu Island, New Zealand. Records of the Auckland Institute and Museum 22:69–76.
- Gray, J. E. 1825. A synopsis of the genera of reptiles and Amphibia, with adescription of some new species. Annals of Philosophy 10:193–217.
- Gray, J. A., M. C. McDowell, M. N. Hutchinson, and M. E. H. Jones. 2017. Geometric morphometrics provides an alternative approach for interpreting the affinity of fossil lizard jaws. Journal of Herpetology 51:375–382.
- Greenacre, M. 1992. Correspondence analysis in medical research. Statistical Methods in Medical Research 1:97–117.
- Greer, A. E. 1979. A phylogenetic subdivision of Australian skinks. Records of the Australian Museum 32:339–371.
- Greer, A. E. 1989. The Biology and Evolution of Australian Lizards. Surrey Beatty and Sons, Chipping Norton, Australia, 264 pp.
- Hammer, Ø., Harper, D. A. T., and P. D. Ryan. 2001. Past: Paleontological Statistics Software Package for Education and Data Analysis. Palaeontologia Electronica 4:4–9.
- Harding, C. L. 2005. Wetland Inventory for the Fleurieu Peninsula, South Australia. Department for Environment and Heritage, Adelaide, Australia, 125 pp.
- Hardwicke, T., and J. E. Gray. 1827. A synopsis of the species of saurian reptiles, collected in India by Major-General Hardwicke. Zoological Journal, London 3: 213–229.
- Hesse, P. P., J. W. Magee, and S. van der Kaars. 2004. Late Quaternary climates of the Australian arid zone: A review. Quaternary International 118–119:87–102.
- Hipsley, C. A., R. Aguilar, J. R. Black, and S. A. Hocknull. 2020. High-throughput microCT scanning of small specimens: preparation, packing, parameters and post-processing. Scientific Reports 10:13863.
- Hocknull, S. A. 2002. Comparative maxillary and dentary morphology of the Australian dragon (Agamidae: Squamata): a framework for fossil identification. Memoirs of the Queensland Museum 48:125–145.
- Hocknull, S. A. 2005. Ecological succession during the late Cainozoic of central eastern Queensland: extinction of a diverse rainforest community. Memoirs of the Queensland Museum 51:39–122.
- Hocknull, S. A. 2009. Late Cainozoic rainforest vertebrates from Australopapua: evolution, biogeography and extinction. PhD dissertation, University of New South Wales, Sydney, Australia.
- Hocknull, S. A., J. Zhao, Y. Feng. G. E. Webb. 2007. Responses of Quaternary rainforest vertebrates to climate change in Australia. Earth and Planetary Science Letters 264:317–331.
- Hogg, A. G., Heaton, T. J., Hua, Q., Palmer, J. G., Turney, C. S., Southon, J., Bayliss, A., Blackwell, P. G., Boswijk, G., Bronk Ramsey, C., Pearson, C., Petchey, F., Reimer, P., Reimer, R., and L. Wacker. 2020. SHCal20 Southern Hemisphere Calibration, 0–55,000 Years cal BP. Radiocarbon 62:759–778.
- Hollenshead, M. G., J. I. Mead, and S. L. Swift. 2011. Late Pleistocene Egernia group skinks (Squamata: Scincidae) from Devils Lair, Western Australia. Alcheringa 35:31–51.
- Hope, G., A. P. Kershaw, S. van der Kaars, S. Xiangjun, P.-M. Liew, L. E. Heusser, H. Takahara, M. McGlone, N. Miyoshi, and P. T. Moss. 2004. History of vegetation and habitat change in the Austral-Asian region. Quaternary International 118–119:103–126.
- Hope, J. H. 1973. Analysis of bone from Cloggs Cave; pp. 1–18 in J. M. Flood, The moth-hunters: investigations towards a prehistory of the south-eastern highlands of Australia, Appendix XIV. PhD dissertation, Australian National University, Canberra, Australia.
- Hope, J. H., R. J. Lampert, E. Edmondson, M. J. Smith, and G. F. van Tets. 1977. Late Pleistocene faunal remains from Seton rock shelter, Kangaroo Island, South Australia. Journal of Biogeography 4:363–385.
- Hutchinson, M. N. 1992. Origins of the Australian scincid lizards: a preliminary report of the skinks of Riversleigh. The Beagle, Records of the Northern Territory Museum of Arts and Sciences 9:61–70.
- Hutchinson, M. N. 1993. Family Scincidae; pp. 261–279 in C. J. Glasby, G. J. B. Ross, and P. L. Beesley (eds.), Fauna of Australia, Vol. 2A, Amphibia Reptilia. Australian Government Publishing Service, Canberra, Australia.
- Jass, C. N., and J. D. Gardner. 2013. Herpetofaunas from the “overburden” (Quaternary) of western Canada. Earth and Environmental Science Transactions of the Royal Society of Edinburgh, 103:583–595.
- Jennings, J. N. 1968. Recent Australian contributions on pipes, foibe, and climatic history from speleological evidence. Helictite 6:50–56.
- Jouzel, J., V. Masson-Delmotte, O. Cattani, G. Dreyfus, S. Falourd, S. Falourd, G. Hoffmann, B. Minster, J. Nouet, J. M. Barnola, J. Chappellaz, H. Fischer, J. C. Gallet, S. Johnsen, M. Leuenberger, L. Loulergue, D. Luethi, H. Oerter, F. Parrenin, G. Raisbeck, D. Raynaud, A. Schilt, J. Schwander, E. Selmo, R. Souchez, R. Spahni, B. Stauffer, J. P. Steffensen, B. Stenni, T. F. Stocker, J. L. Tison, M. Werner, and E. W. Wolff. 2007. Orbital and millennial Antarctic climate variability over the past 800,000 years. Science 317:793–796.
- Kemp, M. E., and E. A. Hadly. 2015. Extinction biases in Quaternary Caribbean lizards. Global Ecology and Biogeography 24:1281–89.
- Kemp, M. E., and E. A. Hadly. 2016a. Early Holocene turnover, followed by stability, in a Caribbean lizard assemblage. Quaternary Research 85:255–261.
- Kemp, M. E., and E. A. Hadly. 2016b. Rocking Earth’s biodiversity cradle: challenges, advances, and prospects for conservation paleontology in the tropics. Journal of Vertebrate Paleontology 36:e1179640.
- Kershaw, P., P. Moss, and S. van der Kaars. 2003. Causes and consequences of long-term climatic variability on the Australian continent. Freshwater Biology 48:1274–1283.
- Kley, N. J. 2001. Prey transport mechanisms in blindsnakes and the evolution of unilateral feeding systems in snakes. American Zoologist 41:1321–1337.
- Knowles, L. L. (2000). Tests of Pleistocene speciation in montane grasshoppers (genus Melanoplus) from the sky islands of western North America. Evolution 54:1337–1348.
- Kos, A. M. 1998. Geological and taphonomic investigations of a pitfall cave fossil deposit (McEachern’s Deathtrap Cave G-49/50), Lower Glenelg National Park, Southwest Victoria. PhD dissertation, Monash University, Melbourne, Australia.
- Kos, A. M. 2001. Stratigraphy, sedimentary development and palaeoenvironmental context of a naturally accumulated pitfall cave deposit from south-eastern Australia. Australian Journal of Earth Sciences 48:621–632.
- Kos, A. M. 2003a. Characterisation of post-depositional taphonomic processes in the accumulation of mammals in a pitfall cave deposit from southeastern Australia. Journal of Archaeological Science 30:781–796.
- Kos, A. M. 2003b. Pre-burial taphonomic characterization of a vertebrate assemblage from a pitfall cave fossil deposit in southeastern Australia. Journal of Archaeological Science 30:769–779.
- Lawing, A. M., J. J. Head, and P. D. Polly. 2012. The ecology of morphology: the ecometrics of locomotion and macroenvironment in North American snakes; pp. 117–146 in J. Louys (ed.), Palaeontology in ecology and conservation. Springer, Heidelberg, Germany.
- Lee, M. S. Y., M. N. Hutchinson, T. H. Worthy, M. Archer, A. J. D. Tennyson, J. P. Worthy, and R. P. Scofield. 2009. Miocene skinks and geckos reveal long-term conservatism of New Zealand’s lizard fauna. Biology Letters 5:833–837.
- Lopez dos Santos, R. A., M. I. Spooner, T. T. Barrows, P. de Deckker, J. S. Sinninghe Damsté, and S. Schouten. 2013. Comparison of organic (UK’37, TEXH86, LDI) and faunal proxies (foraminiferal assemblages) for reconstruction of late Quaternary sea-surface temperature variability from offshore southeastern Australia. Paleoceanography 28:377–387.
- Lundelius, E. L. Jr. 1960. Post Pleistocene faunal succession in Western Australia and its climatic interpretation. International Geological Congress XXI:142–153.
- Lundelius, E. L. Jr. 1983. Climatic implications of Late Pleistocene and Holocene faunal associations in Australia. Alcheringa 7:125–149.
- Martin, J. E., M. N. Hutchinson, R. Meredith, J. A. Case, and N. S. Pledge. 2004. The oldest genus of scincid lizard (Squamata) from the Tertiary Etadunna formation of South Australia. Journal of Herpetology 38:180–187.
- McCarthy, C. J. 1985. Monophyly of elapid snakes (Serpentes: Elapidae). An assessment of the evidence. Zoological Journal of the Linnean Society 83:79–93.
- McMenamin, S. K., E. A. Hadly, and C. K. Wright. 2008. Climatic change and wetland desiccation cause amphibian decline in Yellowstone National Park. Proceedings of the National Academy of Sciences, 105(44), 16988–16993. https://doi.org/10.1073/pnas.0809090105
- Melville, J., K. Chaplin, C. A. Hipsley, S. Sarre, J. Sumner, and M. N. Hutchinson. 2019. Integrating phylogeography and high-resolution x-ray CT reveals five new cryptic species and multiple hybrid zones among Australian earless dragons. Royal Society Open Science 6:191166.
- Nelson, D. M., M. A. Urban, A. P. Kershaw, and F. S. Hu. 2016. Late-Quaternary variation in C3 and C4 grass abundance in southeastern Australia as inferred from δ 13 C analysis: Assessing the roles of climate, pCO2 and fire. Quaternary Science Reviews 139:67–76.
- Nenadic, O., and M. Greenacre. 2007. Correspondence Analysis in R, with two- and three-dimensional graphics: The ca package. Journal of Statistical Software 20:1–13.
- Oksanen, J., G. Blanchet, M. Friendly, R. Kindt, P. Legendre, D. McGlinn, P. R. Minchin, R. B. O'Hara, G. L. Simpson, P. Solymos, M. H. H. Stevens, E. Szoecs, and H. Wagner (2019). vegan: Community Ecology Package. R package version 2.5-4. Available at https://CRAN.R-project.org/package=vegan
- Oppel, M. 1811. Die Ordnungen, Familien und Gattungen der Reptilien als Prodrom einer Naturgeschichte derselben. Joseph Lindauer, Munich, xii + 87 pp.
- Owens, H., and A. Graham, (eds.). 2009. Census of South Australian Vertebrates. Department of Environment and Natural Resources, South Australia and South Australian Museum. eBook (October 2013), 159 pp.
- Palombo, M. 2018. Advances in Quaternary Studies: The Contribution of the Mammalian Fossil Record. Quaternary 1:26.
- Parsons T. S., and E. E. Williams. 1962. The teeth of amphibia and their relation to amphibian phylogeny. Journal of Morphology 110:375–389.
- Pepper, M., Barquero, M. D., Whiting, M. J., and J. S. Keogh. 2014. A multi-locus molecular phylogeny for Australia’s iconic Jacky Dragon (Agamidae: Amphibolurus muricatus): Phylogeographic structure along the Great Dividing Range of south-eastern Australia. Molecular Phylogenetics and Evolution 71:149–156.
- Pianka, E. R. 1989. Desert Lizard Diversity: Additional Comments and Some Data. The American Naturalist, 134:344–364.
- Pledge, N. S. 1990. The upper fossil fauna of the Henschke Fossil Cave, Naracoorte, South Australia. Memoirs of the Queensland Museum, 28:247–262.
- Powney, G. D., Grenyer, R., Orme, C. D. L., Owens, I. P. F., and S. Meiri. 2010. Hot, dry and different: Australian lizard richness is unlike that of mammals, amphibians and birds. Global Ecology and Biogeography 19:386–396.
- Prescott, G. W., D. R. Williams, A. Balmford, R. E. Green, and A. Manica. 2012. Quantitative global analysis of the role of climate and people in explaining late Quaternary megafaunal extinctions. Proceedings of the National Academy of Sciences of the United States of America 109:4527–4531.
- Price, G. J. S., and I. H. Sobbe. 2005. Pleistocene palaeoecology and environmental change on the Darling Downs, southeastern Queensland, Australia. Memoirs of the Queensland Museum 51:171–201.
- Prideaux, G. J., R.G. Roberts, D. Megirian, K. G. Westaway, J. C. Hellstrom, and J. M. Olley. (2007a). Mammalian responses to Pleistocene climate change in southeastern Australia. Geology 35:33–36
- Prideaux, G. J., G. A. Gully, A. M. C. Couzens, L. K. Ayliffe, N. R. Jankowski, Z. Jacobs, R. G. Roberts, J. C. Hellstrom, M. K. Gagan, and L. M. Hatcher. 2010. Timing and dynamics of Late Pleistocene mammal extinctions in southwestern Australia. Proceedings of the National Academy of Sciences of the United States of America 107:22157–22162.
- Prideaux, G. J., J. A. Long, L. K. Ayliffe, J. C. Hellstrom, B. Pillans, W. E. Boles, M. N. Hutchinson, R. G. Roberts, M. L. Cupper, L. J. Arnold, P. D. Devine, and N. M. Warburton. (2007b). An arid adapted Middle Pleistocene vertebrate fauna from South-Central Australia. Nature 445:422–425
- Pyron, R. A., F. T. Burbrink, G. R. Colli, A. N. M. de Oca, L. J. Vitt, C. A. Kuczynski, and J. J. Wiens. 2011. The phylogeny of advanced snakes (Colubroidea), with discovery of a new subfamily and comparison of support methods for likelihood trees. Molecular Phylogenetics and Evolution 58:329–342.
- Quigley, M. C., T. Horton, J. C. Hellstrom, M. L. Cupper, and M. Sandiford. 2010. Holocene climate change in arid Australia from speleothem and alluvial records. The Holocene 20:1093–1104.
- Quoy, J.R., and J.P. Gaimard. 1824. Zoologie. In: M.L. de Freycinet: Voyage Autour du Monde, Entrepris par le ministére et conformément aux instructions de s. exc. M. le Vicomte du Bouchage, Secrétaire d'etat au Department de la Marine, Exécuté sur les corvettes de S.M. l'Uranie et la Paris. iv + 712 pp.
- R Core Team. 2019. R: A language and environment for statistical computing. R Foundation for Statistical Computing, Vienna, Austria. Available at https://www.R-project.org/.
- Ramm, T., Cantalapiedra, J. L., Wagner, P., Penner, J., Rödel, M.-O., and J. Müller. 2018. Divergent trends in functional and phylogenetic structure in reptile communities across Africa. Nature Communications, 9:4697.
- Reed, E. H., and S. J. Bourne. 2000. Pleistocene fossil vertebrate sites of the South East region of South Australia. Transactions of the Royal Society of South Australia 124:61–90.
- Reed, E. H., and S. J. Bourne. 2009. Pleistocene fossil vertebrate sites of the southeast region of south Australia II. Transactions of the Royal Society of South Australia 133:30–40.
- Robertson, P. and A. J. Coventry. 2019. Reptiles of Victoria. A Guide to Identification and Ecology. CSIRO Publishing, Clayton South, Victoria, Australia, 323 pp.
- Ročková, H., and Z. Roček. 2005. Development of the pelvis and posterior part of the vertebral column in the Anura. Journal of Anatomy 206:17–35.
- Scanlon, J. D., M. S. Y. Lee, and M. Archer. 2003. Mid-tertiary elapid snakes (Squamata, Colubroidea) from Riversleigh, northern Australia: early steps in a continent-wide adaptive radiation. Geobios 36:573–601.
- Schulte, J. A., J. Melville, and A. Larson. 2003. Molecular phylogenetic evidence for ancient divergence of lizard taxa either side of Wallace’s Line. Proceedings of the Royal Society of London Series B Biological Sciences 270:597–603.
- Shea, G. M. 1990. The genera Tiliqua and Cyclodomorphus (Lacertilia: Scincidae): generic diagnoses and systematic relationships. Memoirs of the Queensland Museum 32:495–520.
- Shea, G. M., and M. N. Hutchinson. 1992. A new species of lizard (Tiliqua) from the Miocene of Riversleigh. Memoirs of the Queensland Museum 32:303–310.
- Smith, M. J. 1976. Small fossil vertebrates from Victoria Cave, Naracoorte, South Australia. IV, Reptiles. Transactions of the Royal Society of South Australia 100:39–51.
- Smith, M. J. 1982. Reptiles from Late Pleistocene deposits on Kangaroo Island, South Australia. Transactions of the Royal Society of South Australia 106:61–66.
- Terribile, L. C, M. Á. Olalla-Tárraga, I. Morales-Castilla, M. Rueda, R. M. Vidanes, M. A. Rodríguez, and J. A. F. Diniz-Filho. 2009. Global richness patterns of venomous snakes reveal contrasting influences of ecology and history in two different clades. Oecologia 159:617.
- Thorn, K. M., R. Roe, A. Baynes, R. P. Hart, K. A. Lance, D. Merrilees, J. K. Porter, and S. Sofoulis. 2017. Fossil mammals of Caladenia Cave, northern Swan Coastal Plain, south-western Australia. Records of the Western Australian Museum 32:217–236.
- Tyler, M. J. 1977. Pleistocene frogs from caves at Naracoorte, South Australia. Transactions of the Royal Society of South Australia 101:85–89.
- Uetz, P., P. Freed, and J. Hošek. 2020. The Reptile Database. Available at http://www.reptile-database.org. Accessed October 17, 2020.
- Vermillion, W. A., P. D. Polly, J. J. Head, J. T. Eronen, and A. M. Lawing AM. 2018. Ecometrics: A trait-based approach to paleoclimate and paleoenvironmental reconstruction; pp. 371–392 in D. A. Croft, D. F. Su, and S. W. Simpson (eds.), Methods in paleoecology: Reconstructing Cenozoic terrestrial environments and ecological communities. Springer, Heidelberg, Germany.
- Villa, A., E. Tschopp, G. L. Georgalis, and M. Delfino. 2017. Osteology, fossil record and palaeodiversity of the European lizards. Amphibia-Reptilia 38:79–88.
- Vitt, L. J., and J. P. Caldwell. 2009. Herpetology: An Introductory Biology of Amphibians and Reptiles. Third Edition. Academic Press, Burlington, Massachusetts, 720 pp.
- Wagler, J. G. 1830. Natürliches System der Amphibien: mit vorangehender Classification der Säugethiere und Vögel. Ein Beitrag zur vergleichenden Zoologie. München, Stuttgart und Tübingen. In der J.G. Cotta’scchen Buchhandlung.
- Wakefield, N. A. 1967. Preliminary report on McEachern’s Cave, S.W. Victoria. The Victorian Naturalist 84:363–383.
- Wakefield, N. A. 1969. Interpretation of data from McEachern’s Cave, S.W. Victoria. Helictite 7:17–20.
- Wakefield, N. A. 1972. Palaeoecology of fossil mammal assemblages from some Australian caves. Proceedings of the Royal Society of Victoria 85:1–26.
- Welch, K. R. G.1982. Herpetology of the Old World. II. Preliminary comments on the classification of skinks (Family Scincidae) with specific reference to those genera found in Africa, Europe, and southwest Asia. Herptile 7:25–27.